for the Detection of Different Analytes
Dissertation
zur Erlangung des Doktorgrades der Naturwissenschaften (Dr. rer. nat.)
der Fakultät für Chemie und Pharmazie der Universität Regensburg
vorgelegt von Thomas Zanni aus Feltre, Italien
2015
Date of submission: 21.05.2015
Date of the colloquium: 10.07.2015
Board of examiners: Prof. Dr. Olga Garcia Mancheño (Chair) Prof. Dr. Burkhard König (1st Referee) Prof. Dr. Joachim Wegener (2nd Referee)
Chapter 1. Introduction ... 1
1.1 BACKGROUND ON VESICULAR CHEMOSENSORS ... 2
1.2 REFERENCES ... 4
Chapter 2. A bis (zinc-cyclen)–biotin conjugate probe for detection of phosphoproteins in western blot analysis ... 7
2.1 INTRODUCTION ... 8
2.2 RESULTS AND DISCUSSION ... 10
2.2.1 Protein detection with BSA as blocking agent ... 10
2.2.2 pDNA detection ... 11
2.2.3 α-s1-Casein detection with overnight ovalbumin blocking ... 12
2.3 CONCLUSION ... 16
2.4 EXPERIMENTAL SECTION ... 17
2.5 REFERENCES ... 19
Chapter 3. SPR and QCM-D investigations of functionalized supported membranes ... 21
3.1 INTRODUCTION ... 22
3.1.1 Description of the vesicular systems used ... 23
3.1.2 Different experimental approaches ... 24
3.2 RESULTS AND DISCUSSION ... 27
3.2.1 Interaction of analytes with supported membranes monitored by SPR ... 27
3.2.2 Interaction of functionalized vesicles with surface immobilized analyte ... 33
3.2.3 Interaction of gold nanoparticles with supported membranes monitored by SPR ... 40
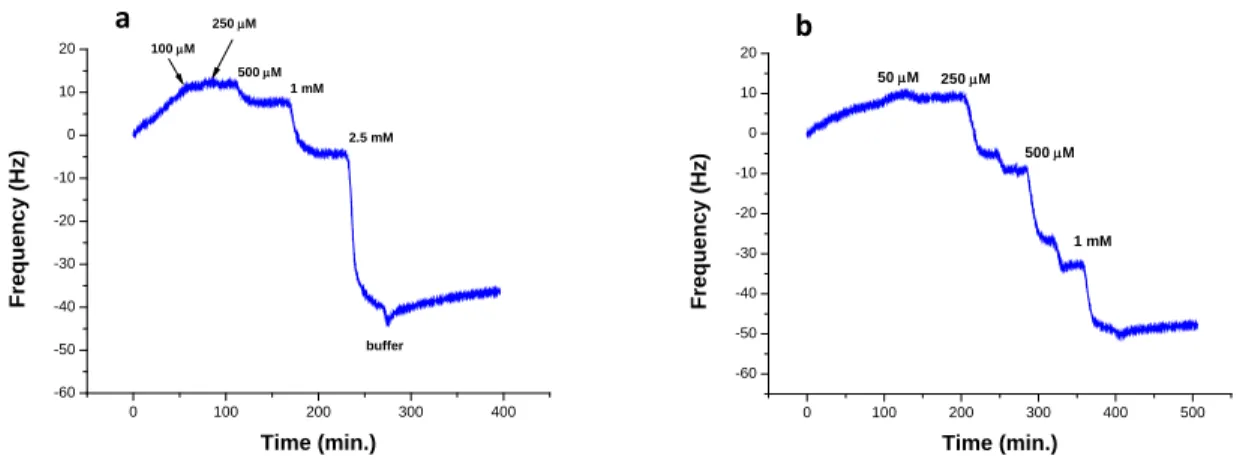
3.2.4 Affinity of selected peptides to supported functionalized membrane monitored by quartz crystal microbalance ... 42
3.4 EXPERIMENTAL SECTION ... 46
3.5 REFERENCES ... 49
Chapter 4. Fluorescence microscopy characterization of vesicular chemosensors ... 51
4.1 INTRODUCTION ... 52
4.2 RESULTS AND DICUSSION ... 55
4.2.1 MC540 as reporting dye in vesicular chemosensors ... 55
4.2.2 STORM and TIRFM characterization of vesicular chemosensors ... 58
4.3 CONCLUSION ... 61
4.4 EXPERIMENTAL SECTION ... 62
4.5 REFERENCES ... 64
Chapter 5. Investigations of functionalized vesicular systems for monitoring of β- lactamases ... 67
5.1 INTRODUCTION ... 68
5.2 RESULTS AND DISCUSSION ... 71
5.2.1 Synthesis of the amphiphilic ampicillin (Amp-C18) derivative ... 71
5.2.2 First approach: dye-encapsulating vesicles ... 71
5.2.3 Second approach: amphiphilic dye and Amp-C18 doped vesicular systems ... 75
5.2.4 Third approach: fluorophore embedded in membrane, ampicillin in solution ... 78
5.3 CONCLUSION ... 86
5.4 EXPERIMENTAL SECTION ... 87
5.4.1 General ... 87
5.4.2 Synthesis ... 89
5.4.3 Dye-encapsulating vesicles ... 90
5.4.4 Amphiphilic dye and Amp-C18 doped vesicular systems ... 90
5.4.5 Fluorophore embedded in membrane, ampicillin in solution ... 90
5.5 REFERENCES ... 93
ZUSAMMENFASSUNG ... 97
LIST OF ABBREVIATIONS ... 99
CURRICULUM VITAE ... 103
ACKNOWLEDGEMENTS ... 105
Chapter 1
Introduction
Introduction
1.1 BACKGROUND ON VESICULAR CHEMOSENSORS
Over the past ten years, a part of the work in the König group focused on the development of new tools in molecular recognition. Firstly, a number of chemosensors was developed being able to reveal the presence of specific analytes in homogenous solution. The target molecules included biologically relevant peptides [1-3] as well as nucleotides [4]. The general approach to design such sensors involves the combination of one or more recognition moieties with a reporting one in the same molecule.
A further development in the field of chemosensors which partly reduces the often demanding synthesis of the sensors was achieved in the group by combining the recognition and the reporting elements in supramolecular structures such as liposomes.
Functionalized liposomes find countless applications ranging from bioanalysis [5] to medicinal chemistry [6] to model systems for cellular membranes [7, 8]. One of the main advantages of using liposomes is their relatively easy preparation and functionalization: molecules which possess a long alkyl chain can be embedded in the liposomes simply by self-assembly.
In the case of vesicular chemosensors, amphiphilic artificial receptors and amphiphilic dyes can be incorporated in phospholipid vesicles and be used to reveal the presence of analytes which are able to bind to the receptor. The sensing mechanism involves a reorganization of the embedded molecules upon binding of the analyte which provokes a change of the fluorescence emission intensity of the dye [9, 10]. The concept is shown in Figure 1.1.
Figure 1.1: Schematic representation of the vesicular chemosensors working principle. Embedded dyes and receptors are organized in patches on the surface of the vesicles. The binding of the analyte molecules to the receptors provokes the reorganization of such patches which induces a change in the fluorescence.
Thanks to the relatively easy preparation method, it is possible to embed different types of amphiphilic receptors and to induce cooperative effects between the embedded receptors resulting in better performances. Moreover, one of the advantages of having recognition elements embedded in the membrane is given by the fluidity of the membrane, which allows lateral diffusion of the molecules. Such lateral diffusion might be exploited to spatially arrange the embedded receptors [11]
and to develop sensors with higher affinities towards the target analytes, for example via imprinting techniques [12, 13].
The receptors can also be introduced on the surface via a post-functionalization approach [14], which avoids a part of the synthetic effort to prepare the amphiphilic receptors and is also suitable for more sophisticated recognition moieties, such as aptamers [15].
The work presented in this thesis is related to this branch of research in the König group. We are going to explore the possibility to investigate the concepts so far developed for the vesicular chemosensors using Surface Plasmon Resonance (SPR) and Quartz Crystal Microbalance (QCM) as alternative detection techniques. We are presenting fluorescence microscopy investigations of the vesicular systems in order to have deeper insight in the working mechanism of the vesicular chemosensors. Moreover, we attempt to broaden the research interest towards more biology relevant applications, such as detection of phosphoproteins in standard protein analysis and monitoring of β-lactamases activity.
Introduction
1.2 REFERENCES
1. Späth, A. and König, B., Binding of a hemoregulatory tetrapeptide by a bis-guanidinium crown ether. Tetrahedron, 2010. 66(32): p. 6019-6025.
2. Grauer, A., Riechers, A., Ritter, S. and König, B., Synthetic receptors for the differentiation of phosphorylated peptides with nanomolar affinities. Chemistry-A European Journal, 2008.
14(29): p. 8922-8927.
3. Bhuyan, M., Katayev, E., Stadlbauer, S., Nonaka, H., Ojida, A., Hamachi, I. and König, B., Rigid luminescent bis-zinc(II)-bis-cyclen complexes for the detection of phosphate anions and non- covalent protein labeling in aqueous solution. European Journal of Organic Chemistry, 2011(15): p. 2807-2817.
4. Schmidt, F., Stadlbauer, S. and König, B., Zinc-cyclen coordination to UTP, TTP or pyrophosphate induces pyrene excimer emission. Dalton Transactions, 2010. 39(31): p. 7250- 7261.
5. Liu, Q. and Boyd, B.J., Liposomes in biosensors. Analyst, 2013. 138(2): p. 391-409.
6. Allen, T.M. and Cullis, P.R., Liposomal drug delivery systems: from concept to clinical applications. Advanced Drug Delivery Reviews, 2013. 65(1): p. 36-48.
7. Hamada, T. and Yoshikawa, K., Cell-sized liposomes and droplets: real-world modeling of living cells. Materials, 2012. 5(12): p. 2292-2305.
8. Shen, H.H., Lithgow, T. and Martin, L., Reconstitution of membrane proteins into model membranes: seeking better ways to retain protein activities. International Journal of Molecular Sciences, 2013. 14(1): p. 1589-1607.
9. Gruber, B., Stadlbauer, S., Späth, A., Weiss, S., Kalinina, M. and König, B., Modular chemosensors from self-assembled vesicle membranes with amphiphilic binding sites and reporter dyes. Angewandte Chemie International Edition, 2010. 49(39): p. 7125-7128.
10. Gruber, B., Stadlbauer, S., Woinaroschy, K. and König, B., Luminescent vesicular receptors for the recognition of biologically important phosphate species. Organic & Biomolecular Chemistry, 2010. 8(16): p. 3704-3714.
11. Gruber, B., Balk, S., Stadlbauer, S. and König, B., Dynamic interface imprinting: high-affinity peptide binding sites assembled by analyte-induced recruiting of membrane receptors.
Angewandte Chemie International Edition, 2012. 51(40): p. 10060-10063.
12. Banerjee, S. and König, B., Molecular imprinting of luminescent vesicles. Journal of American Chemical Society, 2013. 135(8): p. 2967-2970.
13. Balk, S. and König, B., Thermally induced molecular imprinting of luminescent vesicles. Journal of Inclusion Phenomena and Macrocyclic Chemistry, 2014. 81(1-2): p. 135-139.
14. Müller, A. and König, B., Preparation of luminescent chemosensors by post-functionalization of vesicle surfaces. Organic & Biomolecular Chemistry, 2015. 13(6): p. 1690-1699.
15. Müller, A. and König, B., Vesicular aptasensor for the detection of thrombin. Chemical Communications, 2014. 50: p. 12665-12668.
Introduction
Chapter 2
A bis (zinc-cyclen)–biotin conjugate probe for
detection of phosphoproteins in western blot
analysis
A bis (zinc-cyclen)–biotin conjugate probe for detection of phosphoproteins in western blot analysis
2.1 INTRODUCTION
Phosphorylation and dephosphorylation at specific sites of proteins play a key role in a large number of cellular signal pathways and are involved in the regulation of a wide range of cellular functions [1- 3]. The discrimination between phosphorylated and non-phosphorylated proteins in standard analytical techniques is of great importance, both in mechanistic studies [4, 5] and for diagnostic purposes [6, 7]. A wide range of analytical strategies which mainly use mass spectrometry as a key method to investigate phosphorylation in biological systems has been reported in literature [8].
Gel electrophoresis is one of the most common techniques for analyzing protein mixtures. After separation, detection of proteins is typically performed by means of non-selective Coomassie Brilliant Blue (CBB) stain or silver stain. When selectivity is required, the separated proteins are transferred on a suitable membrane and specific detection is performed via immunodetection. For that purpose, several antibodies against phosphorylated proteins have been developed [9] and are currently employed.
Even if immunodetection on blotted proteins is a very well established approach, efforts have been made for developing alternative methods to detect phosphoproteins directly on the SDS gel or on membranes. For example Schulenberg and co-workers [10] as well as König and co-workers [11]
established fluorescent probes which selectively bind to phosphorylated proteins in standard protein analysis.
As a contribution to the field, we investigated a potentially selective probe for phosphorylated proteins to be used in western blot analysis. The probe consists of a bis (zinc-cyclen) moiety covalently linked to a biotin derivative. Bis (zinc-cyclen) based sensors have been reported [12, 13] to be able to detect selectively phosphate-containing biomolecules; while biotin, due to its strong affinity to avidins, is a well-known biotechnology tool, which is widely used for purification and detection purposes. In Scheme 2.1, we show the structure of the probe.
N N N N
NH N NH
NH NH N NH
NH
N N NH
O NH H HN
H S
O
Zn Zn
4
Scheme 2.1: Biotin-bis (zinc-cyclen) complex conjugate.
The probe is expected to bind to phosphorylated target species with the bis (zinc-cyclen) moiety and to be detected via interaction of the biotin with Streptavidin-Horseradish Peroxidase (HRP) and enhanced chemiluminescent ECL substrate. In Figure 2.1, we show a schematic representation of the assay.
Figure 2.2: Schematic representation of the assay. The probe binds to phosphorylated sites of the immobilized target molecule. The Streptavdidin-HRP binds to the biotin moiety and the ECL substrate reaction reveals the presence of the target molecule.
The assay scheme is analogue to a standard immunodetection assay, in which a primary antibody is used instead of the probe.
Probe Streptavidin-HRP
A bis (zinc-cyclen)–biotin conjugate probe for detection of phosphoproteins in western blot analysis
2.2 RESULTS AND DISCUSSION
We investigated highly phosphorylated α-S1-casein and plasmidic DNA (pDNA) as target analytes. The molecules were immobilized on the membranes via western blot (for the proteins) or dot blot (for the pDNA); the membranes were immersed in a solution of our bivalent probe, washed and then incubated with a Streptavidin-HRP solution. The detection was then performed with ECL substrate.
Several parameters had to be considered for the optimization of the assay, such as incubation and washing times, concentrations of the components in the different steps of the procedures and the choice of a proper blocking agent.
2.2.1 Protein detection with BSA as blocking agent
Figure 2.3 shows the CCD images of three membranes containing α-s1-casein, dephosphorylated α- S1-casein and ovalbumin. Different concentrations of the probe were used.
Figure 2.3: Ovalbumin (lane 1), α-s1-casein (2) and dephosphorylated α-s1-casein (3) (10 µg each) were blotted on membranes a, b c. 10-7 M (a), 10-6 M (b), 10-4 M (c) probe concentrations were employed. Membranes were blocked with BSA for 1 h.
Both α-S1-casein and dephosphorylated α-s1-casein are detected. No signal is observed for ovalbumin. The background signal is significantly larger for 10-4 M probe concentration.
In Figure 2.4, we show the CCD image of 5 membranes, each containing the same amount of α-s1- casein and treated with a different concentration of the probe.
a b c
1 2 3 1 2 3 1 2 3
Figure 2.4: 10 µg of α-s1-casein were blotted on each membrane. 10-4 M (a), 10-9M (b), 10-12M (c), 10-15M (d) and 0 M (e) probe concentrations were employed. Membranes were blocked with BSA for 1 h.
A band is present in all the membranes. With a probe concentration of 10-4 M, the background signal is larger. The influence of the probe concentration for membranes b to e seems to be not significant under these conditions.
2.2.2 pDNA detection
Figure 2.5 shows the CCD images of six membranes, each prepared by blotting a 1:10 dilution series of pDNA. We investigated how different blocking agents influence the ability of the probe to interact with pDNA. The blockings were performed overnight.
Figure 2.5: Each membrane contains a 1:10 dilution series (from 3 μg to 0.3 pg, from bottom to the top) of plasmidic DNA samples. BSA (a and b), ovalbumin (c and d) and milk powder (e and f) were used as blocking agent. Membranes a, c and e were treated with 10-5 M probe solutions, while membrane b, d and f were treated with 0 M probe solution.
a b c d e f
a b c d e
A bis (zinc-cyclen)–biotin conjugate probe for detection of phosphoproteins in western blot analysis
When milk powder or BSA are employed as blocking agents, no signal is present. With ovalbumin as blocking agent, a band is visible for 3 µg of pDNA, while lower amounts of pDNA do not give any signal.
The detection of pDNA using ovalbumin as blocking agent and 10-5 M probe concentration is reproducible (Figure 2.6).
Figure 2.6: Each membrane contains a 1:10 dilution series (from 3 μg to 0.3 pg, from bottom to the top) of pDNA samples.
Membranes a, c and e were treated with 10-5 M probe solution, while membranes b, d and f were not treated with the probe.
Different concentrations of Streptavidin-HRP were used: 0.2 μg/ml (a and b), 0.1 μg/ml (c and d) and 0.05 μg/ml (e and f).
2.2.3 α-s1-Casein detection with overnight ovalbumin blocking
In Figures 2.7 and 2.8, we show the CCD images of three nitrocellulose membranes incubated with different concentrations of the probe. In order to investigate the selectivity of the probe, we loaded on each membrane two non-phosphorylated control proteins (BSA and a non-phosphorylated polyhistidine tagged protein) in addition to α-s1-casein. 1.5 µg (Figure 2.7) and 10 µg (Figure 2.8) of each protein were blotted on the membranes.
a b c d e f
Figure 2.7: 1.5 µg of a polyhistidine tagged protein (lane 1), BSA (2) and α-s1-casein (3) were blotted on membranes a, b and c. 10-5 M (a), 0 M (b), 10-4 M (c) probe concentrations were employed.
Figure 2.8: 10 µg of a polyhistidine tagged protein (lane 1), BSA (2) and α-s1-casein (3) were blotted on membranes a, b and c. 10-5 M (a), 0 M (b) and 10-4 M (c) probe concentrations were employed.
The membranes which were not treated with the probe show no signal. Figures 2.7a and 2.7c show a weak band corresponding to α-s1-casein, while a well-defined band is observed in Figures 2.8a and 2.8c.
No signal is visible for the polyhistidine tagged protein. The presence of a weak signal at higher molecular weight, which is present in all the lanes, doesn’t allow us to determine whether the probe has an appreciable affinity to BSA.
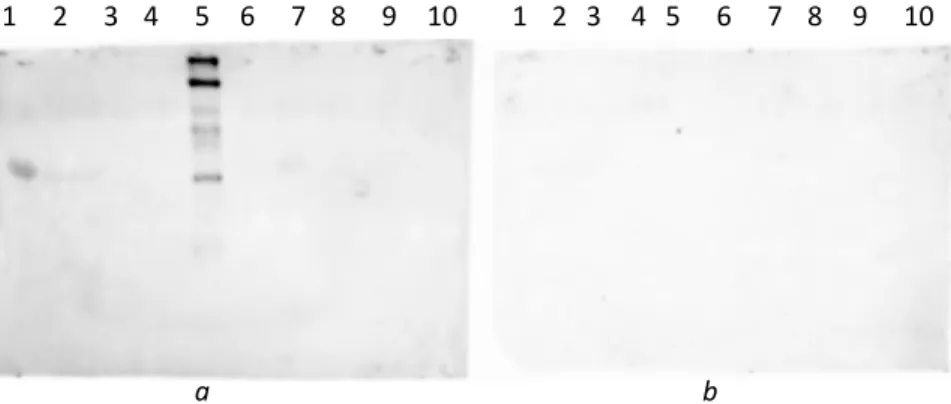
In Figure 2.9, we show the CCD images of two membranes blocked with ovalbumin overnight. The non-phosphorylated polyhistidine tagged control protein, a prestained molecular weight marker and standard (not prestained) molecular weight marker were blotted on the membranes.
a b c
1 2 3 1 2 3 1 2 3
1 2 3 1 2 3 1 2 3
a b c
A bis (zinc-cyclen)–biotin conjugate probe for detection of phosphoproteins in western blot analysis
Figure 2.9: α-s1-Casein (8 µg in lane 1, 1.5 µg in lane 7), dephosphorylated α-s1-casein (2 and 8), BSA (3 and 9), the polyhistidine tagged protein (4 and 10), prestained molecular weight marker (5), non-prestained molecular weight marker (6), were blotted on membranes a and b. 10-5 M (a) and 0 M (b) probe concentrations were employed.
No band was observed for the membrane in Figure 2.9b. In Figure 2.9a, a well-defined band corresponding to α-s1-casein is present in lane 1, while the same protein in lane 7 is barely visible.
Almost all proteins of the prestained molecular weight marker (lane 5) show a signal as well. No signal was observed for non-phosphorylated control proteins BSA (lanes 3 and 9) and the polyhistidine tagged protein (lanes 4 and 10). A rather weak signal is observed for dephosphorylated α-s1-casein in lane 2.
As a control experiment to verify the presence of the proteins on the membranes, the same membranes were stained with unspecific ponceau S staining (Figure 2.10).
Figure 2.10: Same membranes as in Figure 2.9 stained with ponceau S.
Ponceau S stained membranes have a red background due to the blocking agent. The polyhistidine tagged protein and BSA show a well-defined red band, while α-s1-casein and dephosphorylated α-s1-
1 2 3 4 5 6 7 8 9 10 1 2 3 4 5 6 7 8 9 10
a b
1 2 3 4 5 6 7 8 9 10 1 2 3 4 5 6 7 8 9 10
casein show no signal or negative signal. The non-prestained molecular weight marker show defined bands as well.
A bis (zinc-cyclen)–biotin conjugate probe for detection of phosphoproteins in western blot analysis
2.3 CONCLUSION
The blocking conditions were a crucial factor to evaluate the efficacy of the probe for phosphorylated protein detection. BSA turned out to be not appropriate: Figure 2.3 shows that detection of α-s1- casein is possible by use of the probe; however, further investigations (Figure 2.4) indicated that the signal observed for casein under those conditions is due to unspecific binding of Streptavidin-HRP to the casein. The main effect of the probe is to increase the background signal when it is used in a significant concentration (10-4 M).
The tests with pDNA as analyte allowed the optimization of the blocking conditions in terms of incubation time and blocking agent. Overnight incubation at 4 °C with ovalbumin turned out to be effective for detection of 3 µg of pDNA with good reproducibility (Figures 2.5 and 2.6). Variation of the concentration of Streptavidin-HRP conjugate didn’t show any improvement in the background signal neither in the limit of detection. The optimized detection of pDNA was performed by incubating overnight the membrane at 4°C with ovalbumin, followed by 1 h incubation with a 10-5 M solution of probe; after 3x10 min. washing steps, the membrane was soaked for 1 h in a solution of streptavidin-HRP washed 4x15 minutes and finally incubated with ECL substrate.
Under these conditions, the probe showed an appreciable affinity towards α-s1-casein.
Figures 2.9 and 2.10 demonstrate that the probe interacts selectively with α-s1-casein with a sufficient affinity to allow detection of 8 μg of protein; the probe is not able to bind with the same affinity to dephosphorylated α-s1-casein, BSA and the polyhistidine tagged protein. 1 µg of α-s1- casein seems to be close to the limit of detection of the method.
The rather poor performances of the assay can be rationalized considering two factors. Firstly, the order of magnitude of the binding constant between bis (zinc-cyclen) receptors and phosphorylated molecules in homogeneous aqueous solution: for similar sensors, the reported affinity is in the µM range [14], which is significantly weaker than the typical antibody-antigen affinity (characteristic of western blot detection); secondly, the ability of the bis (zinc-cyclen) moiety to weakly bind also to other negatively charged residues in a protein might explain the background signal observed in some experiments. The use of enzymatic amplification isn’t sufficient to overcome those limitations and to achieve better performances.
2.4 EXPERIMENTAL SECTION
Materials: BSA was from Roth GmbH, ovalbumin and α–S1-casein were purchased from Sigma- Aldrich, Tris from USB, Acrylamide from Fluka, λ-PPase from New England Biolabs, plasmidic DNA pBR322 DNA from Fermentas life science. The polyhistidine tagged protein was provided by Dr. Bernd Reisinger (Prof. Sterner group, Institute of Biophysics und physical Biochemistry, University of Regensburg). The probe was synthesized by Dr. Mouchumi Bhuyan [15]. If not otherwise specified, MilliQ water was employed.
Dephosphorylation of α-s1-casein: dephosphorylated α-s1-casein was prepared by incubating 40 µg of α-s1-casein with 400 Units of λ-PPase in Tris-HCl (50 M), NaCl (100 mM), dithiothreitol (2 mM), MnCl2
(2 mM), EGTA (0.1 mM), 0.01% Brij 35, pH 7.5, at 30 °C for 6 h.
SDS-PAGE: proteins were resolved in minigels under reducing and denaturating Laemmli conditions.
Stacking gel consisted of 5% acrylamide (w/v), 125 mM Tris-HCl (pH 6.8), 0.1% SDS (w/v); running gel consisted of 15% acrylamide, 375 mM Tris-HCl (pH 8.8), 0.1% SDS (w/v). Running buffer consisted of 25 mM Tris, 192 mM glycine, SDS 0.1% (w/v). Gels were run with PeqLab 45-1010i apparatus, at 150 V. Proteins samples were heated at 95 °C for 10 minutes in denaturating and reducing Rotiload 1 (Roth GmbH) sample buffer.
Western blot: proteins were transferred from gel to nitrocellulose membrane with BioRad Mini Trans Blot Electrophoretic Transfer Cell apparatus. 25 mM Tris, 192 mM glycine, 0.1% SDS (w/v) buffer was used for blotting. Blots were run at 125 V for 1 h.
Dot blot of pDNA samples: pDNA was immobilized by dot blot on nylon membranes. The dot blot instrument was provided by Dr. Jorge Perez-Fernandez (Prof. Tschochner group, Institute of Biochemistry, Genetics and Microbiology, University of Regensburg).
Standard detection procedure: after protein transfer, membranes were soaked in blocking buffer (40 mM Tris HCl, 300 mM NaCl, 1% (v/v) Tween 20 (pH 7.4), 5% (w/v) blocking agent) for 1 h or overnight at 4 °C. Membranes were then incubated with a solution of probe (different concentrations were employed, reported case by case in the result section of this chapter) in washing buffer (40 mM Tris HCl, 300 mM NaCl, 1% (v/v) Tween 20 (pH 7.4)) for 1 h. After washing, membranes were incubated with 0.2 μg/ml (in washing buffer) of Streptavidin-HRP for 30 minutes. Unbound Streptavidin-HRP
A bis (zinc-cyclen)–biotin conjugate probe for detection of phosphoproteins in western blot analysis
was washed away by 4 x 15 minutes washing with washing buffer. Detection was performed with ECL substrate (Super Signal West Dura). We used Fujifilm LAS 3000 system for documentation.
Ponceau S staining was performed by incubation of the membranes with 0.1% (w/v) Ponceau S solution in 5% AcOH for 1 h.
2.5 REFERENCES
1. Hunter, T., Protein kinase and phosphatase Yin and Yang of protein phsphorylation and signaling. Cell, 1995. 80: p. 225-236.
2. Hunter, T., Signaling - 2000 and Beyond. Cell, 2000. 100: p. 113-127.
3. Cohen, P., The origins of protein phosphorylation. Nature Cell Biology, 2002. 4: p. E127-E130.
4. Johnson, H. and White, F.M., Toward quantitative phosphotyrosine profiling in vivo. Seminar in Cell & Developmental Biology, 2012. 23(8): p. 854-862.
5. Salomon, A.R., Ficarro, S.B., Brill, L.M., Brinker, A., Phung, Q.T., Ericson, C., Sauer, K., Brock, A., Horn, D.M., Schultz, P.G. and Peters, E.C., Profiling of tyrosine phosphorylation pathways in human cells using mass spectrometry. Proceedings of the National Academy of Sciences of USA, 2003. 100(2): p. 443-448.
6. Bahk, Y.Y., Bari, M. and Youg, J.K., Biomedical application of phosphoproteomics in neurodegenerative diseases. Journal of Microbiology and Biotechnology, 2013. 23(3): p. 279- 288.
7. Mandell, J.W., Phosphorylation state-specific antibodies. The American Journal of Pathology, 2003. 163(5): p. 1687-1698.
8. Engholm-Keller, K. and Larsen, M.R., Technologies and challenges in large-scale phosphoproteomics. Proteomics, 2013. 13(6): p. 910-931.
9. Brumbaugh, K., Johnson, W., Liao, W.-C., Lin, M.-S., Houchins, J.P., Cooper, J., Stoesz, S. and Campos-Gonzalez, R., Overview of the generation, validation, and application of phosphosite- specific antibodies Signal Transduction Immunohistochemistry: Methods and Protocols, 2011.
717: p. 3-43.
10. Schulenberg, B., Goodman, T.N., Aggeler, R., Capaldi, R.A. and Patton, W.F., Characterization of dynamic and steady-state protein phosphorylation using a fluorescent phosphoprotein gel stain and mass spectrometry. Electrophoresis, 2004. 25(15): p. 2526-2532.
11. Riechers, A., Schmidt, F., Stadlbauer, S. and König, B., Detection of protein phosphorylation on SDS-PAGE using probes with a phosphate-sensitive emission response. Bioconjugate
A bis (zinc-cyclen)–biotin conjugate probe for detection of phosphoproteins in western blot analysis
12. Mizukami, S., Nagano, T., Urano, Y., Odani, A. and Kikuchi, K., A fluorescent anion sensor that works in neutral aqueous solution for bioanalytical application. Journal of American Chemical Society, 2002(124): p. 3920-3925.
13. Grauer, A., Riechers, A., Ritter, S. and König, B., Synthetic receptors for the differentiation of phosphorylated peptides with nanomolar affinities. Chemistry-A European Journal, 2008.
14(29): p. 8922-8927.
14. Gruber, B., Stadlbauer, S., Späth, A., Weiss, S., Kalinina, M. and König, B., Modular chemosensors from self-assembled vesicle membranes with amphiphilic binding sites and reporter dyes. Angewandte Chemie International Edition, 2010. 49(39): p. 7125-7128.
15. Bhuyan, M., Synthesis and exploration of functionalized zinc(II) and terbium(III) complexes as molecular probes. PhD dissertation, 2012.
Chapter 3
SPR and QCM-D investigations of functionalized
supported membranes
SPR and QCM-D investigations of functionalized supported membranes
3.1 INTRODUCTION
Functionalized amphiphilic vesicles containing metal complex binding sites and reporting dyes have been employed as chemosensors and as models to investigate the dynamics of molecules embedded in phospholipid membranes. The fluidity of the membrane, which depends on the chemical structure of the amphiphile and on the temperature, plays a key role in determining the properties of the functionalized vesicles.
When amphiphilic fluorescent dyes and amphiphilic artificial receptors are co-embedded in the liposomes bilayer, they form mixed patches. Molecules with affinity to the receptor induce a perturbation of such patches, which turns into a change in the fluorescence intensity. The functionalized liposomes can therefore be used as sensors [1, 2].
The mobility of the embedded molecules can be used to induce cooperative effects between different receptors in order to improve the selectivity and the affinity of the vesicular sensors. The recruiting of embedded receptors at the surface of a liquid crystalline membrane by a ditopic analyte has been demonstrated by a FRET assay [3]. The analyte induces a rearrangement of the receptors at the surface, which leads to an enhanced affinity between the analyte and the functionalized vesicles.
The possibility to conveniently rearrange the embedded receptors was employed to develop
“molecularly imprinted vesicles” via polymerization of the rearranged receptors. Polymerizable amphiphilic receptors are co-embedded in a liquid crystalline membrane of liposomes and incubated with a ditopic analyte which is able to arrange the receptors. The organized receptors are then polymerized in order to be kept at the right distance. The affinity of the polymerized vesicles for the analyte is higher compared to the non-polymerized ones [4].
The vesicular chemosensors concepts so far developed in the group employed fluorescence as detection technique. Fluorescence has many advantages over other techniques: it can easily provide a high sensitivity and high specificity, and it is usually a fast and easy to use method. The main drawback, at least for some applications, is that most of the molecules we are interested in are not fluorescent, therefore labeling or the inclusion of a fluorescent moiety in sensors design is necessary.
As alternative to the fluorescent vesicular chemosensors, we explore herein the possibility to transfer the above mentioned concepts to other techniques, such as Surface Plasmon Resonance (SPR) and Quartz Crystal Microbalance (QCM). The use of SPR and QCM to observe the same phenomena would in principle allow to validate the previous work and to open new perspectives in terms of applications.
SPR was first proposed as analytical technique in the early ’90s [5]. Since then, it was employed to investigate a large number of (bio)molecular interactions [6] and it became a standard method in the field of bioanalysis.
Supported membranes are employed in SPR assays as models of biological membranes to investigate membrane-protein/ligand [7], membrane/protein [8] and membrane/ligand interactions [9].
Functionalized liposomes are utilized in SPR based sensors as signal enhancers thanks to their large dimension, which provokes a large change in the refractive index even at relatively low concentrations [10].
The quartz crystal microbalance (QCM) was applied for the first time to investigate supported membranes in 1989 [11]. Since then, it has been employed as a tool to study the mechanisms of formation of solid supported bilayers [12, 13] as well as the interactions between the membranes and different classes of biomolecules [14].
The study of the arrangement and the dynamics of artificial receptors embedded in supported membranes by means of SPR and/or QCM has not been reported yet.
3.1.1 Description of the vesicular systems used
The first step for all the experiments that will be presented in the following paragraphs is the preparation of the functionalized vesicles. The vesicles are prepared by self-assembly of phospholipids and amphiphilic receptors and successive extrusion through a polycarbonate membrane to obtain a uniform size distribution of unilamellar vesicles. The components used for the preparation of the liposomes are the phospholipids 1,2-di-(9Z-octadecenoyl)-sn-glycero-3- phosphocholine (DOPC) and 1,2-distearoyl-sn-glycero-3-phosphocholine (DSPC), and a bis (zinc- cylcen) derivative (Zn2). The chemical structures are shown in Scheme 2.1.
SPR and QCM-D investigations of functionalized supported membranes
N N N
NH N N N N
H
H H
N N
N N
H H H
Zn2+ Zn2+
8
Zn2 =
N+ P O
O O
-O O
O R
R O O
DOPC:
DSPC:
3 3
7
R=
R=
Scheme 2.1: Structures of the Zn2 artificial receptor (left) and of the phospholipids DSPC and DOPC (right). The counter ions of the Zn2 receptor are omitted for clarity.
The Zn2+ metallorganic complexes are very well known to bind phosphorylated molecules, both in solution [15] and in vesicular chemosensors [1]. We used the Zn2 derivative as a model receptor, which was widely employed in previous studies on vesicular chemosensors in the group. For a series of experiments, the PEGylated phospholipid 1,2-distearoyl-sn-glycero-3-phosphoethanolamine-N- [methoxy(polyethylene glycol)-350] (ammonium salt) (DSPE-PEG350), shown in Scheme 2.2, was used.
NH P O
O O
-O O
R O R O
O O
(OCH2CH2)7OCH3 R= 7
Scheme 2.2: Structure of the phospholipid DSPE-PEG350.
3.1.2 Different experimental approaches
The investigation of the binding between functionalized vesicles and analytes with SPR or QCM can be done in different ways. A first approach is to immobilize the functionalized vesicles on the surface of the sensor chip and to investigate the binding of the analyte to that surface. In order to do that, we first used a very simple strategy described in [16], which is based on the formation of a self- assembled monolayer (SAM) of 11-mercaptoundecanoic acid (MUA) on the gold surface followed by immobilization of the vesicles. Figure 3.1 shows a schematic representation of such an approach. This
method was used as first choice as it looked straightforward and suitable for using a standardized immobilization strategy in each experiment and varying the analyte.
Figure 3.1: Graphical representation of the formation of the functionalized supported membrane on a SPR gold chip and of the binding of an analyte to the same surface.
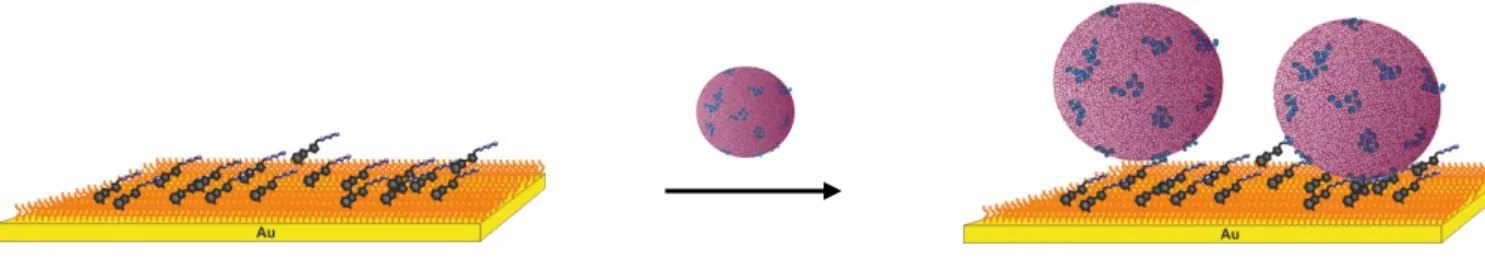
In order to overcome the poor sensitivity of both SPR and QCM when small analytes are investigated, we explored a second method inspired by the work of Massons and co-workers [17], which consisted in a displacement assay using gold nanoparticles. The approach relies on the saturation of the binding sites on the surface with functionalized nanoparticles and their subsequent displacement by the analyte as illustrated in Figure 3.2.
Figure 3.2: Graphical representation of the displacement assay using gold nanoparticles. The gold nanoparticles bind to the functionalized surface and are subsequently displaced by the analyte.
A third approach was based on the immobilization of the analyte on the surface and subsequent binding of the functionalized vesicles to the decorated sensor chip (Figure 3.3). Such an approach was used in a later stage of our investigation, when we were not able to overcome the sensitivity and selectivity problems encountered using the first two assays.
analyte analyte
MUA
SPR and QCM-D investigations of functionalized supported membranes
Figure 3.3: Graphical representation of the binding of functionalized liposomes to an analyte modified SPR gold chip.
The binding of the decorated vesicles to the analyte modified surface is expected to give a larger signal compared to the binding of the analyte to the functionalized supported membrane (first approach) and thus to overcome the sensitivity issue typically encountered with small analytes.
3.2 RESULTS AND DISCUSSION
3.2.1 Interaction of analytes with supported membranes monitored by SPR Formation of supported membranes on SPR gold chips
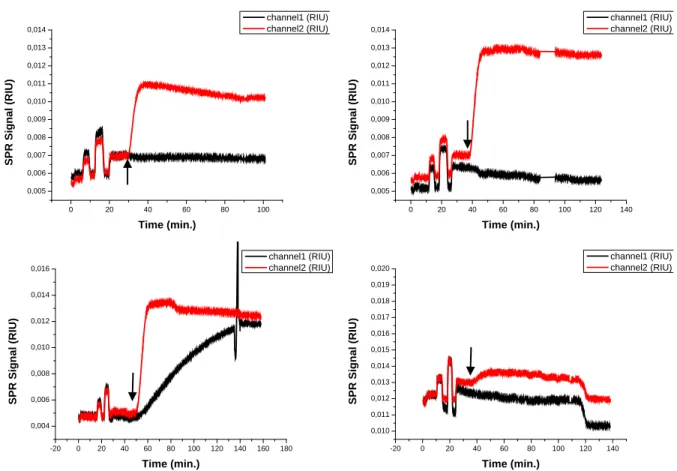
In Figure 3.4, we show the SPR sensorgrams obtained after injection of Zn2 doped DOPC vesicles on surfaces functionalized with different thiols: (3-mercaptopropyl)trimethoxysilane (MPTMS), 11- mercaptoundecanoic acid (MUA) and 16-mercaptohexadecanoic acid (MHDA).
Figure 3.4: SPR sensorgrams obtained after injection of Zn2 doped DOPC vesicles on gold chips functionalized with different thiols: (a) MPTMS, (b) MUA, (c) MHDA and (d) bare gold. In channel 2, Zn2 doped vesicles were injected, in channel 1 HEPES buffer solution (a, b and d) or non-functionalized DOPC vesicles (c) were injected. The arrow indicates the moment at which the vesicle solutions reach the sensor surface.
The sensorgrams were transformed into refractive index units (RIU) by calibration. In all cases, except for bare gold, it is possible to observe an increase of the SPR signal due to the formation of a
0 20 40 60 80 100
0,005 0,006 0,007 0,008 0,009 0,010 0,011 0,012 0,013 0,014
SPR Signal (RIU)
Time (min.)
channel1 (RIU) channel2 (RIU)
0 20 40 60 80 100 120 140
0,005 0,006 0,007 0,008 0,009 0,010 0,011 0,012 0,013 0,014
SPR Signal (RIU)
Time (min.)
channel1 (RIU) channel2 (RIU)
-20 0 20 40 60 80 100 120 140 160 180
0,004 0,006 0,008 0,010 0,012 0,014 0,016
SPR Signal (RIU)
Time (min.)
channel1 (RIU) channel2 (RIU)
-20 0 20 40 60 80 100 120 140
0,010 0,011 0,012 0,013 0,014 0,015 0,016 0,017 0,018 0,019 0,020
SPR Signal (RIU)
Time (min.)
channel1 (RIU) channel2 (RIU)
c d
a b
SPR and QCM-D investigations of functionalized supported membranes
supported membrane on the surface. A plateau is reached in a time scale of about 10-15 minutes and the total change of the SPR signal is in the range of 0,004 RIU and 0,007 RIU.
When non-doped DOPC vesicles are injected (Figure 3.4c), the signal increases with a slower kinetics and the plateau is reached in about 100 minutes. The total signal change is comparable with the total change for Zn2 doped vesicles.
Binding of proteins
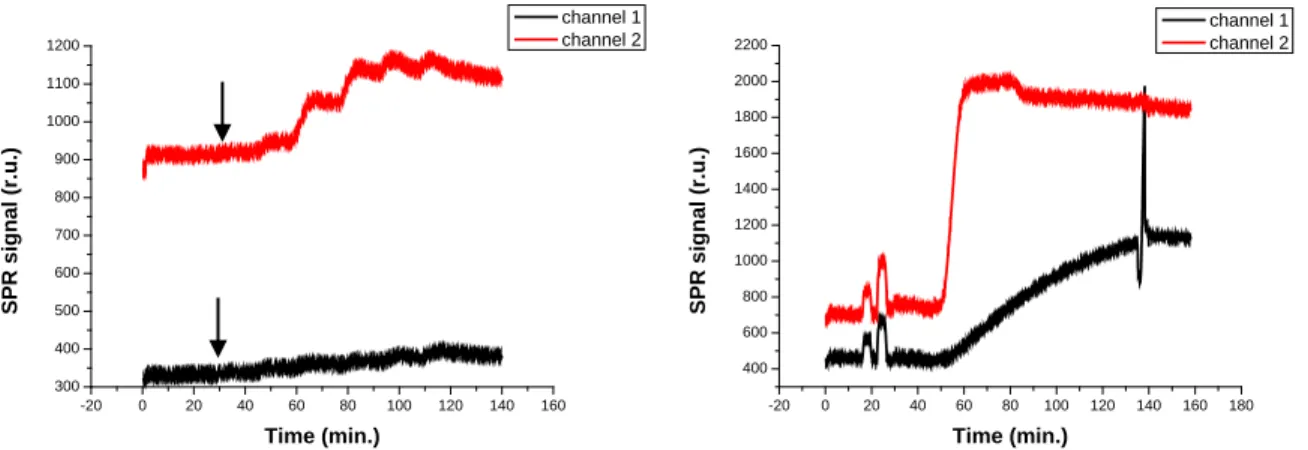
In Figures 3.5, 3.6, and 3.7, we show the SPR signals obtained after injection of α-s1-casein, dephosphorylated α-s1-casein and BSA on supported membranes.
Figure 3.5: SPR sensorgrams obtained after injection of increasing concentrations of α-s1-casein (50 nM, 100 nM, 250 nM 500 nM, 1 µM and 2 µM) on supported DOPC (channel 1) and Zn2 doped DOPC (channel 2) membranes (a); supported membranes formation (b). The arrow indicates the moment at which the solution of the lowest concentration reaches the sensor surface.
The injection of α-s1-casein solutions of different concentrations provokes an increase in the signal of both channels (Figure 3.5). The changes are larger for the surface modified with Zn2 doped membranes. Modest changes are observed when α-s1-casein solutions are injected on surfaces which do not contain Zn2.
Figure 3.6: SPR sensorgrams obtained after injection of increasing concentrations of BSA (50 nM, 100 nM, 250 nM, 500 nM, 1 µM and 2 µM) on supported DOPC (channel 1) and Zn2 doped DOPC (channel 2) membranes (a); supported membrane formation (b). The arrow indicates the moment at which the solution of the lowest concentration reaches the sensor surface.
-20 0 20 40 60 80 100 120 140 160
300 400 500 600 700 800 900 1000 1100 1200
SPR signal (r.u.)
Time (min.)
channel 1 channel 2
-20 0 20 40 60 80 100 120 140 160 180
400 600 800 1000 1200 1400 1600 1800 2000 2200
SPR signal (r.u.)
Time (min.)
channel 1 channel 2
0 20 40 60 80 100
0,004 0,006 0,008 0,010 0,012 0,014
SPR signal (RIU)
Time (min.)
channel 1 channel 2
-10 0 10 20 30 40 50 60 70 80
0 200 400 600 800 1000 1200 1400 1600 1800
SPR signal (r.u.)
Time (min.)
channel 1 channel 2
a b
a b
SPR and QCM-D investigations of functionalized supported membranes
The Zn2 doped supported membrane responds to the addition of BSA solutions of different concentrations on Zn2 doped supported membrane (Figure 3.6a). On the other hand, the injection of the same solutions on the non-functionalized surface doesn’t provoke any significant variation of the SPR signal.
Figure 3.7: SPR sensorgrams obtained after injection of increasing concentrations (50 nM, 100 nM, 250 nM, 500 nM and 1 µM) of dephosphorylated α-s1-casein on supported DOPC (channel 1) and Zn2 doped DOPC (channel 2) membranes (a);
supported membrane formation (b). The arrow indicates the moment at which the solution of the lowest concentration reaches the surface.
Surprisingly, when the dephosphorylated α-s1-casein reaches the modified surfaces, it causes a rather large variation of the SPR signal (Figure 3.7), which is comparable to the response observed for the phosphorylated α-s1-casein (Figure 3.5). The signal increase is more pronounced for the surface functionalized with Zn2 doped vesicles. If no receptor is present on the surface, the signal drops to the initial value after rinsing with buffer.
-20 0 20 40 60 80 100 120 140 160
400 600 800 1000 1200 1400 1600 1800
SPR signal (r.u.)
Time (min.)
channel 1 channel 2
0 50 100 150 200 250
0 500 1000 1500 2000 2500
SPR signal (r.u.)
Time (min.)
channel 1 channel2
a b
Binding of small analytes
In order to further explore the properties of the functionalized supported membranes, we studied less complex, smaller analytes. We chose the hexapeptide Ac-Gly-pSer-Ala-Ala-Ala-Leu-NH2 (Figure 3.8) and ATP (Figure 3.9) as target molecules, as they are both known to interact with Zn2 decorated vesicles [2, 3].
Figure 3.8: SPR sensorgrams obtained after injection of increasing concentrations of Ac-Gly-pSer-Ala-Ala-Ala-Leu-NH2(10 μM, 25 μM, 50 μM, 100 μM, 250 μM and 500 μM) on MUA SAM (channel 1) and supported Zn2 doped DOPC membrane (channel 2) (a); supported membrane formation (b). The arrow indicates the moment at which the solution of the lowest concentration reaches the surface.
Figure 3.9: SPR sensorgrams obtained after injection of increasing concentrations of ATP (25 μM, 50 μM, 100 μM, 250 μM 500 μM, 1 mM and 2 mM) on supported DOPC (channel 1) and Zn2 doped DOPC membranes (channel 2) (a); supported membranes formation (b). The arrow indicates the moment at which the solution of the lowest concentration reaches the sensor surface.
-20 0 20 40 60 80 100 120 140 160
0 200 400 600 800 1000 1200 1400
SPR signal (r.u.)
Time (min.)
channel1 channel2
0 20 40 60 80 100 120 140
0 500 1000 1500 2000 2500
SPR signal (r.u.)
Time (min.)
channel 1 channel 2
0 50 100 150
250 300 350 400 450 500
SPR signal (r.u.)
Time (min.)
channel 1 channel 2
0 50 100 150 200
-200 0 200 400 600 800 1000 1200 1400 1600 1800
SPR signal (r.u.)
Time (min.)
channel 1 channel 2
a b
a b
SPR and QCM-D investigations of functionalized supported membranes
Figure 3.10: Normalized graph obtained as difference between channel 2 and channel 1 of Figure 3.9a.
The injection of the hexapeptide solutions of different concentrations does not provoke any significant changes in the signal for both channels (Figure 3.8). The injection of ATP with increasing concentrations provokes a different change in the SPR signal for the two channels. The curve obtained by subtraction of channel 1 to channel 2 after calibration shows a concentration dependent response (Figure 3.10). The changes are at the very limit of detection and saturation of the signal is reached rather soon.
0 50 100 150
0,4 0,6 0,8 1,0 1,2
SPR signal (mRIU)
Time (min.)
difference
3.2.2 Interaction of functionalized vesicles with surface immobilized analyte
ATP was immobilized on the SPR surface and the binding of functionalized vesicles was investigated.
For that, ATP is coupled via amide coupling to the acidic function of MUA which is immobilized on the gold surface (Scheme 3.3).
O OH
SH SH
1. EDC/NHS
2. ATP
SH
O
SH SH
SH
OH OH O N N HN
N N
P O O
O-
O- O
P O
-O O
OPO-
Scheme 3.3: Reaction scheme of the attachment of ATP on the functionalized SPR surface via amide coupling.
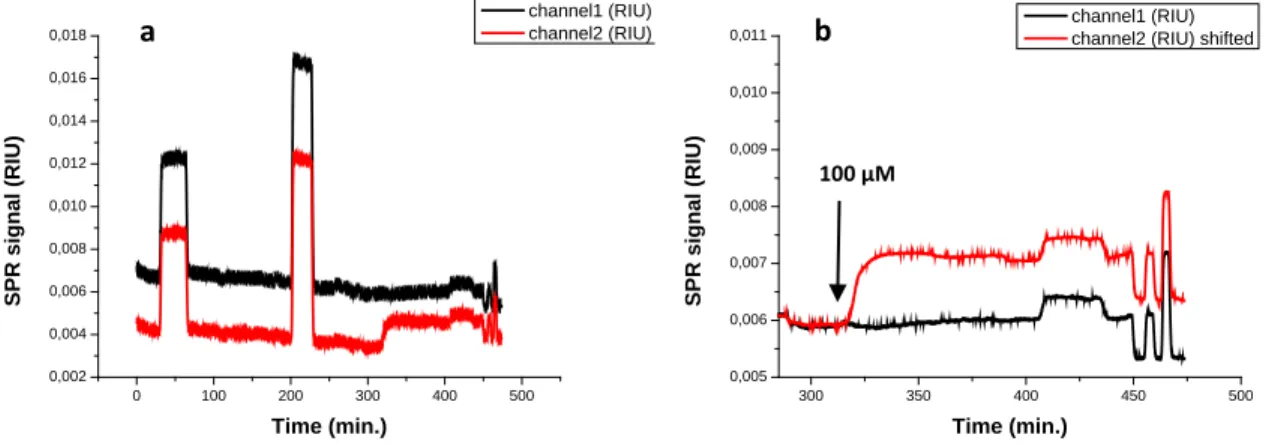
In Figure 3.11b, we show the sensorgrams obtained after injecting of Zn2 doped DOPC vesicles on an ATP modified surface (channel 2) and a non-ATP-modified surface (channel 1). The sensorgram in Figure 3.11a includes the functionalization step.
Figure 3.11: SPR sensorgrams obtained after injection of Zn2 doped DOPC vesicles on functionalized surfaces. The surface were first modified with a SAM of 1-heptanethiol and 11-mercaptoundecanoic acid (10:1); subsequently, channel 2 was treated with the procedure for ATP functionalization and channel 1 with the same procedure as channel 2 but leaving out ATP (from 200 to380 minutes) (a). Zoom of the last part of the same sensorgram (b). The curve for channel 2 is vertically shifted for better comparison.
0 100 200 300 400 500 600
0,004 0,006 0,008 0,010 0,012 0,014
SPR signal (RIU)
Time (min.)
channel1 (RIU) channel2 (RIU)
380 400 420 440 460 480 500
0,004 0,005 0,006 0,007 0,008 0,009 0,010 0,011 0,012
SPR signal (RIU)
Time (min.)
channel1 (RIU) channel2 (RIU)
a
10 μM
100 μM
b
SPR and QCM-D investigations of functionalized supported membranes
The two spikes at around 200 and 300 minutes (Figure 3.11a) are provoked by the injections of the EDC/NHS solution and the ethanolamine solution, which are part of the surface functionalization procedure. The two channels give the same change in the signal after injection of vesicles of a total amphiphile concentration of 10 µM. A difference in the signal variation is observed after injection of vesicles of total amphiphile concentration of 100 µM. As expected, the Zn2 modified vesicles seems to interact more strongly with the surface if the analyte is present.
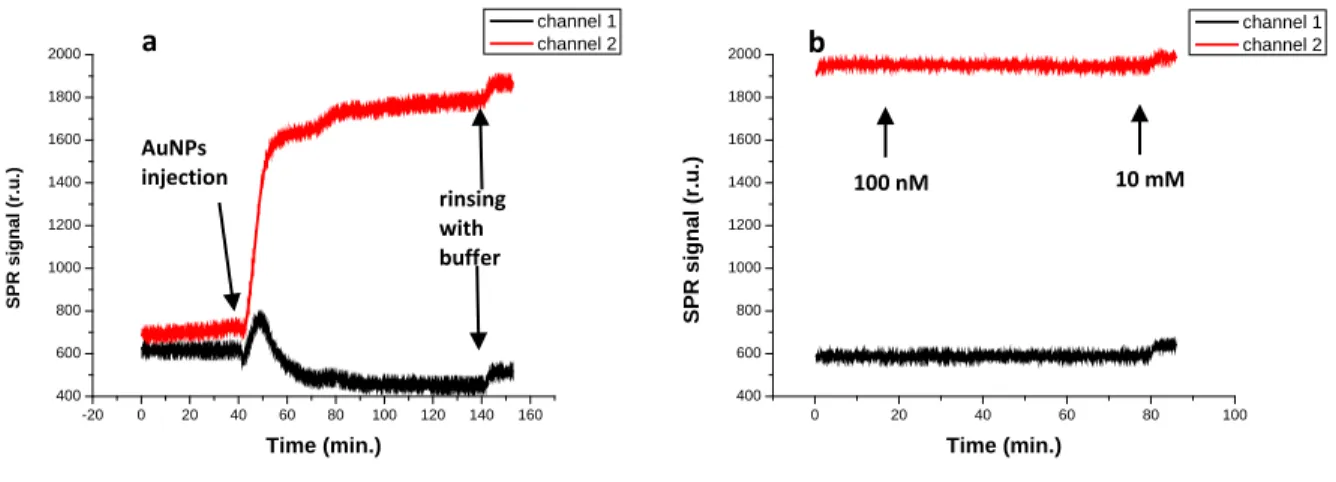
In order to demonstrate that the observed interaction depends on the presence of the receptor in the liposome composition, we studied the binding of Zn2 doped and non-doped DOPC vesicles to ATP- modified gold surfaces (Figure 3.12).
Figure 3.12: SPR sensorgrams obtained for the functionalization of the gold chip (SAM of 1-heptanethiol and 11- mercaptoundecanoic acid, 10:1) with ATP (from 0 to 300 minutes) and after injection of Zn2 doped DOPC vesicles (channel 2) and non-doped DOPC vesicles (channel 1) (from 300 to 400 minutes) (a). Zoom of the last part of the same sensorgram (b).
The curve for channel 2 is vertically shifted for better comparison.
The sensorgrams in Figure 3.12b clearly show that the affinity of the liposomes to the ATP labeled surface depends on whether or not Zn2 is included in the composition.
As the sensorgrams in Figure 3.11 show that the Zn2 doped liposomes interact also with the non ATP modified surface, we decided to further investigate this aspect.
The experiment shown in Figure 3.13 repeats the measures reported in Figures 3.11 and 3.12 and combines them in a single analysis.
0 100 200 300 400 500
0,002 0,004 0,006 0,008 0,010 0,012 0,014 0,016 0,018
SPR signal (RIU)
Time (min.)
channel1 (RIU) channel2 (RIU)
300 350 400 450 500
0,005 0,006 0,007 0,008 0,009 0,010 0,011
SPR signal (RIU)
Time (min.)
channel1 (RIU) channel2 (RIU) shifted
100 μM
a b
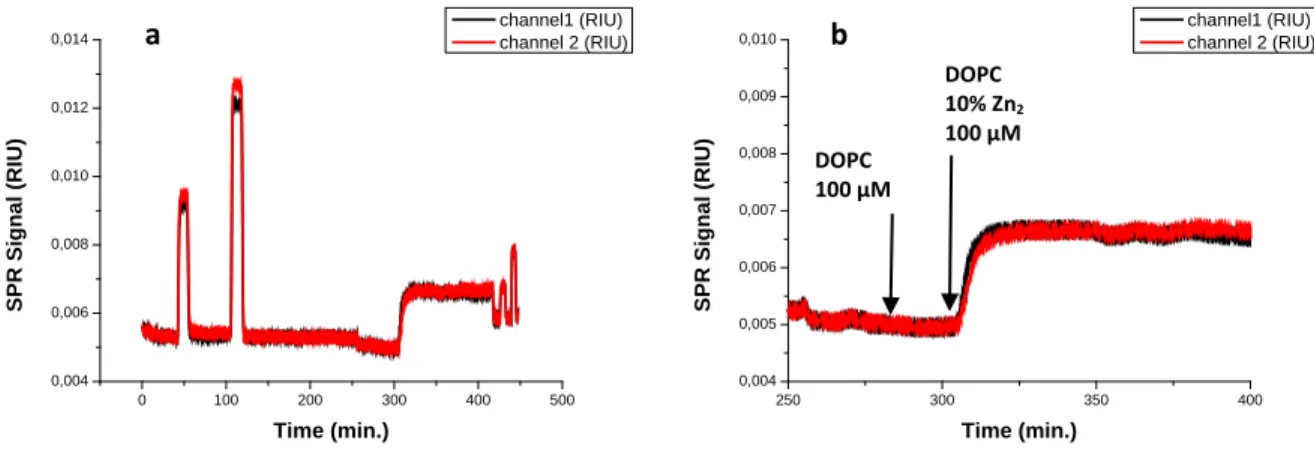
Figure 3.13: SPR sensorgrams obtained after injection of DOPC vesicles (280 minutes) and Zn2 doped DOPC vesicles (300 minutes) of a total amphiphile concentration of 100 μM on functionalized surfaces. The surface were first modified with a SAM of 1-heptanethiol and 11-mercaptoundecanoic acid (10:1); subsequently, channel 2 was treated with the procedure for ATP functionalization and channel 1 with the same procedure as channel 2 but leaving out ATP (from 0 to 250 minutes) (a).
Zoom of the last part of the same sensorgrams (b).
No signal change is observed when non doped DOPC liposomes reach the surfaces, while a clear increase is detected when the doped ones come in contact with the chip. In contrast to what previously observed (Figure 3.11), the presence of ATP on the surface does not mark a difference in the SPR response.
We further investigated the interaction of the same vesicular systems with gold surfaces functionalized with 1-heptanethiol (Figure 3.14) and with a mixture of 1-heptanethiol and 11- mercaptoundecanoic acid (10:1) (Figure 3.15) in order to examine the contribution of the different components of the SAM to the nonspecific binding observed in the previous experiments, independently from the ATP functionalization.
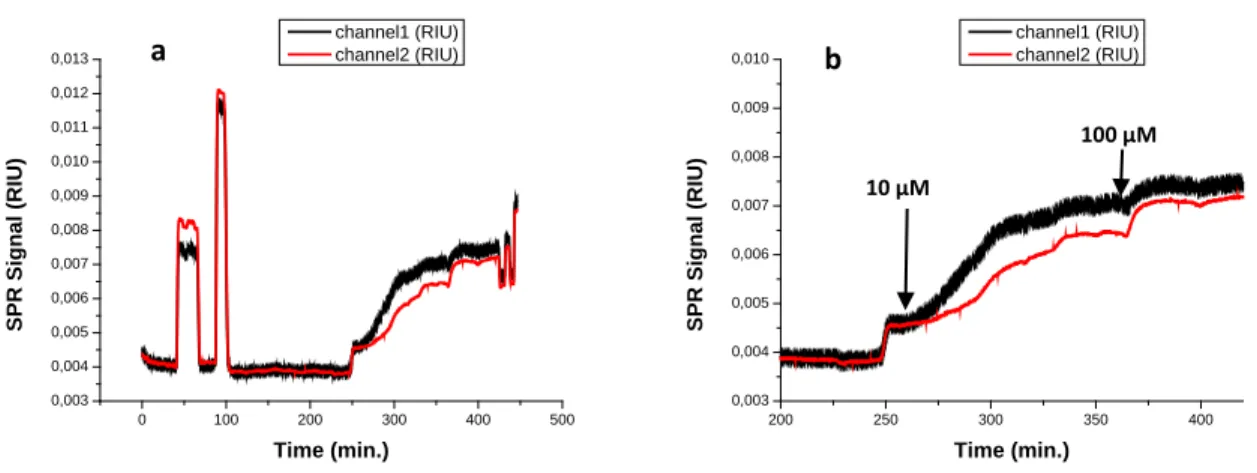
Figure 3.14: SPR sensorgrams obtained after injection of DOPC vesicles (channel 1) and Zn2 doped DOPC vesicles (channel 2)
0 100 200 300 400 500
0,004 0,006 0,008 0,010 0,012 0,014
SPR Signal (RIU)
Time (min.)
channel1 (RIU) channel 2 (RIU)
250 300 350 400
0,004 0,005 0,006 0,007 0,008 0,009 0,010
SPR Signal (RIU)
Time (min.)
channel1 (RIU) channel 2 (RIU)
-50 0 50 100 150 200 250 300 350
0,004 0,005 0,006 0,007 0,008 0,009 0,010
SPR signal (RIU)
Time (min.)
channel1 (RIU) channel2 (RIU)
DOPC 10% Zn2
100 μM
10 μM
b a
DOPC 100 μM
100 μM
SPR and QCM-D investigations of functionalized supported membranes
Figure 3.15: SPR sensorgrams obtained after injection of DOPC vesicles (channel 1) and Zn2 doped DOPC vesicles (channel 2) on a 1-heptanethiol and 11-mercaptoundecanoic acid (10:1) functionalized gold surface.
The DOPC vesicles interact with the surface in both cases (Figure 3.14 and 3.15) when the total amphiphile concentration of the injected sample is 100 µM. The Zn2 doped DOPC vesicles interact faster and at lower total amphiphile concentrations than the non-doped ones. The experiments presented in Figures 3.13, 3.14 and 3.15 tell us that the receptor decorated vesicles have stronger affinity compared to the non-decorated ones, towards all the explored surfaces. In particular the interaction doesn’t seem to depend on the presence of ATP on the surface (Figure 3.13).
An analogous series of experiments was made with DSPC vesicles in order to investigate the effect of the membrane phase (gel instead of liquid crystalline phase) on the interaction of the vesicles with the different surfaces. We first explored the SPR signal response of Zn2 decorated DSPC vesicular systems when they are injected on a ATP modified surface (Figure 3.16).
-50 0 50 100 150 200 250 300 350
0,005 0,006 0,007 0,008 0,009 0,010
SPR signal (RIU)
Time (min.)
channel1 (RIU) channel 2 (RIU) shifted
10 μM
100 μM