• Keine Ergebnisse gefunden

Interference of transcription on H-NS mediated repression in Escherichia coli

N/A
N/A
Protected

Academic year: 2021

Aktie "Interference of transcription on H-NS mediated repression in Escherichia coli"

Copied!
87
0
0

Wird geladen.... (Jetzt Volltext ansehen)

Volltext

(1)

Interference of transcription on H-NS mediated repression in Escherichia coli

I n a u g u r a l - D i s s e r t a t i o n zur

Erlangung des Doktorgrades

der Mathematisch-Naturwissenschaftlichen Fakultät der Universität zu Köln

vorgelegt von

Aathmaja Anandhi Rangarajan

aus Arakkonam, Indien

(2)

ii

Berichterstatter: Prof. Dr. Karin Schnetz

(Gutachter) Prof. Dr. Jürgen Dohmen

Tag der mündlichen Prüfung: 08.01.2018

(3)

iii

“I am among those who think that science has great beauty. A scientist in his laboratory is not only a technician: he is also a child placed before natural phenomena which impress him like a fairy tale’’

Marie Curie

(4)

iv

Contents

Zusammenfassung ... 1

Summary ... 3

1. Introduction ... 4

1.1 H-NS, global repressor in E. coli ... 4

1.2 Regulation of the hns gene ... 5

1.3 Structure and binding modes of H-NS ... 5

1.4 Mechanisms of repression and de-repression of H-NS at the level of transcription initiation ... 6

1.5 H-NS modulating transcription elongation and vice-versa ... 8

1.6 Association of H-NS with other proteins ... 10

1.7 Role of H-NS in genome organization ... 11

1.8 H-NS repression of proU and bgl operons ... 11

1.9 Objectives of the thesis ... 13

2. Results ... 15

2.1 Experimental system for modulating transcription elongation ... 15

2.2 Transcription into H-NS repressed proU abrogates repression ... 18

2.3 De-repression of proU is directly proportional to the transcription rate ... 21

2.4 Transcription into H-NS and H-NS/StpA repressed pdeL and appY abrogates repression ... 23

2.5 Transcription into bgl

DRE

relieves H-NS repression and activates transcription from H-NS repressed promoter P3

bgl

within bgl

DRE

... 27

2.6 Induction of pst-phoU operon located upstream of bgl decreases H-NS repression of bgl... 37

2.7 Slow and fast moving RNA polymerase mutants did not affect the H-NS repression in bgl

DRE

and proU ... 40

2.8 Hha plays a minor role in repression of yciF, ycdT and appY genes ... 41

3. Discussion ... 44

3.1 How do transcription elongation and H-NS repression modulate each other? ... 44

3.2 What is the role of StpA and Hha proteins interacting with H-NS? ... 46

3.3 What are the consequences of interplay between transcription and H-NS repression on genome organization? ... 48

4. Materials and Methods ... 50

4.1 Bacterial strains, plasmids and oligonucleotides ... 50

4.2 Media and antibiotics ... 59

4.3 Standard molecular techniques ... 59

4.4 CaCl

2

competent cells and transformation ... 61

4.5 Electrocompetent cells and electroporation ... 61

4.6 Chromosomal integration into attB sites ... 62

4.7 Gene deletion and insertion using λ-Red mediated recombination ... 63

4.8 β‐galactosidase assay ... 63

4.9 Transduction using T4GT7 phage ... 64

4.10 Transduction using P1vir phage ... 64

4.11 RNA extraction... 65

(5)

v

4.12 Urea PAGE ... 65

4.13 cDNA synthesis ... 65

4.14 qRT-PCR ... 66

4.15 5ˈRACE ... 66

5. References ... 68

Abbreviations ... 78

Acknowledgement ... 79

Lebenslauf ... 81

Erklärung ... 82

(6)

1

Zusammenfassung

Das hitzestabile Nukleoid-assoziierte Protein H-NS ist ein globaler Transkriptionsrepressor in Escherichia coli und anderen enterobakteriellen Spezies. H-NS bindet an AT-reiche DNA- Regionen und reprimiert Gene welche für verschiedene Stressantworten und Pathogenitätsdeterminanten kodieren und durch horizontalen Gentransfer erworben wurden.

Die Repression der Transkription durch H-NS erfolgt durch die Bildung eines repressiven Nukleoproteinkomplexes durch DNA-Versteifen (stiffening) oder DNA-Brückenbildung (bridging). H-NS blockiert die Bindung der RNA-Polymerase an den Promotor oder setzt sie am Promotor fest. StpA, ist ein Paralog von H-NS, welches ähnlich wie H-NS wirkt und einen heteromeren Komplex mit H-NS bildet. Einige Gene werden durch H-NS und StpA reprimiert. Die Repression der Transkription durch H-NS kann durch die Bindung spezifischer Transkriptionsregulatoren oder durch Änderung der DNA-Struktur aufgehoben werden.

Die Transkriptionselongation und die Repression durch H-NS können möglicherweise interferieren. In vitro kann H-NS das Pausieren der RNA-Polymerase verstärken und die Rho- abhängige Termination fördern. In vivo ist die H-NS-DNA Bindung reduziert, wenn die Transkription durch Hemmung Rho-vermittelter Termination gesteigert wird.

In dieser Arbeit wurde die Wirkung der Transkriptionselongation auf H-NS- und H-NS/StpA- reprimierte Promotoren analysiert. Die Ergebnisse zeigen, dass die Elongation der Transkription über eine von H-NS- und H-NS/StpA-gebundene Promotor-DNA-Region (bgl, proU, pdeL und appY) hinweg die Repression der Promotoren vermindert. Zum Beispiel bewirkt eine in das bgl

DRE

(bgl downstream regulatory element) hinein gerichtete Transkription die Derepression eines H-NS reprimierten Promoters P3

bgl

innerhalb des bgl

DRE.

Darüber hinaus verringert die Induktion eines stromaufwärts von bgl liegenden Operons (pst-

phoU) die Repression der bgl-Promotoren durch H-NS/StpA. Zusätzlich wurde eine inverse

Korrelation zwischen der Transkriptionsrate und H-NS-Repression beobachtet. Die Daten

legen nahe, dass die transkribierende RNA-Polymerase in der Lage ist, den H-NS (und StpA)

Komplex umzustrukturieren. Durch diese Umstrukturierung während der Transkription

kommt es vermutlich zur Dislokation von H-NS (und StpA) von der DNA und damit zur

verminderten Repression, während bei niedrigen Transkriptionsraten der H-NS-

Repressionskomplex stabil ist. Dies impliziert die wechselseitige Interferenz zwischen

Transkription und H-NS-Repression. Daher werden gering transkribierte AT-reiche Regionen

(7)

2

eher durch H-NS reprimiert werden, wohingegen eine effizient transkribierte Region die

Bildung eines Repressionskomplexes nicht erlauben sollte. Im Kontext des Genoms kann das

Durchlesen der Transkription von einem stromaufwärts gelegenen Locus, den H-NS-Komplex

von stromabwärts gelegenen Genen verdrängen, und die Expression dieser Gene

modifizieren.

(8)

3

Summary

The heat-stable nucleoid-associated protein H-NS is a global transcriptional repressor in Escherichia coli and other Enterobacterial species. H-NS binds to AT-rich DNA regions repressing several stress response genes, pathogenic genes, horizontally acquired DNA and is also indicated to play a role in genome organization. Transcriptional repression by H-NS is mediated by the formation of nucleoprotein complex that stiffens or bridges DNA. H-NS represses transcription at the level of initiation by excluding or trapping the RNA polymerase at promoters. StpA is a H-NS paralogue that presumably acts similarly as H-NS and forms heteromeric complex with H-NS and some genes are repressed by H-NS and StpA. H-NS mediated repression can be relieved by binding of gene specific transcription factors or by perturbations of DNA structure.

H-NS repression and transcription elongation may also interfere with each other. In vitro, H- NS enhances RNA polymerase pausing and promotes Rho-dependent termination.

Complementarily, inhibition of Rho-mediated termination resulting in increased transcription reduced H-NS binding.

In this work, the effect of transcription elongation into H-NS and H-NS/StpA repressed promoters were analyzed. The results show that transcription elongation across the H-NS and H-NS/StpA bound DNA region of bgl, proU, pdeL and appY relieves the repression of promoter by H-NS and H-NS/StpA. For example, analysis of transcripts from bgl

DRE

(bgl downstream regulatory element) revealed the presence of additional H-NS repressed promoter P3

bgl

which was de-repressed upon increase in transcription. Moreover, in the native context, transcription from upstream pst-phoU operon decreases H-NS/StpA repression of bgl promoters. Additionally, an inverse correlation between the transcription rate and H-NS repression was observed. The data suggest that the transcribing RNA polymerase is able to remodel the H-NS (and StpA) complex and/or dislodge H-NS (and StpA) from the DNA and thus relieve repression, while at low transcription rates the H-NS repression complex is stable.

This implies mutual interference between transcription and H-NS repression. Poorly

transcribed AT-rich regions are prone to be repressed by H-NS, whereas efficiently

transcribed region do not allow the formation of repression complex. Furthermore, the

transcriptional read-through from an upstream locus can concurrently dislodge the H-NS

complex of downstream genes and modify their expression.

(9)

4

1. Introduction

Escherichia coli possess an approximately 5 Mb circular genome which has to be compacted several thousand folds to be accommodated within the dimensions of the cells. Concurrently, the genome must be available for processes including but not limited to replication, segregation and gene regulation. Nucleoid compaction in E. coli is aided by several nucleoid- associated proteins such as H-NS, HU, StpA and Fis. These proteins bind non-specifically across the genome, enabling wrapping, bending and bridging the DNA and many of them also acts as gene-regulators (Dillon & Dorman, 2010, Badrinarayanan et al., 2015). H-NS (Heat- stable Nucleoid Structuring protein) is an abundant nucleoid-associated protein in E. coli and other Enterobacteriaceae which performs dual role in genome organization and transcriptional repression (Dorman, 2014a). Transcriptional repression by H-NS is enabled by the formation of nucleoprotein complex by bridging or stiffening DNA (Maurer et al., 2009).

H-NS represses transcription at the level of initiation by excluding the RNA polymerase or by trapping the RNA polymerase at the promoter (Grainger, 2016). H-NS repression at the level of transcription initiation can be relieved by specific transcription regulators (Stoebel et al., 2008, Will et al., 2015). However, whether H-NS also modulates later stages of transcription such as transcription elongation and termination has not been studied in detail. Conversely, the influence of transcription on H-NS repression has not been addressed yet. In this work, the interference of transcriptional elongation by RNA polymerase on H-NS repression was analyzed.

1.1 H-NS, global repressor in E. coli

H-NS is a pleiotropic regulator, which is highly conserved in Gammaproteobacteria (Tendeng

& Bertin, 2003). H-NS plays a dual role in global transcriptional repression and genome organization (Dorman, 2004, Luijsterburg et al., 2006, Dorman, 2014a). H-NS protein is highly abundant, present at around 20,000 molecules per genome equivalent and controls the expression of 5% of the genes in E. coli (Ali Azam et al., 1999, Hommais et al., 2001). H-NS binds non-specifically to any DNA sequence with higher AT-content (Navarre et al., 2007).

The T-A base step which forms the minor groove of the DNA is critical for H-NS binding

(Gordon et al., 2011). A poor consensus motif has been defined for high affinity H-NS

binding (Lang et al., 2007) (Figure 1C). H-NS first nucleates in AT-rich high affinity sites

dispersed across the genome and subsequently polymerizes into the low affinity sites forming

repressive nucleoprotein complex (Rimsky et al., 2001, Kahramanoglou et al., 2011,

Bouffartigues et al., 2007). Genome wide H-NS binding determined using Chromatin

(10)

5 Immunoprecipitation-on-chip (ChIP-on-chip) studies have revealed H-NS binding to ~ 350 loci spread across the E. coli genome (Lucchini et al., 2006, Grainger et al., 2006, Kahramanoglou et al., 2011). H-NS binds AT-rich DNA, a characteristic of xenogeneic DNA hence, H-NS plays a significant role in silencing horizontally acquired DNA including several virulence factors and pathogenicity islands (Navarre et al., 2007, Lucchini et al., 2006, Dorman, 2014b). H-NS also affects major DNA transactions such as conjugation, replication, transposition and recombination (Dorman, 2004, Dorman, 2014b, Helgesen et al., 2016).

1.2 Regulation of the hns gene

Ths hns gene is regulated at the level of transcription and post-transcription. The hns gene is negatively autoregulated, with Fis antagonizing H-NS mediated repression (Falconi et al., 1993, Falconi et al., 1996). Iron regulator Fur and cold shock protein CspA also influences hns transcription (Brandi et al., 1994, Troxell et al., 2011). Moreover, auto repression of hns is exerted tightly when the replication fork is arrested, suggesting hns transcription is sensitive to the progression of cell cycle (Free & Dorman, 1995). Additionally H-NS expression is negatively at the post transcriptional level by DsrA (sRNA), which is induced upon stress (Brescia et al., 2004).

1.3 Structure and binding modes of H-NS

H-NS is a 15 kDa protein consisting of 137 amino acids (Falconi et al., 1988). It possess a N-

terminal oligomerization domain with two dimerization interfaces, followed by a short linker

domain and C-terminal DNA- binding domain (Esposito et al., 2002, Grainger, 2016) (Figure

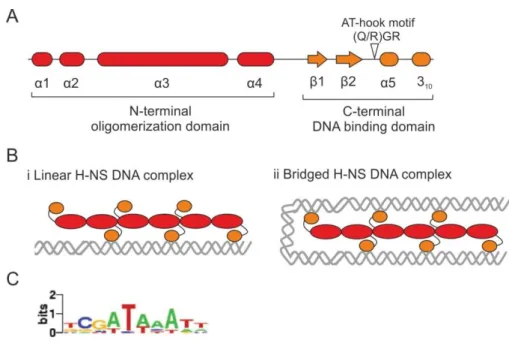
1A). The N-terminal domain (1-83 residues) consists of four α-helices (α1-α4) which permits

self-association by ‘head-to-head’ and ‘tail-to-tail’ contacts, thus enabling the formation of

higher order H-NS oligomers (Esposito et al., 2002, Arold et al., 2010). The C-terminal

domain (91-137 residues) consists of two β-sheets (β1 and β2), an α-helix (α5) and a 3

10

helix

which forms a hydrophobic core stabilizing the C-terminal domain (Gordon et al., 2011)

(Figure 1A). Conserved residues ‘(Q/R)GR’ in the C-terminal domain forms AT-hook motif

in which the first (Q/R) and the last (R) side chain extend in opposite direction and docks into

the AT-rich DNA minor groove (Gordon et al., 2011). H-NS thus binds to AT-rich DNA

sequences forming repressive nucleoprotein complex. This nucleoprotein complex can bind to

DNA in two modes, it can form linear complex by stiffening the DNA or form bridged

complex by binding to two strands of DNA (Figure 1B) (Dame et al., 2005, Maurer et al.,

2009). However, the formation of stiffening or bridged complexes depends on the Mg

2+

(11)

6 concentration in vitro, with higher Mg

2+

concentration favoring the bridged H-NS DNA complex (Liu et al., 2010).

Figure 1: Domain organization and binding modes of H-NS. (A) Schematic illustration of structural components and domain organization of H-NS protein. The N-terminal oligomerization domain (red) consists of four α-helices (α1-α4) and the C-terminal DNA-binding domain (orange) which comprises of two β-sheets (β1 and β2), an α-helix (α5) and 3

10

helix. The AT-hook motif consisting of residues (Q/R)GR is indicated (Arold et al., 2010, Gordon et al., 2011). (B) Schematic representation of binding modes of H-NS DNA complex. (i) In a linear H-NS DNA complex, H-NS binds to the adjacent DNA sites in linear arrangement and stiffens the DNA. (ii) In a bridged H-NS DNA complex, H-NS binds and bridges two strands of DNA. (C) Logo representation of experimentally determined H-NS binding motif taken from Lang et al., 2007.

1.4 Mechanisms of repression and de-repression of H-NS at the level of transcription initiation

H-NS repression predominantly occurs by counteraction of transcription at the level of

initiation. Several mechanisms have been described for H-NS repressing transcription

initiation. H-NS occludes the RNA polymerase from binding, traps the RNA polymerase or

directly interacts with RNA polymerase to modulate its activity at the promoter regions

(Grainger, 2016). Occlusion of RNA polymerase is the most common mechanism by which

H-NS represses transcription initiation (Figure 2A). As stated earlier, H-NS preferentially

binds to AT-rich DNA binding regions which is also characteristic of promoter region, hence

H-NS binding coincides with the binding of RNA polymerase (Grainger et al., 2006,

Panyukov & Ozoline, 2013, Singh et al., 2014). Thus, binding of H-NS in the promoter

regions occludes the RNA polymerase binding (Yoshida et al., 1993). In some cases H-NS

(12)

7 forms a repressive loop by bridging distal H-NS binding sites in which RNA polymerase is trapped (Figure 2B). Trapping of RNA polymerase in such repressive loop has been shown for rrnB and hdeAB promoters (Dame et al., 2002, Shin et al., 2005). Further, H-NS can also directly interact with RNA polymerase and inhibit promoter escape by RNA polymerase activity (Figure 2C). In the Enteropathogenic E. coli LEE5 promoter region, H-NS was shown to directly interact with the alpha-subunit of RNA polymerase and prevent RNA polymerase isomerization to form an open promoter complex (Shin et al., 2012).

Figure 2: Mechanisms of H-NS repression at the level of transcription initiation. (A) RNA polymerase occlusion. H-NS complex can occlude binding of RNA polymerase to the promoter (arrow) in linear or bridged conformation to repress transcription (Yoshida et al., 1993). (B) Trapping of RNA polymerase. H-NS can allow the formation of repression loops by bridging which may entrap the bound RNA polymerase and prevents translocation of RNA polymerase (Dame et al., 2002, Shin et al., 2005). (C) Repression by direct RNA polymerase interaction. H-NS can directly interact with alpha C-terminal domain of RNA polymerase and prevents isomerization of RNA polymerase at the promoter (Shin et al., 2012).

In most of the cases studied, de-repression by H-NS at the level of transcription initiation is

facilitated by trans-acting factors. These trans-acting factors can be canonical transcription

factors which acts gene specifically or H-NS like proteins which disrupts the oligomerization

state of H-NS and causes de-repression non-specifically. Gene-specific transcription factors

competes with H-NS for binding sites and displaces H-NS or changes DNA topology to drive-

(13)

8 off H-NS binding (Navarre et al., 2007, Stoebel et al., 2008, Will et al., 2015, Winardhi et al., 2015). Ler and SsrB were shown to displace H-NS from promoter region (Desai et al., 2016, Winardhi et al., 2014, Walthers et al., 2011). Binding of VirB induces a conformational change which bends and remodels the DNA disrupting the H-NS DNA complex (Gao et al., 2013). SlyA inhibits H-NS binding and alters the confirmation of DNA to enable initiation of transcription (Lithgow et al., 2007). In hdeAB and dps promoter, DNA bending by σ

70

associated RNA polymerase allows the formation of repression loop by H-NS, which is circumvented when σ

38

associated RNA polymerase is bound (Shin et al., 2005, Grainger et al., 2008). Truncated protein orthologs of H-NS interact with H-NS and alter the oligomerization of H-NS preventing the formation of a repressive complex. Proteins such as gp 5.5 from bacteriophage T7 and H-NST from Enteropathogenic E. coli, bind to the N- terminal region of H-NS thereby disrupting oligomerization by H-NS which is critical for silencing activity (Liu & Richardson, 1993, Williamson & Free, 2005, Levine et al., 2014).

Apart from trans-acting factors environmental factors such as temperature and osmolarity can affect degree of curvature by increasing or decreasing bend angles in DNA, which eventually cause H-NS de-repression (Sinden et al., 1998, Amit et al., 2003, Prosseda et al., 2004). In virF promoter, H-NS repression is favored at lower temperature whereas at higher temperature DNA bending is reduced which displaces H-NS (Di Martino et al., 2016).

Further, several pathogenic genes have been reported to be repressed by H-NS at lower temperature (25°C) which is alleviated at a higher temperature (37°C) (Trachman & Yasmin, 2004, Yang et al., 2005, Ono et al., 2005). Moreover, in vitro analysis has shown that DNA bridging complex formation is inhibited at 37°C (Kotlajich et al., 2015). However, the mechanism by which these environmental factors influence H-NS activity and the DNA structure remains elusive.

1.5 H-NS modulating transcription elongation and vice-versa

In many gene loci H-NS binding extends several hundred base pairs into the coding region

downstream of the promoter (Singh et al., 2014). H-NS complex bound in the coding region

could encounter active elongation complex and can act as a road block for the transcribing

RNA polymerase. H-NS road block can facilitate RNA polymerase pausing and termination

of the elongation complex. On the other hand, transcribing RNA polymerase can also disrupt

the bound H-NS complex. Thus, H-NS repression complex and the transcribing RNA

polymerase could counteract each other (Landick et al., 2015). Recent evidences suggest both

the phenomena may occur.

(14)

9 H-NS could interfere with transcription elongation and enable Rho dependent transcription termination. The bgl downstream regulatory element (DRE) which extends up to 700 bp downstream of the bgl promoter is repressed by H-NS (Nagarajavel et al., 2007). Efficient H- NS repression by bgl

DRE

requires the Rho terminator protein (Dole et al., 2004a).

Furthermore, an in vitro transcription experiment with inverse bgl

DRE

as template showed that bridged H-NS complex enhances RNA polymerase pausing thereby facilitating Rho dependent termination (Kotlajich et al., 2015). These results posit a model in which, H-NS complex increases the dwelling time of RNA polymerase at pause sites, enabling Rho to catch up with RNA polymerase to cause termination (Figure 3A). Moreover, genome wide ChIP analysis has also shown that H-NS binding sites coincide with Rho termination sites (Peters et al., 2012). Thus, this phenomenon of H-NS enabled pausing and termination by Rho might be true for many genes that are bound by H-NS.

Figure 3: H-NS modulating transcription elongation and vice-versa (A) H-NS interfers with transcription elongation. Bridged H-NS complex causes pausing of RNA polymerase enabling Rho mediated termination (Kotlajich et al., 2015). (B) Transcription elongation decreases H-NS binding.

Increased read-through of the RNA polymerase by inhibition of Rho or by other factors decreases H- NS binding. H-NS, RNA polymerase and Rho are depicted in red, green and blue circles respectively (Chandraprakash & Seshasayee, 2014).

While the H-NS complex could interfere with transcription, the converse phenomena of

transcription elongation interferring with H-NS could also occur. Transcription elongation

interfering with H-NS is supported by a genome wide ChIP experiment, showing decreased

H-NS binding in several loci upon inhibition of transcription termination factor Rho. This

decreased H-NS binding is probably due to increased read through of RNA polymerase into

the H-NS bound region (Chandraprakash & Seshasayee, 2014) (Figure 3B). Moreover, single

(15)

10 molecule studies with optical tweezers have shown that a force of 7 pN is sufficient to dislodge DNA binding by a H-NS dimer, while the elongating RNA polymerase exerts a force of about 25 pN (Wang et al., 1998, Dame et al., 2006). These suggest that transcription elongation complex could dislodge H-NS complex, although experimental evidence for this is still lacking.

1.6 Association of H-NS with other proteins

H-NS does not act independently in all cases, but is often associated with other modulator proteins such as StpA and Hha. StpA is a paralogue of H-NS, which shares 59% sequence identity on amino acid level with H-NS (Zhang & Belfort, 1992). StpA also shares functional properties of H-NS by binding to AT-rich DNA sequences, forming bridged and linear filaments and silences gene expression (Sonnenfield et al., 2001, Lim et al., 2012, Muller et al., 2006). In hns mutants StpA binds to high affinity H-NS binding sites and silences the expression of horizontally acquired genes that are otherwise bound by H-NS (Srinivasan et al., 2013). Biochemical and genetic analysis have shown that StpA forms heteromeric complex with H-NS (Williams et al., 1996, Johansson et al., 2001). StpA levels are low in the exponential growth phase because stpA gene is repressed by H-NS at the transcriptional level and StpA is degraded post-translationally by Lon protease when it is not associated with H- NS (Zhang et al., 1996, Johansson et al., 2001). A subset of genes in E. coli is bound and regulated by H-NS and StpA (Uyar et al., 2009, Srinivasan et al., 2013). In E. coli, bgl and leuO promoters are regulated by both H-NS and StpA (Wolf et al., 2006, Stratmann et al., 2012). It is still an open question how StpA modulates the H-NS complex.

Hha is a small basic protein that interacts with the N-terminal domain of H-NS providing an

additional DNA-binding surface as it is positively charged (Ali et al., 2013, Wang et al.,

2014). The additional positive charge provided by Hha presumably stabilizes the H-NS-Hha

DNA bridging complex (Ali et al., 2013, van der Valk et al., 2017) (Figure 4). Thus, H-

NS/Hha complex presumably enhances H-NS repression by forming a stable bridged

repressive complex at a subset of H-NS regulated genes. In E. coli, Hha binds to a subset of

genes that is bound by H-NS in the coding part of the genome (Ueda et al., 2013). In

Salmonella, H-NS/Hha complex specifically affect horizontally acquired genes and does not

affect housekeeping genes that are repressed by H-NS (Vivero et al., 2008, Banos et al.,

2009). Very few genes have been reported in E. coli and Salmonella which are regulated by

Hha/H-NS complex. The H-NS/Hha complex represses haemolysin (hlyCABD) operon, htrA

gene and esc operon of E. coli O157:H7 (Nieto et al., 2000, Forns et al., 2005, Sharma &

(16)

11 Zuerner, 2004). In Salmonella H-NS/Hha complex negatively regulates Salmonella pathogenicity island SPI-2 (Coombes et al., 2005, Silphaduang et al., 2007).

Figure 4: Binding of Hha protein in H-NS complex. Hha (yellow) binds to the N-terminal domain of H-NS (red) providing an additional contact surface with a positive charge for DNA binding. Figure adapted and modified from Ali et al., 2013.

1.7 Role of H-NS in genome organization

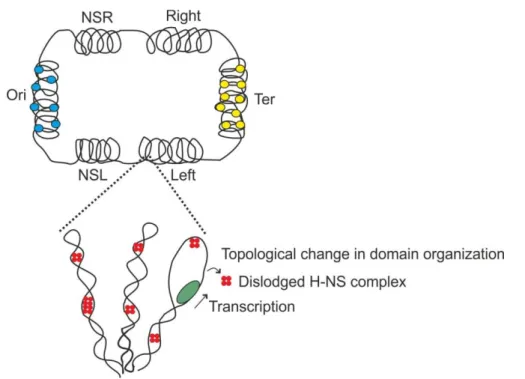
H-NS is indicated to be involved in nucleoid organization because of its bridging property which could bridge distance DNA fragments enabling DNA compaction (Luijsterburg et al., 2006, Dorman, 2014a). On a broad scale, E. coli genome is divided into four major macrodomains; Ori, Ter, Right, Left and two non-structured domains (Valens et al., 2004).

Superimposed on the macrodomain structure is the chromosome organization as looped microdomains which are highly dynamic. E. coli chromosome possess approximately 400 looped microdomains with 10-12 kb in length (Postow et al., 2004, Deng et al., 2005). The distribution of H-NS binding sites in the genome is consistent with the likely locations of the domain loop boundaries, and the bridging property of H-NS indicates the role of H-NS in stabilizing the microdomain loops (Noom et al., 2007, Dillon & Dorman, 2010). Additionally, insights from atomic force microscopy and single molecule experiments revealed condensation of large domains by H-NS suggesting a role for DNA condensation by H-NS (Dame et al., 2000, Ohniwa et al., 2013, Thacker et al., 2014). Moreover, H-NS, when overproduced lead to a highly condensed nucleoid which is lethal (Spurio et al., 1992, McGovern et al., 1994). The precise role of H-NS in the genome organization is yet to be determined.

1.8 H-NS repression of proU and bgl operons

The bgl and proU operon are classical genetic loci for studying H-NS repression. The hns

gene was first discovered as a part of bgl and proU operon and was named as osmZ and bglY,

whose mutation lead to high expression levels of bgl and proU operon, respectively. Further

(17)

12 studies on proU and bgl operon enabled to elucidate the mechanism of repression and de- repression of H-NS complex.

The proU operon encodes ABC transporter for the transport of compatible solutes such as proline and glycine betaine (Lucht & Bremer, 1994, Gowrishankar & Manna, 1996). The proU operon consists of genes proV, proW and proX (Figure 5A). The proU operon is osmoregulated, at low osmolarity conditions it is repressed by H-NS and at high osmolarity concentrations the expression is high (Gowrishankar, 1985, Ueguchi & Mizuno, 1993, Lucht et al., 1994). The binding of H-NS complex to regulatory elements upstream and downstream of the promoter (URE and DRE) which is critical for nucleoprotein complex formation by H- NS was first elucidated in proU operon (Overdier & Csonka, 1992). Later, this binding of H- NS in upstream and downstream regulatory elements was discovered in other H-NS repressed genes such as bgl and hilA (Schnetz, 1995, Olekhnovich & Kadner, 2006). In proU, the nucleoprotein complex spreads from -230 nt upstream to +270 nt downstream of the promoter (Lucht et al., 1994, Badaut et al., 2002). H-NS binds to the 10 bp high affinity H-NS binding sites at +25 and +130 relative to the transcription start site and laterally oligomerizes along the DNA to the low affinity sites forming a repressive nucleoprotein complex (Bouffartigues et al., 2007). Although, the H-NS repression is well studied in proU, the mechanism by which the H-NS repression is relieved at high osmolarity remains a puzzle.

Figure 5: E. coli proU and bgl operons. (A) Schematic representation of proU operon consisting of

P

proU

promoter and proV, proW, proX genes. H-NS was shown to bind between -230 bp upstream to

+270 bp downstream relative to the transcription start site from P

proU

(Lucht et al., 1994, Badaut et al.,

2002). (B) Schematic representation of bgl operon consisting of P

proU

and structural genes bglG, bglF,

bglB. Two rho independent terminators t1 and t2 are present flanking bglG gene. CRP binding site is

shown in grey. H-NS was shown to bind bgl atleast between -160 bp upstream to +700 bp downstream

of the transcription start site (Schnetz, 1995, Dole et al., 2004b).

(18)

13 The bgl operon encodes for the proteins that enable uptake and utilization of aryl-β, D- glucosides. The bgl operon consists of bglGFB genes and two rho independent terminators flanking bglG gene (Mahadevan et al., 1987, Schnetz et al., 1987, Schnetz & Rak, 1988) (Figure 5B). H-NS binds to upstream and downstream regulatory region of bgl promoter causing 100-fold repression (Schnetz, 1995). It was first shown in bgl that any trans-acting factor binding to the upstream AT-rich regulatory region can relieve the H-NS repression.

Interestingly, binding of classical repressors such as λ repressor and LacI were shown to increase the transcription from bgl promoter by relieving repression by H-NS complex (Caramel & Schnetz, 1998). Repression by H-NS can also be overcome by spontaneous mutations, including the deletion of an AT-rich regulatory region upstream of the promoter, integration of insertion elements, and point mutations in the CRP-binding site (Schnetz &

Rak, 1992, Mukerji & Mahadevan, 1997). Additionally, repression of bgl can also be abrogated by transcriptional factors LeuO and BglJ-RcsB, both of which counteract H-NS repression of bgl upstream regulatory element (Madhusudan et al., 2005, Salscheider et al., 2014). Binding of H-NS at the bgl promoter with upstream and downstream elements, was shown to inhibit transcription initiation by targeting a step before open complex formation of RNA polymerase (Nagarajavel et al., 2007). Furthermore, repression by H-NS via bgl downstream regulatory element requires transcription termination factor Rho (Dole et al., 2004b). Recent in vitro evidences also show enhancement of Rho mediated termination in bgl downstream element under the conditions where H-NS forms bridged complex by enabling pausing of RNA polymerase (Kotlajich et al., 2015). These suggest that H-NS complex could also modulate transcription elongation and termination in bgl and other genes.

1.9 Objectives of the thesis

H-NS, as a global repressor controls the expression of several pathogenic, stress response and horizontally acquired genes and it also plays a role in genome organization. Most of the studies to unravel the mechanism of H-NS repression and de-repression have been focussed at the level of transcription initiation. In most of the genes, H-NS represses transcription initiation by binding to the promoter region which is relieved by gene specific trans-acting factors (Stoebel et al., 2008, Will et al., 2015). In many genes H-NS binds several hundred bases downstream of promoter into the coding region (Singh et al., 2014), suggesting a role of H-NS in affecting transcription elongation. Recent evidences also suggest that transcription elongation could interfere with H-NS repression and vice versa (Chandraprakash &

Seshasayee, 2014, Landick et al., 2015). In this thesis, I addressed the following objectives:

(19)

14 I studied whether transcription into H-NS and H-NS/StpA bound promoter regions relieves H- NS and H-NS/StpA mediated repression.

I addressed whether the change in processivity and speed of RNA polymerase modulates the H-NS repression complex.

I determined the role of Hha in H-NS/Hha complex and studied whether transcription into the H-NS/Hha complex modulates the repression.

I studied whether transcription into the H-NS repressed gene relieves its long range

chromosomal interaction with other H-NS repressed genes.

(20)

15

2. Results

Recent studies on H-NS repression indicate that transcription elongation and H-NS repression could counteract each other (Landick et al., 2015, Chandraprakash & Seshasayee, 2014).

However, the effect of transcription elongation on specific H-NS repressed genes has not been studied so far. In this work, I studied the effect of transcription elongation on selected H-NS repressed loci across the genome. Transcription directed towards the H-NS repressed gene was modulated by two inducible promoter modules. In one module, a constitutive P

UV5

promoter was combined with conditional terminator (P

UV5

tR1) and the second module is based on the arabinose inducible P

BAD

promoter. These experimental modules were inserted upstream of H-NS repressed gene to direct transcription into the specific H-NS repressed locus. The effect of transcription elongation was tested on classical H-NS repressed loci bgl

DRE

and proU and also other H-NS and H-NS/StpA loci such as pdeL and appY, respectively.

Additionally, I analyzed whether the speed of transcription is relevant for modulation of H- NS repression using slow moving and fast moving RNA polymerase mutants. Furthermore, the regulatory role of Hha protein, a modulator of the H-NS complex was analyzed at three loci (yciF, ycdT, appY) in order to determine whether transcription into H-NS/Hha repressed loci relieves their repression. Further, H-NS role has been implicated in nucleoid structuring and it was reported that H-NS repressed loci that are located at distant sites on the chromosome co-localize into foci (Wang et al., 2011). Therefore, I wanted to test whether transcription into H-NS repressed gene in such foci affects their cellular localization.

2.1 Experimental system for modulating transcription elongation

In this work, I determined whether transcription elongation interferes with H-NS repression of selected genes. To modulate the rate of transcription elongation and to direct transcription into specific H-NS repressed locus, two different experimental systems were designed. The first system consisted of a constitutive variant of the P

UV5

promoter and the conditional transcriptional terminator tR1. The second system consisted of an arabinose inducible P

BAD

promoter.

In the P

UV5

tR1 system, the constitutive promoter P

UV5

with terminator and anti-terminator complex (λtR1-N) from phage lambda is used to modulate transcription elongation. The λtR1 is a Rho-dependent transcriptional terminator. The λN protein binds to nutR RNA region upstream of λtR1, and then further interacts with RNA polymerase along with host factors.

Association of λN to the RNA polymerase increases the processivity and enables read-

(21)

16 through at transcriptional terminators (Nudler & Gottesman, 2002, Roberts et al., 2008). To test whether the P

UV5

tR1 is suitable for modulating transcription elongation, P

UV5

tR1 module was fused to lacZ reporter and the expression was determined by β-galactosidase assay. As a control, P

UV5

promoter is used without the tR1 (Figure 6A). These modules, P

UV5

tR1-lacZ (plasmid pKES269) and P

UV5

-lacZ (plasmid pKES268) were previously constructed in the laboratory (Brühl, 2011). I inserted these constructs, in the chromosome, which allows the expression analysis in single copy. λN was provided plasmidically with low-medium copy plasmid pKES219 that possess λN gene under the control of the IPTG inducible P

tac

promoter (Muhr, 2008). In strain carrying P

UV5

tR1-lacZ construct, the β-galactosidase activity increases 6-fold in the presence of λN protein both in wild-type (110 units to 640 units) and hns mutant (145 units to 941 units) (Figure 6A, left). This 6-fold increase in the presence of λN protein was also observed in an independent P

UV5

tR1-lacZ construct (plasmid pKEIB19) as determined previously in the laboratory (Bouchara, 2009). However, in the control P

UV5

-lacZ construct no increase in expression was observed in the presence and absence of λN protein both in wild-type and hns mutant (Figure 6A, right). This 6-fold increase in P

UV5

tR1-lacZ construct is in accordance with previously determined 80% termination at λtR1 (Rosenberg et al., 1978). Moreover, this 6-fold increase is observed both in wild-type and hns mutant, indicating H-NS has no effect on P

UV5

tR1 module. Thus, the P

UV5

tR1 module with λN protein can be used to modulate transcription to be further directed into H-NS repressed genes.

The advantage of using the λtR1-N system is that the rate of transcription is modulated by λN which is a RNA binding protein, which will not influence DNA binding activity of H-NS.

However, using this module the rate of transcription cannot be gradually increased. Moreover

λN, along with other host factors modulates RNA polymerase and increases its processivity

(Nudler & Gottesman, 2002, Roberts et al., 2008, Parks et al., 2014). In order to circumvent

these limitations, in the second system, the arabinose inducible P

BAD

promoter was used to

direct transcription into H-NS repressed regions. The P

BAD

promoter is known to possess

stochastic behavior in the presence of arabinose due to negative and positive feedback

regulation of genes involved in arabinose utilization. Negative feedback is caused by

fermentation of arabinose by intracellular enzymes encoded by araBAD (Siegele & Hu,

1997). Positive feedback is enabled by induction of transporters encoded by araFGH and

araE enabling high uptake of arabinose (Siegele & Hu, 1997, Megerle et al., 2008). In order

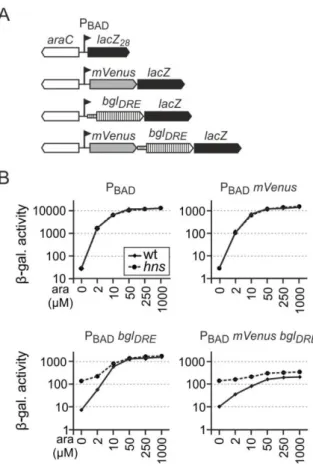
to avoid this feedback regulation and to allow the gradual induction by arabinose, the araC-

P

BAD

module was chromosomally inserted in strain U65 which carries deletions of araBAD

and araFGH and low affinity transporter araE under control of a constitutive promoter (P

cp8

)

(22)

17 (Kogenaru & Tans, 2014) (Breddermann & Schnetz, 2016). As the P

BAD

promoter is under catabolite regulation, cultures were grown in tryptone medium lacking glucose. Gradual induction of araC-P

BAD

construct with increasing concentration of arabinose was confirmed

using a lacZ reporter fusion (Figure 6B). As the concentration of arabinose increased, the level of β-galactosidase activity increased in both wild-type and in the hns mutant similarly (Figure 6B). This shows that H-NS has no effect on araC-P

BAD

module. Taken together, these Figure 6: Experimental systems for modulating transcription elongation. (A) Schematic representation of P

UV5

lacZ constructs with λ phage terminator tR1 and the control P

UV5

lacZ construct integrated chromosomally. Expression levels given as β-galactosidase activities were determined in derivatives of Δ(lacI-lacZYA) strain S4084 (white bars) and isogenic hns mutant (grey bars). Anti- terminator protein λN was provided plasmidically using transformants of plasmid pKES219 (+λN).

Cultures were inoculated from fresh overnight cultures in LB medium to OD

600

0.05 and grown to

OD

600

0.5. For transformants with plasmid pKES219, the LB medium was supplemented with

kanamycin and 1 mM IPTG. Error bars represent standard deviation of three biological replicates (B)

Schematic representation of araC-P

BAD

-lacZ construct integrated chromosomally. Expression level

given as β-galactosidase activities were determined in derivative of ∆ara, ∆lac strain U65 and isogenic

hns mutant. Cultures were inoculated from fresh overnight cultures in tryptone medium to an OD

600

of

0.05 and induced with 0, 2, 10, 50, 250 and 1000 µM arabinose. The expression levels of wild-type and

hns mutant are indicated as solid and dashed lines, respectively. Average values of three biological

replicates are shown. Standard deviation is less than 20%. The following strains were used (A) T2316

(attB::P

UV5

-λtR1-lacZ/pKES269), T2318 (attB::P

UV5

-λtR1-lacZ hns/pKES269), T2261 (attB::P

UV5

-

lacZ/pKES268), T2279 (attB::P

UV5

-lacZ hns/pKES268) (B) U115 (attB::araC-P

BAD

-lacZ/pKEAR19),

U127 (attB::ara-P

BAD

-lacZ hns/pKEAR19).

(23)

18 data show that araC-P

BAD

allows gradual increase of transcription with increasing concentrations of arabinose and araC-P

BAD

module can be used to direct transcription into the H-NS repressed loci.

2.2 Transcription into H-NS repressed proU abrogates repression

The proU operon consisting of proVWX genes is osmoregulated. At low osmolarity, the proU promoter is repressed by H-NS, whereas the expression is strongly increased at high osmolarity conditions (Gowrishankar, 1985, Lucht et al., 1994, Ueguchi & Mizuno, 1993). H- NS binds to upstream and downstream regulatory elements of proU promoter enabling repression at low osmolarity (Dattananda et al., 1991, Overdier & Csonka, 1992, Bouffartigues et al., 2007). To investigate whether transcription into the H-NS repressed proU promoter abrogates the repression by H-NS, I inserted the P

UV5

tR1 module upstream of the proU promoter region within the native chromosomal context using λ-Red mediated homologous recombination (Figure 7A). Transcription initiated at P

UV5

promoter can be directed into the H-NS repressed proU promoter region by providing anti-termination protein λN. The relative expression levels of proU were determined using qRT-PCR using primer specific to proV, the first gene of the proU operon. For qRT-PCR, RNA was isolated from bacteria grown in LB at low osmolarity (10 mM NaCl) and high osmolarity (300 mM NaCl) conditions. The wild-type proU locus was used as control. In strain containing P

UV5

tR1-P

proU

, the relative expression level was tested in the absence and presence of λN provided plasmidically. The expression levels, given in arbitrary units were determined relative to the expression level of wild-type proU at high osmolarity (300 mM NaCl).

For wild-type proU, the relative expression level increased 500-fold from 0.22 at low osmolarity (10mM NaCl) to 100 at high osmolarity (300 mM NaCl) (Figure 7B). This 500- fold increase at high osmolarity is in accordance with the previously determined several hundred fold osmoregulation of proU operon (Gowrishankar, 1985, Dattananda et al., 1991).

Similarly, osmoregulation of P

UV5

tR1-P

proU

was 600-fold in the absence of λN (Figure 2B,

compare 0.25 and 154 units grown at 10 and 300 mM NaCl, respectively). This shows that the

insertion of P

UV5

tR1 module does not affect proU osmoregulation. However, in the presence

of λN protein, the relative expression of P

UV5

tR1-P

proU

increased from 0.25 to 22 at low

osmolarity (10 mM NaCl) (Figure 7B, P

UV5

tR1-P

proU

). At high osmolarity, no difference in

expression was observed in the presence and absence of λN protein (300 mM NaCl) (Figure

2B, compare expression levels 154 and 158, P

UV5

tR1-P

proU

). These data show that the

(24)

19 expression of P

UV5

tR1-P

proU

increases at low osmolarity (10 mM NaCl) upon expression of λN.

This increase in expression of P

UV5

tR1-P

proU

at low osmolarity might be due to the

transcriptional read through from upstream P

UV5

tR1 promoter into the proV region. However,

transcription directed from the upstream P

UV5

tR1 module might also de-repress the native

proU promoter. In order to differentiate these possibilities, I performed 5ˈRACE analysis of

RNA isolated from P

UV5

tR1-P

proU

grown at low osmolarity (10 mM NaCl) in the presence and

absence of λN protein. For 5ˈRACE, primary transcripts were ligated to a RNA adapter and

the transcription start site was determined by PCR using adapter specific and proV specific

primer (Figure 7A, indicated by an arrow). In the absence of λN protein no products

corresponding to P

proU

and P

UV5

promoter were observed (Figure 7C). However, in the

presence of λN products corresponding to transcripts initiated at P

UV5

and the P

proU

promoters

were detected (Figure 7C). These products were cloned and at least four clones of each were

sequenced. The assemblies of the sequenced clones are shown in Figure 6C. In case of P

UV5

,

all the four clones mapped to the known transcription start site of P

UV5

promoter. In case of

P

UV5

three out of four clones mapped to the known transcription start site of P

proU

promoter

and one clone mapped 3 bp upstream of the P

proU

promoter. Taken together, these data suggest

that transcription into the H-NS repressed proU promoter region de-represses P

proU

promoter.

(25)

20 Figure 7: Transcription into the H-NS repressed proU promoter relieves its repression. (A) Schematic representation of proU operon consisting of P

proU

promoter and proV, proW, proX genes.

Allele P

UV5

tR1-PproU was generated by insertion of P

UV5

tR1 cassette 292 bp upstream of PproU promoter. Arrow indicates the position of proV specific primer (S728) used for 5ˈRACE.The qRT- PCR amplicon is indicated. (B) Relative expression of proU operon (wild-type strain T1241) and allele P

UV5

tR1-PproU (strain T1642) was determined by qRT-PCR. RNA was isolated from cells grown at low and high osmolarity, in LB with 10 mM and 300 mM NaCl, respectively. Anti- terminator protein λN was provided by transformation of strain T1642 with plasmid pKES219 (+λN), which was grown in medium supplemented with kanamycin and 1 mM IPTG. For qRT-PCR proV specific primers T520 and T521 were used. Ct values are normalized to expression levels of 16s rRNA determined by primers T528 and T529. The expression level (in arbitrary units) is determined relative to the expression level of wild-type proV (strain T1241) grown in high osmolarity (LB with 300 mM NaCl). Error bars represent standard deviation of three biological replicates. (C) Mapping of the 5ˈend of the transcript by 5ˈRACE of P

UV5

tR1-PproU (strain T1642) grown in LB medium with 10 mM NaCl. Adapter specific primer OA9 and proV specific primer S728 were used for PCR amplification.

PCR was done for 30 cycles. 5ˈRACE products marked in black and white triangles were cloned and at least four clones of each were sequenced. The assemblies of the sequenced clone are shown.

Transcription start sites (+1) are marked in bold and the RNA adapter is underlined. 5ˈend of the

transcript mapped to known transcription start site (+1) of P

UV5

in 4 out of 4 clones and P

proU

in 3 out

of 4 clones.

(26)

21 2.3 De-repression of proU is directly proportional to the transcription rate

My above results suggest that transcription into the H-NS repressed proU promoter region de- represses the P

proU

promoter. In order to determine the correlation between the transcription rate and de-repression of P

proU

promoter, I inserted the araC-P

BAD

cassette upstream of the proU promoter region in the native chromosomal context (Figure 8A). The araC-P

BAD

module allows increasing the transcription rate gradually by inducing with increasing concentration of arabinose (0, 0.01, 0.05, 0.26, 1.3 mM). The strain containing araC-P

BAD

-P

proU

was grown in low osmolarity medium, under which P

proU

is repressed by H-NS (10 mM NaCl). The expression levels were determined using primer pairs that map upstream and downstream of P

proU

by qRT-PCR. The upstream primer pair measures the transcripts directed by P

BAD

promoter and the downstream primer pair measures the transcripts in the proV region directed by P

BAD

and P

proU

(Figure 8A). As expected, the transcript directed from P

BAD

promoter, increased with the increase in concentration of arabinose (Figure 8B, dashed line). Moreover, the level of proV, measured by downstream primers pair also increased with the increase in concentration of arabinose (Figure 8B, solid line). Additionally, the ratio between the transcription rate and the proV expression, measured by the upstream and downstream primer pairs respectively, was calculated to be constant across different arabinose concentrations (Figure 8B, grey line). This result shows that increasing the transcription rate from P

BAD

increases the expression of proV at low osmolarity and the ratio of transcripts between upstream and downstream of P

proU

is constant.

To differentiate between the read through from P

BAD

promoter and P

proU

, 5ˈ RACE analysis was performed using proV specific primer (Figure 8A, indicated by arrow). As a control, wild-type proU was grown in LB at low and high osmolarity medium (10 and 300 mM NaCl).

In wild-type proU, no product corresponding to P

proU

was observed at 10 mM NaCl, whereas P

proU

was detected at 300 mM NaCl (Figure 8C). In araC-P

BAD

-P

proU

, to determine the transcripts directed from P

BAD

and P

proU

, RNA was isolated from bacteria grown at low osmolarity medium (10 mM NaCl) with increasing concentrations of arabinose (0, 0.01, 0.05, 0.26, 1.3 mM). In araC-P

BAD

-P

proU

, the amount of 5ˈRACE product corresponding to P

BAD

promoter increased with the increase in concentration of arabinose (Figure 8C). Additionally,

with the induction of P

BAD,

a P

proU

specific 5ˈRACE product was apparent and its amount

increased similar to the level of induction of P

BAD

(Figure 8C). These data validate the finding

that transcription into H-NS repressed proU promoter region de-represses P

proU

and the

transcription rate is proportional to the de-repression.

(27)

22 Figure 8: De-repression of P

proU

is directly proportional to rate of transcription into the promoter region. (A) Schematic representation of the allele araC-P

BAD

-P

proU

which was generated by inserting araC P

BAD

cassette 282 bp upstream of P

proU

promoter. Arrow indicates the position of proV specific primer used for 5ˈRACE. qRT-PCR amplicons upstream and downstream of P

proU

are indicated. (B) Expression levels were determined by qRT-PCR in allele araC-P

BAD

-P

proU

(strain U86).

RNA was isolated from cells grown in LB medium at low osmolarity (10 mM NaCl) and induced with 0, 0.01, 0.05, 0.26 and 1.3 mM arabinose in exponential culture. Transcript levels upstream of P

proU

(dashed line) were determined with primers OA94 and OA95 and transcript levels downstream of P

proU

(solid line) were determined with T520 and T521. Ct values are normalized to the expression levels of 16S rRNA determined with primers T528 and T529. The expression levels (in arbitrary units) are determined relative to the expression level of cells grown with 1.3 mM arabinose. The grey line indicates the ratio of transcripts between downstream and upstream regions of P

proU

. Error bars represent standard deviation of three biological replicates. (C) 5ˈ RACE analysis was done using proU specific primer S728 in wild-type (strain U65) grown in LB with 10 mM and 300 mM NaCl and araC- P

BAD

-P

proU

(strain U86) grown in LB with 10 mM NaCl induced with 0, 0.01, 0.05, 0.26 and 1.3 mM arabinose. Bands corresponding to P

BAD

and P

proU

are indicated by closed and open arrow, respectively.

PCR was done for 30 cycles.

(28)

23 2.4 Transcription into H-NS and H-NS/StpA repressed pdeL and appY abrogates repression

StpA is a paralogue of H-NS protein which forms heteromeric complexes with H-NS (Zhang et al., 1996, Johansson et al., 2001). I wanted to determine whether transcription into other H- NS and H-NS/StpA repressed genes abrogates repression similar to proU. In order to study this, pdeL and appY were chosen which were found to be bound by H-NS and H-NS/StpA, respectively, in a ChIP-Microarray (Uyar et al., 2009). The pdeL gene encodes for cyclic-di- GMP phosphodiesterase and transcriptional regulator (Schmidt et al., 2005, Sundriyal et al., 2014). The promoter of pdeL is repressed 15-fold by H-NS (Yilmaz, 2014). The appY gene encodes for an AraC type transcriptional regulator which is induced during anaerobiosis, phosphate starvation and stationary phase (Brondsted & Atlung, 1996, Atlung & Brondsted, 1994). The promoter of appY gene is repressed by H-NS and bound by H-NS and StpA (Atlung et al., 1996, Uyar et al., 2009).

In order to test whether transcription into pdeL abrogates repression, I inserted the P

UV5

tR1 module upstream of pdeL promoter region at the native chromosomal locus (Figure 9A, left).

The relative expression levels of wild-type pdeL and P

UV5

tR1-P

pdeL

were determined by qRT- PCR using pdeL specific primers. For wild-type pdeL, the relative expression increased from 5 units in the wild-type to 111 units in the hns mutant (Figure 9B left, P

pdeL

). This result shows a 22-fold H-NS repression of P

pdeL

. Next, the relative expression level of P

UV5

tR1-P

pdeL

was tested in wild-type and hns background in the presence and absence of λN protein. In the absence of λN, P

UV5

tR1-P

pdeL

was repressed 44-fold by H-NS (Figure 9B left, compare expression levels 1.5 and 66 in P

UV5

tR1-P

pdeL

). However, in the presence of λN protein, the relative expression increased from to 145 units in wild-type and to 180 units in hns mutant (Figure 9B left, P

UV5

tR1-P

pdeL

). These data show that the expression of P

UV5

tR1-P

pdeL

increases upon increasing the transcription elongation by λN. To distinguish read-through from the upstream P

UV5

promoter and de-repression of P

pdeL

, 5ˈRACE analysis was performed with primer specific to pdeL. As control, 5ˈRACE product of the native pdeL locus was analyzed in wild-type and hns mutant. No product corresponding to P

pdeL

was observed for RNA isolated from wild-type, but a product corresponding to P

pdeL

transcript was observed for RNA isolated from hns mutant (Figure 9C, left, P

pdeL

). In case of P

UV5

tR1-P

pdeL

, in the absence of λN protein, no product corresponding to P

UV5

and P

pdeL

transcripts were observed.

However, in the presence of λN protein, bands corresponding to P

UV5

and P

pdeL

were detected

(Figure 9C, left, P

UV5

tR1-P

pdeL

). Cloning and sequencing of these bands showed that the

(29)

24 product of P

UV5

mapped to the known transcription start site of P

UV5

and the band corresponding to P

pdeL

mapped to 4 nucleotides downstream of the previously predicted P

pdeL

transcription start site (Shimada et al., 2005).The mapped transcription start site of P

pdeL

possesses a typical -10 region (TATAAT) which is the characteristic of most of the promoters in E. coli (Figure 9C). This indicates that the newly mapped transcription start site represents the actual transcription start site of P

pdeL

. Taken together, these data suggest that the transcription into the pdeL promoter region counteracts its repression by H-NS.

Next, I studied whether transcription into appY abrogates its repression. For this, I inserted the P

UV5

tR1 module upstream of the appY promoter region in chromosomal context (Figure 9A, right). The relative expression levels were determined in wild-type, hns and hns stpA background, by qRT-PCR using primers mapping in appY gene. In wild-type background, P

appY

is repressed 75 fold by H-NS (Figure 9B right, compare expression levels 0.08 and 6 in P

appY

) and 1250 fold by H-NS/StpA (Figure 9B right, compare expression levels 0.08. and 100 in P

appY

). This shows that appY promoter is strongly repressed by H-NS/StpA heteromeric complex. Next, the P

UV5

tR1-P

appY

expression was tested in wild-type, hns, and hns stpA background in the presence and absence of λN protein. In the presence of λN protein, the relative expression increased from 0.11 to 10 in wild-type (Figure 9B right, P

UV5

tR1-P

appY

). In hns mutant, the relative expression level increased from 9 to 46 units (Figure 9B right, P

UV5

tR1-P

appY

) and in hns stpA mutant the expression level remained the same (Figure 9B right, compare expression levels 116 and 109 in P

UV5

tR1-P

appY

). These data suggest that the relative expression level of P

UV5

tR1-P

appY

increases when transcription is directed into P

appY

by λN. In order to differentiate between the read-through from upstream P

UV5

promoter and de-repression of P

appY

promoter, 5ˈRACE was performed. As control, RNA isolated from wild-type, hns and hns stpA background were used. In wild-type, P

appY

promoter is strongly repressed by StpA and weakly by H-NS, as the products corresponding to P

appY

were observed in hns stpA mutant, while they were weak in hns mutant, and not detected in wild-type (Figure 9C right, P

appY

). Likewise, for P

UV5

tR1-P

appY

in the absence of λN protein, the products corresponding to P

appY

was seen weakly in hns and strongly in hns stpA mutant. However, in the presence of λN protein, in P

UV5

tR1-P

appY

the bands corresponding to P

UV5

and P

appY

transcripts were detected in wild-type and it was also apparent in hns and hns stpA mutant

background (Figure 9C right, P

UV5

tR1-P

appY

). Since the transcription start site of P

appY

is

unknown, the P

appY

specific transcripts (P

appY-1

and appY-2) from hns stpA mutant were cloned

and sequenced. Products corresponding to P

appY-1

transcripts mapped to 101 bp upstream of

the translational start site of appY preceded by an ideal -10 region. Products corresponding to

(30)

25 appY-2 transcripts mapped within appY gene, 7 bp downstream of translation start site (Figure 9C, P

appY-1

and appY-2). Since all the transcripts analyzed are from TAP (Tobacco acid pyrophosphatase) treated samples, processed and the primary transcript could not be differentiated. Therefore, it remains to be analyzed whether appY-2 is a processed or primary transcript. For P

UV5

tR1-P

appY

, cloning and sequencing of the band corresponding to P

UV5

mapped to the known transcription start site of P

UV5

, and the bands corresponding to P

appY

transcripts mapped to P

appY-1

and appY-2 transcripts. Collectively, these data suggest that the

transcription into appY promoter region relieves repression by H-NS and StpA.

(31)

26

Figure 9: Transcription into pdeL and appY relieves repression by H-NS and H-NS/StpA

respectively. (A) Schematic representation of P

UV5

tR1-pdeL (left) and P

UV5

tR1-appY (right) alleles in

which P

UV5

tR1 cassette was inserted 838 bp and 463 bp upstream of pdeL and appY start codon

respectively. Arrow indicates the position of primers used for 5ˈRACE. qRT-PCR amplicons are

indicated. (B) Expression levels of pdeL, P

UV5

tR1-pdeL (left) and expression levels of appY, P

UV5

tR1-

pdeL in wild-type (white bars), hns (grey bars) and hns stpA (dark grey bars) strain background, as

indicated. The λN provided was provided by transformation with plasmid pKES219 (+λN), grown in a

medium supplemented with kanamycin and 1 mM IPTG. For expression analyses of pdeL and appY

wild-type strain T1241, hns mutant U72, and hns stpA mutant U73 were used, as indicated. Allele

P

UV5

tR1-pdeL was analyzed in strains T1647 (wt) and T1713 (hns). Allele P

UV5

tR1-appY was analyzed

in strains T1646 (wt), T1712 (hns), and T1949 (hns stpA). qRT-PCR was performed using pdeL

specific primers T892, T893 and appY specific primers T910, T911 and the data were normalized to

rpoD expression, determined with primers T247 and T248. For pdeL, the expression levels are

determined relative to the expression level in hns mutant U72 (left). For appY, the expression levels

are determined relative to the expression level in hns stpA mutant U73 (right). Error bars represent

standard deviation of three biological replicates. (C) 5ˈ RACE was performed with pdeL and appY

specific primers T930 and OA24. PCR was done for 30 cycles. Bands indicated with triangles were

cloned and at least four clones were sequenced. Mapped 5ˈ mRNA ends (marked in bold) correspond

to the known start site of the P

UV5

promoter and the presumptive transcription start sites of P

pdeL

and

P

appY

promoters each preceded by a -10 region (underlined). The mapped RNA 5’ end labelled appY-2

maps within the appY coding region and may correspond to a promoter or processed transcript.

Abbildung

Figure  1:  Domain  organization  and  binding  modes  of  H-NS.  (A)  Schematic  illustration  of  structural  components  and  domain  organization  of  H-NS  protein
Figure  2:  Mechanisms  of  H-NS  repression  at  the  level  of  transcription  initiation
Figure  3:  H-NS  modulating  transcription  elongation  and  vice-versa  (A)  H-NS  interfers  with  transcription  elongation
Figure 4: Binding of Hha protein in H-NS complex. Hha (yellow) binds to the N-terminal domain  of H-NS (red) providing an additional contact surface with a positive charge for DNA binding
+7

Referenzen

ÄHNLICHE DOKUMENTE

Still ring shaped structures are formed, but these structures appear similar to the illumina- tion of the other materials at high laser intensities, where

Det er praktisk at få vist 9 fotos, når du skal vælge fotos, der skal udskrives ved brug af Print Range of Photos (Udskriv en række fotos) eller angive indstillinger for View

(VIL DU BENYTTE DETTE PAPIR?) vises på LCD-displayet, skal du trykke på knappen Menu for at vælge mediet og derefter trykke på knappen Enter for at indstille mediet..

im relativ unpolaren Wasser/Acetonitril-Gemisch → im relativ polaren Wasser/Acetonitril-