The Mechanism and Modulation of H-NS Mediated Repression in Escherichia coli
I n a u g u r a l - D i s s e r t a t i o n zur
Erlangung des Doktorgrades
der Mathematisch-Naturwissenschaftlichen Fakultät
der Universität zu Köln
vorgelegt von Madhusudhan Srinivasan
For the birds...
Over the bridge
"I wonder why, I wonder why, I wonder why I wonder;
I wonder why, I wonder why, I wonder why I wonder."
-- Richard P Feynman.
Berichterstatter/in: Prof. Dr. Karin Schnetz Prof. Dr. Jürgen Dohmen
TAG DER LETZTEN MÜNDLICHEN PRÜFUNG: 06 NOVEMBER 2007
Acknowledgements
First of all, Karin, my heartfelt thanks for everything; the guidance, suggestions, comments, criticism, understanding, for redefining ‘being organized’(for the better), the picky-ness, the occasional kick in the behind (which I definitely need), and so on. You’ve thought me all that I know. Ich stehe tief in Deiner Schuld.
As a part of the Schnetz lab, I’ve been lucky enough to meet and befriend some wonderful people. Vel, Sabari, Andreas, Kathleen, Raja, Girish, and Tinka thanks for the wonderful time I had here. It’s certainly been four best years of my life.
I am grateful to Rachid for help with the footprinting and the great time in France.
Thanks to Brigette, Sebastian and the Graduate school for all the financial and academic support.
I am eternally thankful to RJ, ‘the midwife of my miseries’.
Chris, Josi, Maya and Niels, meine familie hier, thanks for the ride through the ups and downs.
Finally, amma, vasu, chcickappa, a zenouska moje, ellam onakke.
Contents
i
ABBREVIATIONS iv I. ZUSAMMENFASSUNG 11. SUMMARY 2
2. INTRODUCTION 3
2.1 H-NS as a regulator of gene expression in Escherichia coli. 3 2.2 H-NS structure and mechanism of repression. 3 2.3 The transcription cycle in Bacteria. 6 2.4 Post-transcriptional regulation of gene expression in Bacteria. 8 2.5 Escherichia.coli bgl and proU operons as reporters of repression by H-NS. 9 2.6 Objectives of the current study. 11
3. EXPERIMENTAL PROCEDURES 12
3.1 Media 12 3.2 Antibiotics, sugars, Aminoacids 15 3.3 Standard Molecular Biology Techniques 15 3.4 Plasmids 16 3.5 Bacterial strains 19 3.6 Preparation of competent cells and transformation 21 3.7 Integration of plasmids into the attB site of the E.coli chromosome 22 3.8 Transduction with phage T4GT7 23 3.9 Deletion of genes according to Datsenko and Wanner 23 3.10 ß-galactosidase assays 24 3.11 Transposon mutagenesis 24 3.12 SDS-PAGE and Western blotting 25 3.13 RNA analysis by Northern blotting 26 3.14 Chloroacetaldehyde (CAA) footprinting 27 3.15 Primer Extensions 29
4. RESULTS 30
4.1REPRESSION BY H-NS BINDING WITHIN THE TRANSCRIPTION UNIT. 30 4.11 Footprinting for paused RNA polymerase excludes the possibility of H-NS acting as a
roadblock to the elongating polymerase. 31
Contents
ii
4.12 H-NS binding to the bgl-DRE inhibits transcription initiation prior to the open complexformation.
334.13 Synergy in repression of bgl and proU by H-NS bound to the URE and DRE. 35 4.14 Poising of the RNA polymerase at the proU promoter under low osmolariy. 38 4.2MODULATION OF REPRESSION BY H-NS BOUND WITHIN THE TRANSCRIPTION UNIT 40
4.21 A dnaKJ mutation suppresses the enhanced repression by H-NS in the lon mutant. 42 4.22 The dnaKJ::miniTn10 (dnaKJ-M2) mutation specifically suppresses the H-NS repression
through the bgl-DRE. 43
4.23 The DnaKJ chaperone system is imperative for the repression of transcription through bgl byH-NS.
454.24 Inhibition of termination factor Rho neutralizes the effect of Lon on repression by H-NS
through bgl-DRE. 47
4.25 Termination factor Rho and the Nus factors involved in transcription termination are nottargets for Lon protease. 50
4.26 Protease Lon does not alter the stability of H-NS. 534.27 Could the Lon effect be mediated by a factor involved in mRNA processing? 54
4.3POST-TRANSCRIPTIONAL REGULATION OF PROU 55
4.31 proU is subject to post-transcriptional osmoregulation. 56 4.32 The post-transcriptional osmoinduction of proU is reduced in hns mutants. 58
4.33 Hfq is required for efficient expression of proU. 58 4.34 Deletion analysis shows that the complete proU-DRE is necessary for post-transcriptional
osmoinduction
614.35 The half-life of the proU mRNA is not significantly altered 62 4.36 RNAse III and RNAse E are involved in processing the proU mRNA. 66
4.37 RNAse III processes the proU mRNA at position +217. 68 4.38 RNAse III processes the proU mRNA in a stretch of highly conserved sequence. 71
5. DISCUSSION 78 5.1 The mechanism of repression by H-NS binding within the bgl and proU transcription units 79 5.2 Transcription modulates the H-NS mediated repression of the proU and bgl operons. 81 5.3 Additional factors in the modulation of repression by h-ns bound within the bgl transcription
unit.
835.4 post-transcriptional osmoregulation of proU. 84 5.5 The modulation of H-NS mediated repression is gene specific. 88
Contents
iii
6. BIBLIOGRAPHY 90Erklärung
Lebenslauf
Carriculum Vitae
Abbriviations
iv
Abbrevations
bp base pair(s)
CAA chloroacetaldehyde
cAMP 3'-5'-cyclic adenosine monophosphate CRP catabolite regulator protein
DRE downstream regulatory element
DTT dithiothreitol
EDTA ethylenediaminetetraacetic acid.
H-NS histone-like nucleoid structuring protein IPTG Isopropyl β-D-1-thiogalactopyranoside
kDa kilo Dalton
OD optical density
ONPG o-nitrophenyl-β,D-galactopyranoside URE upstream regulatory element
wt wild type
I. Zusammenfassung
Das Histon-ähnliche Nucleoid-strukturierendes Protein H-NS agiert als globaler Regulator der Genexpression in Antwort auf Umwelteinflüsse und Streßkonditionen. Es wird angenommen, daß die Repression durch H-NS durch dessen Bindung an primäre
“Nucleation sites” in der Nähe von Promotoren vermittelt wird. Ausgehend von diesen Nucleation sites bildet H-NS erweiterte Nucleoprotein-Komplexe, die die Transkriptionsinitiation inhibieren. Die Modulation der H-NS vermittelten Repression ist ein komplex, und erfolgt unter anderem durch spezifische Transkriptionsfaktoren und DNA-Strukturänderungen, die durch Änderung der zellulären Physiology induziert sind. . Das bgl- sowie das proU-Operon in E. coli werden mit hoher Spezifität von H-NS reprimiert. Beide Systeme verfügen über stromaufwärts (upstream) und stromabwärts (downstream) gelegene Regulationselemente (URE bzw. DRE), an die H-NS für eine effiziente Repression bindet. Die vorliegende Studie zeigt, daß H-NS die Initiation der Transkription ausgehend vom bgl-Promoter inhibiert, analog zur beschriebenen Repression des proU-Systems. Die Repression von proU und bgl, vermittelt durch die Bindung von H-NS an das stromaufwärts und stromabwärts gelegene Regulationselement, ist synergistisch. Zusätzlich beeinflussen sich im Falle des bgl-Operons die Repression durch Bindung von H-NS an das stromabwärts gelegene Regulationselement und die Transkription. Dies wird durch den Terminationsfaktor Rho, ko-transkriptionelle Translation, die Protease Lon und, wie hier gezeigt, ist das DnaKJ Chaperonsystem für die Repression über das bgl-DRE essentiell. Im Falle von proU ist die RNA Polymerase bei niedriger Osmolarität am Promoter gefangen (poising), während sie bei hoher Osmolarität den Promoter mit höherer Effizienz verlässt. Der Mechanismus sowie das Signal, das für ein effizientes Loslösen der RNA Polymerase vom proU-Promotor (“promoter clearence”) bei hoher Osmolarität verantwortlich ist, sind unbekannt. Das proU Operon ist außerdem Gegenstand posttranskriptioneller Osmoregulation. Die proU mRNA wird innerhalb eines hochkonservierten Sequenzabschnittes durch die RNAse III prozessiert. Dies legt einen allgemeinen Regulationsmechanismus nahe, der wahrscheinlich innerhalb der Enterobakterien konserviert. Zusammenfassend zeigt die vorliegende Studie, daß der Mechanismus der H-NS vermittelten Repression des bgl -und proU-Operons sehr ähnlich ist. Die Modulation derselben ist ein komplexer Mechanismus, der eine Vielzahl von zusätzlichen Faktoren umschließt, die spezifisch für das jeweilige System sind, und erfolgt demnach in einer Kontext-spezifischen Art.
Zusammenfassung
1
1. Summary
The histone-like nucleoid structuring protein H-NS acts as a global repressor of genes that are expressed in response to environmental stimuli and stress conditions. Repression by H-NS is presumably mediated by binding of H-NS to primary ‘nucleation sites’ close to promoters, and the formation of extended nucleoprotein complex from these nucleation sites to inhibit transcription initiation.
Modulation of H-NS mediated repression is a complex process involving specific transcription factors and physiology dependent structural alterations. The E. coli bgl and proU operons are model systems that are repressed by H-NS with exceptional specificity. Both of these systems possess upstream and downstream regulatory elements (URE and DRE) bound by H-NS for efficient repression. The present study demonstrates that repression by H-NS binding upstream and downstream is synergistic in proU (as shown in a parallel study for bgl), and that H-NS when bound within the transcription unit represses transcription initiation at the bgl promoter, as reported before for proU. Repression by binding of H-NS downstream is known to be modulated. Common to both proU and bgl is that an increase in the promoter activity abrogates repression. For bgl it is known, that the H-NS mediated repression of the promoter is counteracted by transcription factors BglJ and LeuO. Further, termination factor Rho and the protease Lon are known to modulate repression by H-NS through the DRE, and as shown here the DnaKJ chaperone system is essential for this repression. In case of proU, the promoter is osmoregulated; the RNA polymerase is poised at the promoter at low osmolarity, while it clears the promoter with better efficiency at high osmolarity. Furthermore, the proU operon is subject to post- transcriptional osmoregulation. The proU mRNA is processed by RNAse III within a stretch of highly conserved sequence, suggesting a common mechanism of regulation among Enterobacteria. In summary, the present study demonstrates that the mechanism of H-NS mediated repression of the bgl and proU operons is very similar.
However, its modulation is complex involving numerous additional factors specific to the two systems, and thus is achieved in a context specific manner.
Summary
2
2 Introduction
2.1 H-NS as a regulator of gene expression in Escherichia coli.
The bacterial histone-like nucleoid structuring protein (H-NS); initially described as a heat stable nucleoid associated protein (Falconi et al., 1988), is a small basic protein present at around 20,000 molecules per genome equivalent and is highly conserved in gram negative bacteria (Falconi et al., 1988). H-NS is implicated in maintaining the higher order structure of the nucleoid, compactation and partitioning of the chromosome (Kaidow et al., 1995). However, it is probably best characterized for its role in transcriptional regulation (Dorman, 2004) (Luijsterburg et al., 2006).
Genomic and proteomic studies have shown that H-NS affects approximately 5% of the E. coli genes, many of which play a role in adaptation to environmental stimuli (Bertin et al., 1999) (Hommais et al., 2001). H-NS acts as a global transcriptional repressor since most of the genes reported to be regulated by H-NS are repressed (Dorman, 2004). H-NS also affects major DNA transactions, such as DNA replication, transposition, recombination, and constrains supercoils (Dorman, 2004) (Rimsky, 2004). Genome scale mapping of H-NS sites in the genomes of Escherichia coli and Salomonelle enterica (serovar Typhimurium) suggests that H-NS has a major role in silencing horizontally acquired genes. These include pathogenicity islands encoding important virulence factors (Lucchini et al., 2006a) (Navarre et al., 2006). In this work, aspects of repression by H-NS and its modulation were analyzed.
2.2 H-NS structure and mechanism of repression.
The H-NS protein (136 amino acids, 15.6 KDa) can be divided into three structural domains. The N-terminal domain is required for dimerization of H-NS and extends up to the 65
thamino acid residue (Fig. 1a). The carboxy-terminal DNA-binding domain extends from amino acid residue 90 until the end of the protein. The N- and C- terminal domains are connected by a highly flexible linker domain. This unstructured linker is involved in formation of higher order oligomers of the protein (Badaut et al., 2002; Bloch et al., 2003; Dorman et al., 1999; Esposito et al., 2002). H-NS is believed to be a dimer in solution, although oligomers were observed at high protein
Introduction
3
b
Figure 1.Domain architecture and mechanism of repression by H-NS. a) The domain structure of H-NS is shown schematically. The numbers indicate the amino acid residues. N and C refer to N and C-terminal end of H-NS. The dimerization, linker and nucleic acid binding domain are indicated. b) Schematic representation of H-NS mediated repression of the rrnB P1 promoter. The rrnB P1 promoter region along with the flanking regions are shown in blue. The RNA polymerase (shown in orange) binds to the promoter region and H-NS shown in green traps RNA polymerase at the promoter. The antagonist protein FIS binds to regions upstream to the promoter, shown as dotted boxes and activates transcription presumably by disrupting the repression complex. Figure taken from (Dorman, 2004).
a
concentrations (Falconi et al., 1988; Smyth et al., 2000). H-NS binds preferentially to AT-rich and intrinsically curved DNA sequences (Dame et al., 2001; Rimsky et al., 2001; Schroder and Wagner, 2002). Upon binding to such high affinity ‘nucleation sites’ lateral interaction of H-NS dimers allows the binding to flanking low affinity sequences, to form extended nucleoprotein complexes. (Rimsky et al., 2001;
Bouffartigues et al., 2007). Thus, when binding close to a promoter, H-NS represses transcription by trapping the RNA polymerase at the promoter or by excluding the binding of RNA polymerase (Rimsky, 2004) (Dorman, 2004) (Fig. 1b). Trapping of RNA polymerase has been shown in case of the ribosomal rrnB P1 promoter (Dame et al., 2005; Dame et al., 2000; Dame et al., 2002) and the hdeAB promoter (Shin et al., 2005). In these cases, binding of H-NS to an AT-rich curved DNA upstream of the promoter allows H-NS to form a bridge to a DNA sequence downstream to the
Introduction
4
promoter and to zip the two double strands that flank the promoter together. DNA loop formation presumably is mediated by DNA-H-NS-DNA bridge formation, since a biophysical analysis demonstrated that one dimer of H-NS can bind to two DNA double strands (Dame et al., 2006)
H-NS controls gene expression under specific environmental conditions in response to pH, osmolarity and temperature (Atlung and Ingmer, 1997) (Dorman, 2007) (Amit et al., 2003). A function of thermosensing is attributed to H-NS with the discovery that more than 75% of the 531 genes showing altered expression due to a temperature up shift were dependent on H-NS (Ono et al., 2005). Such models have been bolstered by the observation that the structure of H-NS changes in response to temperature and osmolarity (Amit et al., 2003). However, several loci including the E.coli proU operon and the eltAB system are repressed with equal efficiency by H-NS at low and high temperatures (Lucht et al., 1994a) (Yang et al., 2005) (Umanski et al., 2002). Further, repression of the temperature regulated Shigella virF gene is subject to a temperature dependent DNA bend (Prosseda et al., 2004) Also, many H-NS regulated genes are unaffected by changes in osmolarity (Atlung and Ingmer, 1997).
This questions the role of H-NS as a global osmo- and thermosensor. Considering this, a recent review calls for a model where the H-NS mediated repression is regulated context specific, by specific transcription factors and by environemental parameters like temperature and osmolarity that change to DNA structure or activity of a protein at a specific locus (Navarre et al., 2007).
H-NS regulates gene expression by acting as a transcriptional repressor.
However, repression by H-NS is different from that by standard transcription factors, due to the low binding specificity and the sensitivity of nucleoprotein complex formation to structural changes (that may be intrinsic to the DNA or based on protein binding). Further, it is becoming evident that RNA polymerase itself at the step of transcription initiation and elongation can modulate the repression by H-NS (Shin et al., 2005; Dole et al., 2004a, Nagarajavel et al., 2007; Navarre et al., 2007).
Therefore, the essential features of the bacterial transcription cycle are presented below.
Introduction
5
2.3 The transcription cycle in bacteria.
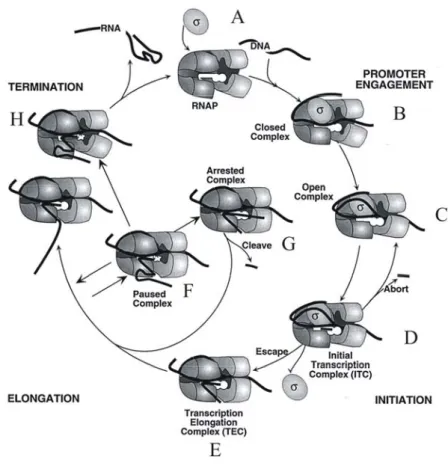
The transcription cycle is composed of three steps namely initiation, elongation and termination. Each of these processes involve complex mechanisms and are regulated by various factors (reviewed in (Mooney and Landick, 1999)). Upon promoter engagement by the RNA polymerase associated with a sigma factor, the DNA duplex of ~12bp at the promoter is melted. The melted region extends from -10 to +2 relative to the transcription start (Dehaseth and Helmann, 1995). This process may be accompanied by a change in the conformation of the RNA polymerase and is termed ‘open complex’ formation (Browning et al., 2000) (Fig. 2). Once the open complex has formed, transcription is initiated with the synthesis of RNA of about 9 to 11 bp. In this ‘initial transcription complex’ RNA polymerase remains strongly associated with the promoter. The initial transcription may result in the release of the short RNA transcripts, which is termed ‘abortive transcription’ (Vo et al., 2003), or it may result in clearing of the promoter and transition of the RNA polymerase into the transcription elongation phase. This requires overcoming of the interaction of RNA polymerase to the promoter DNA (Tadigotla et al., 2006). The regulation and kinetics of these steps determine the efficiency of promoter clearance, and thus the ‘strength’
of a promoter (Mooney and Landick, 1999). After promoter clearance, the RNA polymerase-DNA-RNA complex is stabilized by RNA polymerase-DNA contacts, RNA polymerase-RNA contacts, and by the RNA-DNA hybrid of 8 to 9bp until it reaches the termination signal. Transcription initiation and elongation complexes serve as important targets for regulatory factors (Borukhov et al., 2005) (Browning et al., 2004).
Transcription elongation is not a uniform process; it is marked by various punctuations that cause RNA polymerase to pause briefly or for an extended time.
Pausing involves RNA polymerase isomerizing from the rapidly translocating complex to an alternative state, where RNA chain extension becomes reversibly inhibited (Dalal et al., 2006) (Herbert et al., 2006) (Tadigotla et al., 2006) (Landick, 2006). Pausing is also a prerequisite for transcription termination and occurs by at least two mechanisms. Firstly, pausing can be induced by sequence dependent destabilization of the elongation complex, including for example an AT-rich stretch of DNA followed by a GC-rich sequence or RNA secondary structures formation at the
Introduction
6
exit channel of RNA polymerase (Artsimovitch and Landick, 2000; Landick, 2006).
Secondly, pausing occurs by elements which act as physical barriers to RNA polymerase translocation. These include roadblocks by DNA-binding proteins, misincorporated substrates, DNA lesions and special DNA sequences (Fish et al., 2002). Such pausing, at instances leads to the backward movement of the RNA polymerase (Artsimovitch and Landick, 2000; Toulme et al., 1999). Repeated backtracking and re-extension is thought to help the polymerase to eventually overcome the sequence or the physical barrier (Epshtein et al., 2003; Mosrin-Huaman et al., 2004). Alternatively, the stalled RNA polymerase might get into a state of arrest with neither forward nor backward movement (Davenport et al., 2000).The pausing
Figure 2. The transcription cycle in E. coli. A) The preinitation complex with RNA polymerase (RNAP), DNA, σ factor. B) The promoter engagement where the RNA polymerase-σ factor holoenzyme binds to the promoter DNA. C) The open complex formation where the duplex DNA melts in the promoter region. D) Formation of the initial transcription complex, with the addition of the first nucleotide. E) The transcription elongation complex where RNA polymerase translocates along the DNA concomitantly transcribing RNA. F) RNA polymerase becomes paused: in this case due to a RNA secondary structure as shown in the figure. The paused complex either can reversibly move into an arrested complex (G) or can lead to termination (H). G) The paused complex becomes arrested and is unable to translocate further until other cellular factors act to release the protruding RNA. H) Termination of transcription, where the RNA polymerase finally will dissociate from the DNA releasing the RNA (Mooney and Landick, 1999).
Introduction
7
events, depending on the formation of a stable RNA hairpin, followed by a uridine- rich (U-rich) tract and consequently, a weak RNA:DNA hybrid (Yarnell et al., 1999) or the action of Rho protein, which translocates along the nascent RNA until it reaches the polymerase, whereupon it induces transcript dissociation (Richardson, 2002) can lead to transcription termination. Pausing of the transcription elongation complex can play a role in gene regulation, for example as a means to allow synchronization of transcription and translation (Landick et al., 1996) and the binding of cofactors, which modify transcription and facilitate co-transcriptional folding of transcripts (Artsimovitch and Landick, 2002). RNA degradation counterbalances transcription, and therefore plays an important regulatory role in determining the steady-state level of a given mRNA.The mRNA generated from transcription is in many cases subject to post-transcriptional modifications. A brief introduction to post- transcriptional regulation in bacteria is outlined in the following section.
2.4 Post-transcriptional regulation of gene expression in Bacteria.
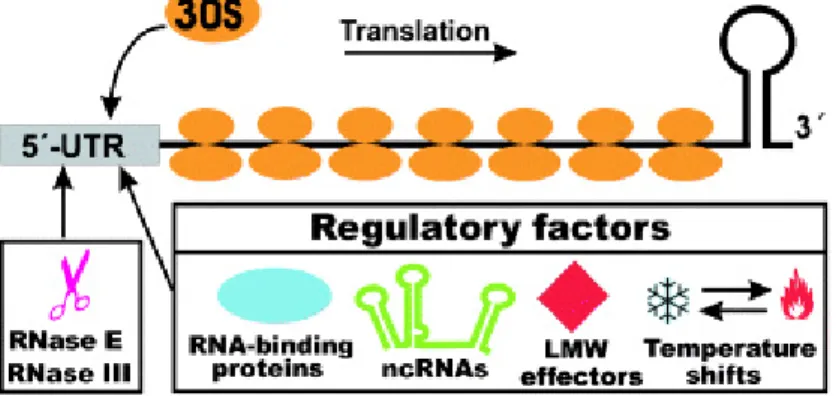
Unlike stable ribosomal and transfer RNAs, many mRNAs are susseptable to degradation by ribonucleases (Kushner, 2002). The average half-life of bacterial mRNAs is about 6.8 minutes (Selinger et al., 2003). Ineffiecient translation of mRNAs caused by poor binding of the ribosome to the leader has been shown to decrease their stability (Arnold et al, 1998). Thus, the 5' untranslated regions of many bacterial mRNAs serve as elements controlling the fate of transcripts. Additionally, regulatory factors such as RNA-binding proteins like StpA, Hfq and even H-NS (Brescia et al., 2004) (Mayer et al., 2007) (Valentin-Hansen et al., 2004), noncoding regulatory RNAs (ncRNAs) that usually basepair with the 5’-UTR harbouring the translation initiation region of their target mRNAs, which results in inhibition of translation leads to degradation of the ribosome-free mRNAs (Gottesman, 2004;
Majdalani et al., 2005), low molecular weight (LMW) effectors such as amino acids, coenzymes or vitamins have been recently found to bind to the 5'-UTR of many mRNAs to regulate their function (Winkler et al., 2002; Nahvi et al, 2002) (Vitreschak et al., 2002), and physical parameters like temperature (Morita et al.,
Introduction
8
1999) (Narberhaus et al., 2006), play important roles in deciding the stability of a given mRNA (Fig. 3).
Figure 3. Post transcriptional regulation in prokaryotes. The fate of the transcript of many bacterial mRNAs is controlled by the 5' untranslated regions. Factors influencing the fate of bacterial mRNAs include RNA-binding proteins, noncoding regulatory RNAs (ncRNAs), low molecular weight (LMW) effectors, temperature, endoribonucleases (RNase E and RNase III), and binding of ribosomes. Figure modified from (Kaberdin et al., 2006).
2.5 Escherichia coli bgl and proU operons as reporters of repression by H-NS.
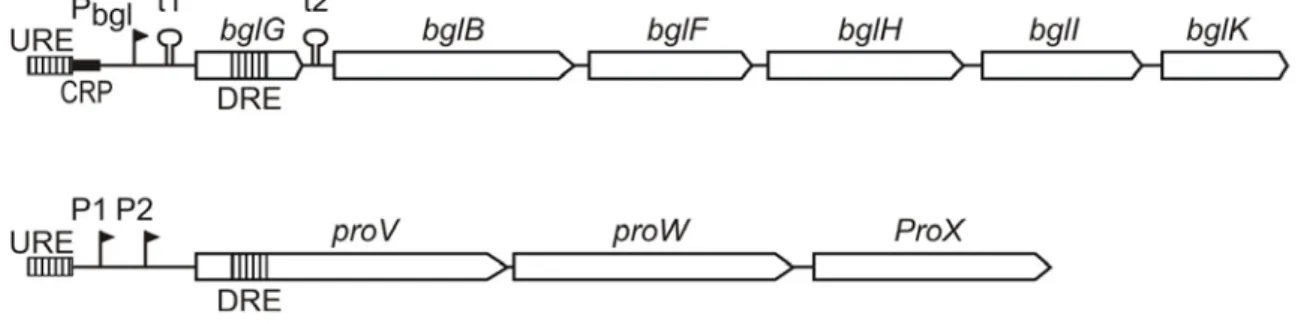
The bgl and proU operons in E. coli are repressed by H-NS with exceptionally high specificity, and in both loci H-NS binding upstream and downstream of the promoter (termed bgl-URE and bgl-DRE respectively) is required for effective repression (Schnetz, 1995; Druger-Liotta et al., 1987; Overdier and Csonka, 1992) (Fig. 4).
The bgl operon encodes gene products necessary for the uptake and fermentation of aryl-β,D-glucosides. Two Rho-independent transcriptional terminators, t1 and t2, flank the first gene of the operon bglG, which encodes an antiterminator (Schnetz et al., 1987; Schnetz and Rak, 1988a; Schnetz, 1995).
Although the operon is highly conserved in E.coli, no condition that allows the expression of the operon is known (Neelakanta, 2005). The operon is repressed ~100- fold by H-NS (Schnetz, 1995). However, in vitro, repression of the bgl promoter by H-NS is merely 4 to 5-fold (Schnetz and Wang, 1996) The sequence flanking the promoter, upstream and downstream were reported to be necessary for efficient repression by H-NS and based on this, a silencing nucleoprotein complex is thought to be formed by H-NS in bgl (Schnetz, 1995) (Caramel and Schnetz, 1998). Silencing by
Introduction
9
H-NS in bgl is overcome by spontaneous mutations, which map close the CRP- dependent promoter, including the deletion of an AT-rich regulatory region upstream of the promoter, integration of insertion elements, and point mutations that improve the CRP-binding site. These mutations disrupt the repressing nucleoprotein complex formed by H-NS and thus activete the operon (Mukerji and Mahadevan, 1997) and references therein (Schnetz and Rak, 1992). The activated operon is regulated substrate-specifically. The activity of the antiterminator BglG is modulated by reversible phosphorylation in response to the availability of the specific substrate, β-glucosides. In the absence of β-glucosides, BglG is inactivated by phosphorylation catalyzed by the by the sugar-specific permease enzymeII
Bgl, encoded by bglF (Schnetz and Rak, 1988b) (Amster-Choder, 2005), while in presence of the β-glucosides the phosphorylation and activation of BglG is mediated by Hpr, a major component of the phospho-enol-pyruvate-dependent phosphotransfer system (Gorke and Rak, 1999).
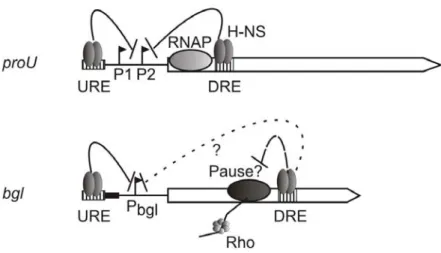
Figure 4. The E. coli bgl and proU operons. Scheme showing the bgl and proU operons with the promoter (Pbgl), the CRP binding site (CRP), the Rho independent terminators (t1 and t2) and the structural genes (bglG,B,F,H,I and K respectively) in case of bgl, and the three structural genes proV, proW and proX, driven by promoters P1 and P2 in case of proU. The H-NS binding sites in both bgl and proU are indicated with vertical hatched bars. H-NS binding upstream to the promoters is termed bgl- and proU-URE, respectively, while the binding region located downstream, within the structural genes is termed bgl- and proU-DRE, respectively.
The proU operon in E. coli consists of three genes, proV, proW and proX, and encodes a high affinity glycine-betaine uptake system, which is essential for cell survival under osmotic stress (Gowrishankar, 1989; May et al., 1989). In E. coli, two promoters P1 and P2 have been identified for proU, which are located 250 and 60 bp respectively upstream to the proV gene(Gowrishankar, 1989; Rajkumari et al., 1996b;
Introduction
10
Lucht et al., 1994a). Like in the case of bgl, the repression of proU by H-NS is highly specific and requires the presence of flanking sequence upstream and downstream to the promoter (proU-URE and proU-DRE) (Rajkumari et al., 1997) (Lucht et al., 1994b) (Barr et al., 1992) (Overdier and Csonka, 1992) (Owen-Hughes et al., 1992;
Dattananda et al., 1991), and binding of H-NS to the downstream regulatory region represses open complex formation at the promoter (Jordi and Higgins, 2000).
However, the highly specific repression of proU by H-NS observed in vivo could not be reproduced in vitro (Jordi et al., 1997).
2.6 Objectives of the current study.
This study addresses the mechanism and modulation of H-NS mediated repression of gene expression, using the E.coli bgl and proU operons as reporters.
Accordingly, the results obtained are presented in three sections; the first section addresses the specific mechanism of repression of bgl by H-NS and its parallels with the repression of proU, the second section focuses on the modulation of H-NS mediated repression of the bgl operon, and the identification of the post-transcriptional osmoregulation of proU is presented in the final chapter. The obtained results are discussed and integrated into a model.
Introduction
11
Experimental Procedures
12
3. Experimental procedures
3.1 Media LB
For 1 l 10g Bacto Trypton 5g Yeast Extract 5g NaCl
For plates add 15g Bacto Agar SOB
For 1 l 20g Bacto Tryptone 5g Bacto Yeast Extract 0.5g NaCl
1.25ml 2M KCl
Adjust pH to 7.0 with NaOH,
After autoclaving just before use add 10ml 1M MgCl
2per liter SOC
Per liter of SOB add 19.8ml 20% Glucose to SOB.
20 x M9:
140 g Na
2HPO
4x 2 H
2O 60 g KH
2PO
420 g NH
4Cl
H
2O ad 1 l
Experimental Procedures
13 M9 Medium (prepare from sterile solutions):
20 x M9 50 ml
0.1 M CaCl
21 ml
1 M MgSO
41 ml
1 mM FeCl
30.5 ml
Carbon source 1% final concentration:
20 % Glucose 50 ml or 80 % Glycerol 12.5 ml If required:
1 mg/ml Vitamin B1 1 ml 4 mg/ml amino acids 5 ml 10% casamino acids 66 ml H
2O
final volume 1 l
M9-plates
Autoclave 15 g Bacto-Agar
900 ml H
2O
Add, sterile 20 x M9 50 ml
0.1 M CaCl
21 ml
1 M MgSO
41 ml
1 mM FeCl
30.5 ml
Carbon source: 1 % final concentration Add, if required:
1 mg/ml Vitamin B1 1 ml
4 mg/ml amino acids 5 ml
10% casamino acids 66 ml
Experimental Procedures
14 Bromthymol blue plates (BTB-plates)
15g Bacto Agar 1g Yeast-Extract 1g Trypton 5g NaCl
add 900 ml H
2O, autoclave Add sterile:
1 ml 1 M MgSO4 1 ml 0,1 M CaCl2
1 ml Vitamin B1 (stock solution 1mg/ml, filter sterilize) 0,5 ml FeCl3 1mM
20 ml 10% (w/v) Casaminoacids
50 ml sugar (e.g. 10 % Salicin, 20% Lactose, etc.)
10 ml BTB stock solution (2% bromthymol blue in 50% EtOH, 0,1N NaOH)
Antibiotics if required.
The medium should be turquoise, if medium is green add NaOH, if it is blue add HCl.
MacConkey Lactose plates 40 g MacConkey Lactose Agar H
2O
Final volume 1 l X-gal
Final concentration is 40 µg/ml in LB / NB / minimal plates etc.
X-Gluc
Final concentration is 20 µg/ml in LB / NB / minimal plates etc.
Experimental Procedures
15 3.2 Antibiotics, sugars, Aminoacids
Antibiotics
stock solution final conc.
ampicillin 50mg/ml in 50 % EtOH 50 µg/ml chloramphenicol 30 mg/ml in Ethanol 15 µg/ml kanamycin 10 mg/ml in H
2O 25 µg/ml rifampicin 100mg/ml in Methanol 100µg/ml spectinomycin 50 mg/ml in 30% EtOH 50µg/ml tetracyclin 5mg/ml in 70 % Ethanol 12 µg/ml
Sugars
stock sol. final conc.
Glucose 20% 1 %
Glycerol 80 % 1 %
Salicin 10% 0.5 %
Casamino acids Final conc. 10% in H
2O
Dissolve by heating and filter through Schleicher & Schuell folded filters, then autoclave.
3.3 Standard Molecular Biology Techniques
Standard Molecular Biology applications like restriction enzyme digestions,
ligations and other enzymatic reactions, PCR, plasmid purification, auto-radiography
were performed as described in(Sambrook and Russell, 2001) or according to the
manufacturer’s instructions.
Experimental Procedures
16 3.4 Plasmids
Large scale preparations of plasmid DNAs were performed using the plasmid maxiprep/midiprep kit (Promega) according to manufacturer's instructions. A list of plasmids used in the study, with brief descriptions is given in the Table 1. Details of the plasmid constructions are documented in the lab records and sequences are compiled in Vector NTI (Invitrogen).
The plasmids used in the study were derivatives of pACYC, pSC101 or high copy pBR-derivatives (pKK177-3, pUC). The origin of each of the plasmids is also listed in Table 4. The pACYC-derivatives, carry the p15A origin of replication and the λ phage attachment site attP, to allow λ integrase mediated recombination insertion into the attB site of the E.coli chromosome (Diederich et al., 1992). The plasmids also have a Ω cassette containing (Prentki et al., 1991) the spectinomycin resistance gene aadA, flanked by transcriptional terminators. These plasmids were used for the integration of reporter gene fusions into the chromosome into the attB site (see below). The pSC101 derivatives used in the study carry the chloramphenicol resistance gene (cat), the repA gene and a lacI
qgene-lacUV5 or tac promoter cassette, followed by a multiple cloning site. The tac promoter is flanked by two operators for efficient repression by the lac repressor (LacI). Plasmid pKESK18 is a temperature- sensitive derivative of pSC101 (Hashimoto-Gotoh et al., 2000) with a kanamycin resistance gene. The plasmid carries the phage Lambda cI-857 allele encoding the temperature sensitive lambda repressor, the Tn10 transposase gene under control of the phage lambda P
Rpromoter, and a miniTn10 transposon (miniTn10-Cam
r) with a chloramphenicol resistance gene.
The plasmids pKK177-3 has a pBR322 based origin of replication, ampicillin
resistance gene (bla) and two strong Rho independent transcriptional terminators
rrnB-T1 and T2 (Brosius and Holy, 1984).
Experimental Procedures
17 Table 1: Plasmids used in This Study
Name Relevant structure/description
aand
replicon/resistance
bSource
pCP20 FLP recombinase, temperature Sensitive, ampR. (Datsenko and Wanner, 2000) pKD3 Template plasmid for gene deletion. CamR (Datsenko and Wanner, 2000) pKD4 Template plasmid for gene deletion. kanR (Datsenko and Wanner, 2000) pKD46 λ red recombinase, temperature Sensitive, ampR. (Datsenko and Wanner, 2000) pLDR8 λ repressor, cI-857; int under (Diederich et al., 1992)
the control of λ PR, pSC101 rep-ts, KanR
pFDX733 wt bgl operon, kanR (Schnetz et al., 1987) pFDX840 galK rrnBT1 T2 terminators, ampR, ori-pBR Lab collection pKEKB30 placUV5 bgl-URE Pbgl +25 lacZ,p15A, kanR, specR (Dole et al., 2004a) pKES15 attP bgl-URE Pbgl +54 lacZ,p15A, kanR, specR Lab collection
pKES99 attP PlacUV5 lacZ,p15A, kanR, specR (Nagarajavel et al., 2007) pKESD08 attP bgl-URE Pbgl t1 bgl-DRE lacZ,p15A, kanR, specR (Dole et al., 2002)
pKESD20 attP PlacUV5 t1 bgl-DRE lacZ,p15A, kanR, specR (Dole et al., 2002) pKESD48 attP PlacUV5 bgl-DRE lacZ,p15A, kanR, specR (Dole et al., 2002) pKESD49 attP PlacUV5 bgl-DRENT lacZ,p15A, kanR, specR (Dole et al., 2002) pKESK51 attP PlacUV5 t1RAT bgl-DRE lacZ,p15A, kanR, specR (Dole et al., 2002) pKESK18 cI-857-Tn10 transposase-mTn10-CmR, rep-ts pSC101kanR (Madhusudan et al., 2005) pKENV03 attP PlacUV5 proV’-DRElacZ,p15A, kanR, specR (Nagarajavel et al., 2007) pKENV34 attP proU-URE PproU proV’-DRE lacZ,p15A, kanR, specR (Nagarajavel et al., 2007) pKENV64 placUV5 t1RAT bgl-DRE, rrnBT1T2,PBR, ampR (Nagarajavel et al., 2007) pKENV67 bgl-URE PlacUV5 t1RAT bgl-DRE, rrnBT1T2,PBR, ampR (Nagarajavel et al., 2007) pKENV73 proU-URE PproU proV'-DRE rrnBT1T2, PBR, ampR (Nagarajavel et al., 2007) pKEM01 attP ptna-tnaC-tnaAФlacZ ,p15A, kanR, specR. This Study pKEM02 attP PlacUV5-Crotr1-lacZ,p15A, kanR, specR. This Study pKEM20 attP proU-URE PproU proV’-DREФ lacZ,p15A, kanR, specR This Study
pKEM21 attP proU-URE PproU proV’-DRENT lacZ,p15A, kanR, specR This Study pKEM26 placIq-lacI- lacO3 Ptac lacO1-His-rho,pSC101,CamR This Study
Experimental Procedures
18 Table 1: Plasmids used in This Study
Name Relevant structure/description
aand
replicon/resistance
bSource
pKEM31 rho (with stopcodon) ,pSC101,CamR This Study pKEM32 rho (without stopcodon) ,pSC101,CamR This Study pKEM44 lacIq- lacO3 Ptac lacO1 HA-rho, pSC101,CamR This Study pKEM45 lacIq lacO3 Ptac lacO1 HA-MCS, pSC101,CamR This Study pKEM46 lacIq lacO3 Ptac lacO1 MCS-HA, pSC101,CamR This Study pKEM47 lacIq lacO3 Ptac lacO1 rho-HA, pSC101,CamR This Study pKEM48 hns (with stopcodon) , pSC101,CamR This Study pKEM49 hns (without stopcodon) , pSC101,CamR This Study pKEM50 lacIq lacO3 Ptac lacO1 HA-hns, pSC101,CamR This Study pKEM51 lacIq lacO3 Ptac lacO1 hns-HA,p SC101,CamR This Study
pKEM52 placUV5- bgl-DRE-lacZ,PBR, ampR This Study
pKEM53 placUV5- bgl-DRENT-lacZ,PBR, ampR This Study pKEM54 promoterless(NT) bgl-DRE-lacZ,PBR, ampR This Study pKEM61 attPlacUV5- proV’-DREФ lacZ,p15A, kanR, specR This Study pKEM63 lacIq lacO3 Ptac lacO1-nusA-HA, pSC101,CamR This Study pKEM64 lacIq lacO3 Ptac lacO1-nusB-HA, pSC101,CamR This Study pKEM65 lacIq lacO3 Ptac lacO1-nusE-HA, pSC101,CamR This Study pKEM66 lacIq lacO3 Ptac lacO1-nusG-HA, pSC101,CamR This Study
pKEM67 placUV5-proV’-DRE,PBR, ampR This Study
pKEM68 lacIq lacO3 Ptac lacO1-greA-HA, pSC101,CamR This Study pKEM69 lacIq lacO3 Ptac lacO1-greB-HA, pSC101,CamR This Study pKEM72 placUV5-proU-DRE-rrnBT1 in pUC12 ampR This Study
a: The relevant structure of the plasmids is schematically shown. bgl-DRE refers to bgl operon from position +95 to +972 relative to the transcription start site. bgl-DRENT refers to mutation in the start codon and two additional ATG codons at position 3 and 27 to CGC, thereby rendering the bgl-DRE non-translatable. t1RAT indicates a mutation in the leader region of bgl operon at position +67 and +68 from AA to T making the construct independent of BglG mediated anti-termination. proU-DRE refers the proU operon from postion +1 to +303 relative to the transcription start site. CRP+ refers to C to T exchange at postion -66 relative to the transcription site.
b: plasmids which carry a pACYC (p15A) origin of replication and kanamycin, spectinomycin resistance markers also harbor the attP site for integration into the chromosome according to
Experimental Procedures
19
(Diederich et al., 1992). Plasmids carrying pBR origin of replication carry an ampicillin resistance marker. Detailed description of the plasmid construction is documented in lab records and the sequences are compiled in the lab Vector NTI (Invitrogen) database.
3.5 Bacterial strains
The bacterial strains used in this study and their description are listed in Table 2.
Table 2: E.coli K-12 strains used in This Study
Strain Relevant genotype or structure
aSource
CAG1843 F-, λ-, rph-1, ilvD500::Tn10 CGSC#7462
CSH50 bgl° Δ(lac-pro) ara thi (=S49) (Miller, 1972) S524 CSH50 ΔlacZ-Y217 (gpt-pro)+ (Dole et al., 2002)
S541 S539 Δbgl-AC11 ΔlacZ-Y217 (Dole et al., 2004b) S544 S524 Bgl+#9912 bgl-CAP (C -66ÆT) (Dole et al., 2004a)
S812 MC4100 hfq1::omega (Muffler et al., 1996)
S1193 S541 attB::[SpecR PUV5 bglDRE lacZ] (Dole et al., 2004b) S1195 S541 attB::[SpecR PUV5 bglDRE-NT lacZ] (Dole et al., 2004b) S1213 S541 attB::[SpecR bglURE Pbgl +25 lacZ] (Dole et al., 2004b)
S1553 S541 sulA3 Δlon proC+ (Dole et al., 2004a)
S1564 S541 sulA3 Δlon attB:: [SpecR PUV5 bglDRE- lacZ] (Dole et al., 2004a) S1816 S541attB:: [specR PUV5 t1RAT bglDRE lacZ] (Dole et al., 2004a)
S1906 S541 attB::[SpecR PUV5lacZ] x pKES99
S1975 S541 attB::[SpecR Ptna-tnaC-tnaA-lacZ] x pKEM02 S1983 S1553 attB::[specR Ptna-tnaC-tnaA-lacZ] x pKEM02 S1995 S1956 attB::[SpecR PUV5 bglDRE-NT lacZ] (Dole et al., 2004a) S2048 S541 attB::[SpecR ProUUREPproU (-315 to +1) lacZ] (Nagarajavel et al., 2007) S2101 S544 attB::[SpecR PUV5 bglDRE-NT lacZ] (Dole et al., 2004a) S2103 S1075 attB::[SpecR PUV5 bglDRE-NT lacZ] (Dole et al., 2004a) S2106 N3431 lacZ43(Fs), rne-3071(ts), relA1, spoT1, thi-1 CGSC#6975
S2137 S541 attB::[specR PUV5 proV´DRE lacZ] (Nagarajavel et al., 2007) S2142 S2103mut2 dnaK::cat (Madhusudan et al., 2005) S2226 N3433 lacZ43(Fs), relA1, spoT1, thi-1 CGSC# 6976
S2501 S541 attB::[SpecR proUURE PproU proV´DRE(-315 to +303) (Nagarajavel et al., 2007) lacZ]
S2608 S541 attB::[SpecR proUURE PproU proV´DRE(-315 to +303) x pKEM20 φ lacZ]
S2670 S1564 dnaK::cat (Madhusudan et al., 2005)
S2674 S1213 dnaK::cat (Madhusudan et al., 2005)
S2680 S1553 attB:: [SpecR bglURE Pbgl +25 lacZ] (Madhusudan et al., 2005)
S2710 S2681 dnaK::cat (Madhusudan et al., 2005)
S2712 S1196 dnaK::cat (Madhusudan et al., 2005)
S2888 S1196, pA1/lacO-1 dnaKJ, lacIq (Madhusudan et al., 2005) S2904 S1213, pA1/lacO-1 dnaKJ, lacIq (Madhusudan et al., 2005)
S2977 S2501 hfq1::omega1(Kan) x T7 (S812)
S2979 S2608 hfq1::omega1(Kan) x T7 (S812)
S3010 S541 Δhns::kanKD4 (Nagarajavel et al., 2007)
S3066 S541 ΔproU::KD3cm xS665/S672,pKD4
S3077 S541 ΔproU::KD3frt S3066xpCP20
S3122 S1906 Δhns::kanKD4 (Nagarajavel et al., 2007)
S3124 S2048 Δhns::kanKD4 (Nagarajavel et al., 2007)
Experimental Procedures
20 Table 2: E.coli K-12 strains used in This Study
Strain Relevant genotype or structure
aSource
S3126 S2137 Δhns::kanKD4 (Nagarajavel et al., 2007)
S3128 S2501 Δhns::kanKD4 (Nagarajavel et al., 2007)
S3130 S2608 Δhns::KD4kan x S665/S672,pKD4
S3181 S541 attB::[SpecR bglUREPbgl t1RAT bglDRE lacZ] (Nagarajavel et al., 2007)
S3203 S3181 Δhns::kanKD4 x S665/S672,pKD4
S3207 S1195 Δhns::kanKD4 x S665/S672,pKD4
S3209 S1816 Δhns::kanKD4 x S665/S672,pKD4
S3211 S1193 Δhns::kanKD4 x S665/S672,pKD4
S3252 S541 attB::[SpecR PlacUV5-(proU(+1to+303) φlacZ] x pKEM61
S3296 S1213 Δhns::kanKD4 (Nagarajavel et al., 2007)
S3299 S2285 Δhns::kanKD4 x S665/S672,pKD4
S3324 S3252 Δhns::KD4kan x S665/S672,pKD4
S3346 S541 Δhns::Kan KD4FRT (Nagarajavel et al., 2007)
S3352 S2137 hfq1::omega (KanR) x T7 (S812)
S3354 S3252 hfq1::omega (KanR) x T7 (S812)
S3412 S541 attB::[SpecR bglUREPUV5+25 lacZ] (Nagarajavel et al., 2007)
S3420 S3412 Δhns::kanKD4 x S665/S672,pKD4
S3460 S2226 ΔproU::KD3cm x T7 (S3066)
S3462 S2106 ΔproU::KD3cm x T7 (S3066)
S3464 S3346 ΔproU::KD3cm x T7 (S3066)
S3466 S3077 hfq1::omega (KanR) x T7 (S812)
S3701 IBPC633=N3433 rnc105 nadB51::Tn10 (tet) (Regnier et al., 1991) S3769 N3431 rnc105 nadB51::Tn10 (tet) xT7 (S3701)
a: The relevant genotype of the strains (which are all CSH50 derivatives (Miller, 1972)) refers to the bgl, lac, hns and proU loci. CGSC#6106 and CGSC#7462 were strains obtained from E.coli genetic stock center (maintained by Molecular, Cellular and Development Biology Department, Yale University, New Haven, Connecticut). For other abbreviations, see Table I.
b: Construction of strains by transduction using T4GT7 is explained below. Integration of plasmids into the attB site of chromosome was done as described (Diederich et al., 1992) (see below). The deletion of hns allele was constructed according to (Datsenko and Wanner, 2000) and is explained in detail below.
Δhns::kanKD4 refers to the replacement of the chromosomal hns gene by a kanamycin resistance gene cassette, which was amplified from plasmid pKD4.