Estimation of regional-scale wind and gust speeds for Europe by statistical-dynamical downscaling
I n a u g u r a l - D i s s e r t a t i o n zur
Erlangung des Doktorgrades
der Mathematisch-Naturwissenschaftlichen Fakultät der Universität zu Köln
vorgelegt von
Rabea Haas aus Iserlohn
Hamburg, 2015
Berichterstatter: Prof. Dr. Michael Kerschgens Prof. Dr. Andreas Fink
Tag der mündlichen Prüfung: 10. Juni 2014
Contents
Abstract iii
Zusammenfassung v
1 Introduction 1
1.1 Motivation . . . . 1
1.2 Meteorological background . . . . 2
1.3 Analysis of windstorms . . . . 3
1.4 State-of-the-art methodologies . . . . 5 1.5 The statistical-dynamical downscaling model and its application 6
2 Downscaling of windstorms 10
3 Improvement of footprints 20
4 Wind-gust model 42
5 Decadal predictability 46
6 Summary and discussion 74
7 References 81
8 List of Abbreviations 85
Danksagung I
Beiträge zu den Publikationen II
Erklärung III
ii
Abstract
The winter season 2013 / 14 has shown once again that mid-latitude wind- storms have a strong impact on Europe in terms of potential damages and insured losses caused by gusts or indirectly by storm surges. To analyze windstorm occurrences and associated footprints, data sets or simulations are necessary, which have a high temporal and spatial resolution, cover real- ity as best as possible, and are able to predict wind or gust speeds for future climate conditions. In order to meet these requirements, this study combines data from General Circulation Models (GCMs), reanalyses, Regional Climate Models (RCMs), and observations with respect to the individual advantages.
The first part relates large-scale reanalysis wind speeds and regional gust speeds simulated with the COSMO-CLM RCM by multiple linear regression models. These models are trained with a sample of 100 historical windstorms, which had a large influence on European onshore areas. By applying the obtained transfer functions to other large-scale data (GCM simulations), this kind of statistical-dynamical downscaling enables to estimate high-resolution gust speed footprints for Europe in a computationally cost-efficient way. A validation against observations of German weather stations shows that both the results for the combined downscaling approach and for pure dynamical downscaling with an RCM are in congruence with measurements and have similar deviations. The deviations from observations are caused by model biases due to local effects, which cannot be parameterized by the RCM. Thus, the second part aims at adjusting RCM simulations to observations. For this purpose, wind observations of 173 selected test sites and gust observations of 111 selected test sites of the German Weather Service as well as COSMO- CLM simulations are fitted by Weibull distributions. The observation-based distribution parameters are interpolated to the RCM grid, where they are related to the parameters of the simulations by probability mapping. This enables to correct the simulations while retaining the regular grid. Validation with grid points and nearby test sites shows an improvement of about 84 % and 64 % of the sites for wind and gust, respectively. Averaged over all test sites, for wind, 99 of the 100 selected events are improved in terms of more realistic simulations, and 88 events are improved for gusts.
In the third part, the introduced statistical-dynamical downscaling is ap- plied to a large ensemble of decadal hindcasts simulated with the earth system model of the Max-Plack-Institue (MPI-ESM-LR, baseline 1). The decadal
iii
ABSTRACT predictability of peak wind speeds over Europe is analyzed using ten different realizations of yearly initialized decades between 1979 and 2010. Compar- ing original COSMO-CLM footprints and statistical-dynamically downscaled footprints of all days within the investigation period with respect to selected quantiles shows that the approach is appropriate for this large ensemble. The methodology is also able to identify periods with enhanced windstorm activ- ity as exemplary shown for the years 1990 - 1993. The validation against uninitialized simulations using skill scores indicates that both the original hindcasts and the downscaled hindcasts are able to predict wind speeds and peak wind speeds for Europe on decadal scales. The performance is best for high quantiles equal or above 75 % and for the first years (1 - 4) after initialization.
It is shown that the combination of the different data sets enables to in- crease the data resolution in a computationally inexpensive way, while small- scale features parameterized by the RCM are still included. This is important for large ensembles like given for decadal hindcasts and predictions. Addi- tionally, the approach has the advantage of estimating peak winds as proxy for gusts, whereas most large-scale data sets only provide wind speeds. For wind speed, it is recommendable to adjust the simulations to observations by quantile mapping. The same technique delivers for gust speeds improvements only in some areas of the German investigation area. In general, adding or omitting parts of the approach introduced here is easy to implement as all techniques are applicable stand-alone and joined together. This enables to use the methodology also for other parameters.
iv
Zusammenfassung
Der Winter 2013 / 14 hat einmal mehr gezeigt, dass Stürme der mittleren Breiten einen großen Einfluss auf Europa haben, da sie durch Böen und indirekt durch Sturmfluten große, teils versicherte, Schäden verursachen.
Zur Untersuchung von Stürmen, ihrem Auftreten und damit verbundenen Wind- und Böensignaturen, sind geeignete Datensätze nötig. Diese sollten eine große zeitliche und räumliche Auflösung haben, die Realität so gut wie möglich widerspiegeln und in der Lage sein, Wind- oder Böengeschwindig- keiten unter zukünftigen Klimabedingungen zu simulieren. Um diesen An- forderungen gerecht zu werden, zeigt diese Arbeit eine Möglichkeit Daten von globalen Klimamodellen, Reanalysen, Regionalmodellen und Beobachtungen unter Berücksichtigung der individuellen Vorteile zu kombinieren.
Der erste Teil setzt Windgeschwindigkeiten aus Reanalysen und Böenge- schwindigkeiten, die mit dem Regionalmodell COSMO-CLM simuliert wur- den, in Beziehung. Dazu werden lineare Regressionsmodelle mit einer Stich- probe von 100 Stürmen, die einen großen Einfluss auf das Europäische Fest- land hatten, trainiert. Die ermittelten Transferfunktionen können anschlie- ßend auf andere großskalige Daten (Klimamodelle) angewandt werden. Durch diese Art der statistisch-dynamischen Regionalisierung ist es möglich, hoch aufgelöste Böensignaturen für Europa mit geringem Rechenaufwand zu schät- zen. Eine Validierung gegenüber Beobachtungen Deutscher Wetterstationen zeigt sowohl für die Ergebnisse des kombinierten Ansatzes als auch für die Ergebnisse der rein dynamische Regionalisierung mit einem Regionalmodell gut Übereinstimmungen mit Messungen und ähnliche Abweichungen. Die Abweichungen zu den Beobachtungen werden dabei durch lokale Effekte verursacht, die nicht durch das Regionalmodell parameterisiert werden kön- nen. Aus diesem Grund zielt der zweite Teil der Arbeit auf die Anpassung von Regionalmodellsimulationen an Beobachtungen. Dafür werden Weibull Ver- teilungen an Windbeobachtungen 173 ausgewählter Stationen, Böenbeobach- tungen 111 ausgewählter Stationen und COSMO-CLM Simulationen ange- passt. Die beobachtungsbasierten Verteilungsparameter werden anschließend auf das Regionalmodellgitter interpoliert, wo sie durch "Probability Map- ping" mit den Parametern der Simulationen verknüpft werden. Dadurch können die Simulationen korrigiert werden, während das regelmäßige Git- ter beibehalten wird. Eine Validierung mit Gitterpunkten und benachbarten Stationen zeigt eine Verbesserung der Simulationen in Richtung der Beobach-
v
ZUSAMMENFASSUNG tungen an 84 % der Stationen für Wind und an 64 % der Stationen für Böen.
Gemittelt über alle Stationen können für Wind 99 der 100 ausgewählten Ereignisse verbessert werden und für Böen 88 Ereignisse.
Im dritten Teil wird die statistisch-dynamische Regionalisierung auf ein großes Ensemble dekadischer "Hindcasts" des Erdsystemmodells des Max- Planck-Institus (MPI-ESM-LR, baseline 1) angewandt. Die dekadische Vor- hersagbarkeit von Spitzenwindgeschwindigkeiten über Europe wird mit Hilfe von zehn unterschiedlichen Realisierungen jährlich initialisierter Dakaden zwischen 1979 und 2010 untersucht. Vergleicht man ausgewählte Quantile der originalen COSMO-CLM Signaturen und der statistisch-dynamisch re- gionalisierten Signaturen, zeigt sich, dass der Ansatz für dieses große En- semble geeignet ist. Die Methode kann außerdem zur Identifizierung von Zeiträumen mit erhöhter Sturmaktivität genutzt werden, wie beispielhaft an den Jahren 1990 - 1993 gezeigt wird. Der Vergleich zu uninitialisierten Simulationen liefert Qualitätsmaße, die darauf hinweisen, dass sowohl die
"Hindcasts", als auch die regionalisierten Simulationen geeignet sind, um Windgeschwindigkeiten bzw. Spitzenwindgeschwindigkeiten für Europa auf dekadischen Skalen vorherzusagen. Das Ergebnis ist dabei am besten für hohe Quantile größer oder gleich 75 % und für die ersten Jahre (1 - 4) nach der Initialisierung.
Es wurde gezeigt, dass die Kombination der verschiedenen Datensätze dazu führt, dass die Auflösung der Daten ohne großen Rechenaufwand er- höht werden kann, während die durch das Regionalmodell parameterisierten kleinskaligen Eigenschaften erhalten bleiben. Des Weiteren hat die Methodik den Vorteil, dass Spitzenwinde als Näherung von Böen geschätzt werden können, wohingegen die meisten großskaligen Datensätze nur Windgeschwin- digkeiten liefern. Für Windgeschwindigkeiten ist es empfehlenswert, die Simulationen an die Beobachtungen durch "Quantile Mapping" anzupassen.
Für Böen liefert die gleiche Technik nur in machen Gebieten Deutschlands eine Verbesserung. Im Allgemeinen ist es jedoch einfach, einzelne Teile der Methodik hinzuzufügen oder wegzulassen, da alle Techniken sowohl alleine als auch zusammenhängend anwendbar sind. Dies erlaubt auch eine einfache Anpassung für andere Parameter.
vi
1 Introduction
1.1 Motivation
Windstorms are typical weather phenomena affecting Europe, which occur mostly in fall and winter. They are associated to intense low-pressure sys- tems (cyclones) forming over the North Atlantic and propagating eastwards to western Europe. Intense low-pressure systems like Christian in October 2013 and Xaver in December 2013 show that windstorms and related gusts have a strong impact on Europe. With peak gusts of 191 km/h 1 (53 m/s) in coastal areas and 168 km/h 1 (47 m/s) in the low land, windstorm Christian caused an interruption of transportation and shipping, as well as electric power outages in several countries. Even though the low-pressure system was well predicted, there were 14 fatalities in Europe. Windstorm Xaver had similar gust speeds, but a comparatively broad wind signature. Especially the German coast was affected by a storm tide, but due to early warnings, damage could be minimized with appropriate flood protection measures. The windstorm season of the winter 2013 / 14 was particularly distinct, as several windstorms, partly grouped to cyclone families, show along with the October event Christian and the December event Xaver. Around Christmas 2013, the cyclones Christian, Dirk and Erich brought intense squalls to Europe. In the first days of January 2014, Europe was hit again by a windstorm series consisting of Anne, Christina, Dagmar, and Elfride II. The later windstorms, like Petra, Qumaira, Ruth, and Tini during the first half of February caused severe damages particularly by storm surges at the British Isles. Similarly pronounced windstorm seasons affected Europe also during the 1990s. For this decade, the years 1990, 1993, and 1999 were particularly outstanding.
Also the cyclones Kyrill and Xynthia of the years 2007 and 2010 showed that windstorms are one of the most important and devastating natural hazards affecting Europe. Such severe windstorm events do not only affect the social sector, but also economics, e. g. in terms of insurance claims. In order to in- vestigate how far the occurrence of these extreme events and series of intense windstorms is influenced by climate change, it is fundamental to analyze
1
Peak gusts from: www.unwetterzentrale.de/uwz/819.html
1
INTRODUCTION impacts of windstorms under current and future climate conditions. This involves sufficiently large ensembles of reliable high-resolution predictions of wind and gust speeds. For this purpose, techniques are needed, which de- liver high-resolution simulations without producing high computational costs.
The information are needed on different temporal scales to adjust planning strategies concerning climate change adaption. For most sectors, e. g. politics or economy, time frames of about ten years are important to react adequately and thus decadal predictions are in high demand.
In this study, methods are developed to obtain according simulations and predictions. The following introduction will first give a short overview of the meteorological background. Afterwards, demands for the analysis of windstorms are further explained and state-of-the-art methodologies are introduced. The last subsection outlines the structure of the statistical- dynamical downscaling model, potential optimization opportunities, and its applicability for decadal hindcasts. The next chapters include three pub- lished / submitted journal articles and material on additional investigations.
The thesis closes with a summary and conclusions chapter.
1.2 Meteorological background
The atmospheric circulation is an aspect of meteorology, which has been investigated since several centuries (see e. g. Davis, 1899) and is recorded in various textbooks like Schönwiese (1994). The general factors leading to movement of air mass within the atmosphere are compensatory processes.
Due to a positive net radiation at the equator and a negative net radiation at the poles, warm air masses are transported from the equator to the poles and cold air masses are transported from the poles to the equator. This general circulation is influenced by the Coriolis force, which leads to a devi- ation to the right at the Northern Hemisphere (NH) and to the left at the Southern Hemisphere (SH). In reality, several local influencing factors lead to a more complex circulation scheme. Close to the equator, northeast (at the NH) and southeast (at the SH) trade winds, induced by the Hadley cell (Hadley, 1735), flow together in the inner tropical convergence zone. The subtropics are characterized by a zone of high pressure including e. g. the Azores High on the NH. The relatively warm air masses of the subtropics and the relatively cold air masses of the polar regions are separated by the polar front. Corresponding to the Azores High, the Icelandic Low builds a semi-permanent low pressure system within this region of the NH. The polar regions themselves are influenced by thermal induced high pressure systems.
For the genesis of extratropical cyclones leading to intense windstorms over Europe, the predominantly westerly flow over the North Atlantic, in-
2
INTRODUCTION fluenced by location and intensity of the Azores High and Icelandic Low, and baroclinic instability over the Mid-latitudes are important (theory after Charney, 1947). This baroclinic zone is prone to small perturbations caused by changes in the temperature gradient. Such wave disturbances intensify and build frontal systems during the development of a cyclone. Cold air is advected to the south and warm air to the north, building a warm sector be- tween the warm front and the cold front (Bjerknes and Solberg, 1922). In a three-dimensional view, a cyclone is characterized by divergence at the upper levels, rising air masses, and convergence at the surface, leading to decreas- ing pressure and a cyclonic circulation. During its lifetime, the low pressure system propagates eastwards with the general westerly flow and intensifies further until it is occluded. At this stage the pressure is lowest and the cyclone leads to strong wind speeds in particular south of the center where the cyclonic movement is added to the westerly flow. As the westerlies are strongest in fall and winter due to the steeper temperature gradient, severe windstorms mostly occur during these seasons. After the occlusion, the core pressure increases, especially after hitting land. There, the increased friction leads to a larger deviation of the wind and a faster cyclolysis than over the sea (Adamson et al., 2006). Thus, low pressure systems propagating over the North Atlantic to Europe typically disperse after a few days.
An important factor influencing the mean wind speed is friction: the air flow in the boundary layer is, especially next to the ground, characterized by turbulence, which can either be induced by friction or by thermal effects.
The intensity of turbulence is also named gustiness. Gusts are short-time exceedances of the mean wind speed and are often joint with changes in the wind direction. The German Weather Service ("Deutscher Wetterdienst", DWD) defines a gust as exceedance of the 10-minute-mean of wind speed of minimum 5 m/s lasting for 3 to 20 seconds 2 . Wind gusts and peak wind speeds are one of the main factors leading to damages during windstorms.
Therefore several loss models are based on a relationship to gust speeds or maximum wind speeds (Della-Marta et al., 2009; Klawa and Ulbrich, 2003).
1.3 Analysis of windstorms
For the analysis of European windstorms, there are mainly three available groups of data sets: observations, Regional Climate Model (RCM) simu- lations, and General Circulation Model (GCM) simulations. Concerning observations for Germany, the DWD provides a dense network of stations observing wind and gust speeds. These and other measurements deliver the best opportunity to draw an image of reality, at least at the measurement
2
Definition from: www.deutscher-wetterdienst.de/lexikon/index.htm?ID=B&DAT=Boe
3
INTRODUCTION sites. However, the observations are limited in time by the length of the time series and limited in space by the points of observations. This disadvantage appears in particular for gust speeds, for which the density of observations is even lower than for wind speeds. Furthermore, wind and particularly gust speeds are clearly more heterogeneous than other meteorological parameters like temperature. Thus, for area-wide analyses, RCMs, which dynamically downscale the desired parameters, are more appropriate. These models can use boundary conditions e. g. from reanalysis data initialized with obser- vations from different sources. One potential data set is the ERA-Interim reanalysis (Dee et al., 2011) from the European Centre for Medium-Range Weather Forecasts (ECMWF). In order to resolve sub-grid scale processes like gusts, clouds, land surface changes or convection, physical parameterizations can be implemented (e. g. Noilhan and Planton, 1989; Hack, 1994). In recent years, several approaches have been developed to parameterize gust speeds in addition to simulations of wind speed (e. g. Goyette et al., 2003). However, although the model physics are continually improved, there are still model biases, since not all local-scale factors can be covered perfectly. Additionally, the parameterizations and the increased resolution result in high computa- tional costs, so that RCMs are only applicable for selected regions and time periods of interest and not for global investigations or large ensembles. For this purpose, GCMs are a commonly used tool to analyze the climate system and its physical processes on different spatial and temporal scales. They can be used to create simulations representing past, present or future climate conditions. An example is the atmospheric GCM ECHAM6, which is based on the global numerical weather prediction system of the ECMWF and fur- ther developed at the Max Planck Institute for Meteorology in Hamburg (see Stevens et al., 2013, for details). An example for the application of GCMs and quite new field of research is the investigation of decadal predictabil- ity using present climate hindcasts and future climate predictions (Mieruch et al., 2013). A drawback of all GCM simulations is the coarse spatial reso- lution, which allows for a global assessment but does not allow for studies on regional or local scale. In case of windstorms this also means that only wind speeds can be simulated, as local factors influencing gust speeds (e. g. rough- ness length) are typically below the resolved mesh size of the model grid.
One possibility to estimate future climate wind and gust speeds is to use GCM simulations instead of reanalysis data as boundary conditions within RCMs. However, this is only applicable for a small ensemble.
As shown, none of the introduced data sets seems to be the optimal solution for a detailed investigation of windstorms and related wind and gust speeds. Therefore, the question arises, whether there is an opportunity to take the best attributes of each dataset and to minimize the disadvantages.
The resulting aim of this study is to develop, validate and apply appropriate techniques to combine wind and/or gust speeds in different resolutions to optimize the prediction of European windstorms and gust speeds.
4
INTRODUCTION
1.4 State-of-the-art methodologies
1.4.1 Downscaling and model output statistics
Several different methods for the downscaling and post processing of cli- matological data have been developed (Maraun et al., 2010, for review).
Amongst European research institutions, the RCM of the Consortium for Small-scale MOdelling in CLimate Mode (COSMO-CLM, hereafter CCLM, Rockel et al., 2008) is commonly used for downscaling. The model is designed for different time scales and spatial resolutions of 1 km to 50 km. Beside dy- namical downscaling by an RCM like the CCLM, statistical downscaling techniques relating large-scale predictors, such as GCM data or reanalyses, and local-scale predictands exist (Wilby et al., 2004, for review). The three main groups of statistical downscaling are weather classification, regression models, and weather generators, which can be used stand-alone or in com- bination.Compared to dynamical downscaling, the computational costs can be considerably reduced by these methods. In order to maintain the ad- vantages of dynamical downscaling like gust parameterizations, combined statistical-dynamical approaches have been developed (e. g. Boé et al., 2006;
Fuentes and Heimann, 2000). However, dynamical as well as statistical and statistical-dynamical downscaling techniques have weaknesses in producing realistic wind and gust estimations, in particular for complex terrain. Hence, the downscaling results should be post processed to bring them closer to observations. For this purpose, the perfect prog approach and Model Out- put Statistics (MOS) have been developed (Klein and Glahn, 1974). For the former, observed predictors and predictands are related; for the latter, ob- servations are connected with simulations. The resulting transfer functions of both approaches can be applied on model output. However, most perfect prog and MOS approaches deliver corrected values only at specific locations and not on a regular grid.
1.4.2 Decadal predictions
The analysis of decadal predictability is one potential field of application of GCMs. Hindcasts and predictions should be able to reproduce natural and anthropogenic variability. Several coupled ocean atmosphere models and earth system models have been compared within the Coupled Model Inter- comparison Project Phase 5 (CMIP5), stating that the results are promising for surface temperature, sea surface temperature and circulation patterns, especially over the North Atlantic (Taylor et al., 2012). For other param- eters like precipitation it is found that there is still potential for improve- ment. A current European project is MiKlip ("Mittelfristige Klimaprogno-
5
INTRODUCTION sen", decadal predictions), where the goal is to build a model system for different parameters, which is suitable for decadal climate predictions on the large scale and also on the regional scale (Mieruch et al., 2013). Within this project, simulations of the Earth System Model of the Max-Planck-Institute (MPI-ESM) including the Ocean Model MPIOM and the atmospheric model ECHAM6 are investigated. The simulations consist of different realizations of yearly initialized decades between 1960 and 2011. So far, two systems are are available, baseline0 and baseline1, which differ mainly in the number of en- semble members (three against ten realizations) and the initialization (ocean against combined ocean atmosphere initialization). PRODEF (PRObabilistic DEcadal Forecast for central and western Europe) is one of the subprojects that aim at increasing the spatial resolution of decadal hindcasts and predic- tions by regionalization. The analysis of wind and gust speeds in terms of energy supply and windstorm impacts is one of the foci of PRODEF.
Up to a few years ago, studies dealing with wind and / or gusts and pro- viding Europe-wide high-resolution products are limited. This work thus offers an important contribution of research and fills the gap between dif- ferent scales. On the one hand, the spatial resolution can be increased by a statistical-dynamical downscaling model; on the other hand, the applicability for large ensemble e. g. on decadal scales is given.
1.5 The statistical-dynamical downscaling model and its application
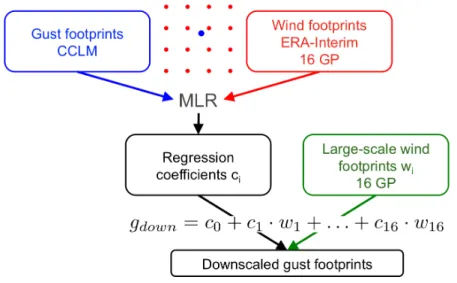
The methodologies illustrated in Section 1.4 are adopted and adjusted in or- der to combine the advantages of different wind and gust data sets. First, a statistical-dynamical downscaling approach is developed. For this purpose, gust footprints simulated with an RCM on a high-resolution grid are related to large-scale wind speeds of a reanalysis data set by transfer functions. Here, the CCLM is used as RCM (marked in blue in Figure 1.1). For each CCLM grid point, the surrounding 16 ERA-Interim reanalysis wind speeds are con- sidered as large-scale predictors (marked in red in Figure 1.1). By Multiple Linear Regression (MLR) the 16 grid points are weighted with regression coefficients. Once calculated, these regression coefficients can be (re-)applied on large-scale data like GCMs (marked in green in Figure 1.1), which need to have the same grid as the ERA-Interim training data set. Therewith, the transfer functions can be validated and new statistical-dynamically down- scaled gust speeds can be estimated. Here, the transfer functions are reap- plied on ERA-Interim reanalysis data to reproduce dynamically downscaled footprints. The reproduced gust values are validated against the original CCLM simulations using Root Mean Squared Errors (RMSEs).
6
INTRODUCTION
Figure 1.1: Schematic chart of the statistical-dynamical downscaling method re- lating large-scale wind speeds and regional-scale gust speeds.
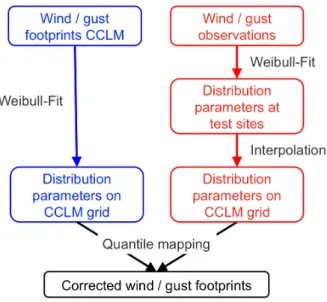
In order to bring the CCLM simulations closer to observations, an ap- proach based on MOS is tested for practicability regarding wind and gust speeds. For this study, the investigation area is reduced to Germany, to ensure consistent measurements with a sufficient spatial and temporal dis- tribution. Here, the observed wind and gust speeds were provided by the DWD. For the methodology, a probabilistic approach has been chosen, i. e.
simulated wind or gust speeds (CCLM; marked in blue in Figure 1.2) and observed wind or gust speeds (marked in red in Figure 1.2) are each fitted by a theoretical distribution - here the Weibull distribution. In order to allow for a comparison of both data sets, the distribution parameters of the obser- vations are interpolated onto the CCLM grid. On this grid, the simulated wind or gust speeds can be corrected by quantile mapping. In contrast, most previous studies only deliver an adjustment of simulations at measurement sites. A potential enlargement of the gust data set is given by a wind-gust model. The idea is to estimate gust speeds from wind speeds considering statistical relations between the distributions of both parameters. The ap- proach is further developed in Seregina (2012) and published in Seregina et al. (2014). Details to the development and the outcomes are presented in a supplementary part of this work (Chapter 4).
7
INTRODUCTION
Figure 1.2: Schematic chart of model output statistics combining observations and regional climate model data.
The last part of this work deals with the application of the statistical- dynamical downscaling approach developed in the first part in order to demonstrate the advantages. For this purpose, decadal hindcasts and pre- dictions of MPI-ESM in its lower resolution of the baseline1 system (MPI- ESM-LR) are investigated. The simulated ensemble members are initialized using different time steps of an assimilation run leading to a large ensemble of daily values from different realizations. For comparison purposes, the same model is used to calculate an uninitialized historical run. By comparing ini- tialized and uninitialized values, RMSE-based skill scores can be calculated to proof the added value of initialization. For regional-scale investigations, both historical runs and hindcasts have to be downscaled. However, this amount of data including daily values between 1960 and 2011 is too large for downscaling with a classical RCM. Hence, the statistical-dynamical ap- proach is perfectly suitable for this aim. Applying the statistical-dynamical downscaling approach involves amongst other things to identify periods with enhanced windstorm activity. Additionally, it delivers the opportunity to calculate skill scores not only for large-scale wind, but also for regional-scale peak winds as an estimation for gust speeds.
The statistical-dynamical downscaling approach developed with 100 se- lected windstorms over Europe and its validation are published in the first scientific paper (Chapter 2). In the second publication (Chapter 3), the rela- tionship between CCLM simulations and measurements is analyzed. Because of different country specific measurement densities and thresholds for storing gust data, the investigation is delimitated to Germany. Chapter 4 contains additional work on the relationship between wind and gusts, resulting in
8
INTRODUCTION a wind-gust model. The third publication (Chapter 5) deals with the ap- plication of the methodology introduced in Chapter 2 on a large ensemble of large-scale simulations to investigate decadal predictability of wind and peak wind speeds. Finally, Chapter 6 gives a summary and discussion of the results.
9
2 Downscaling of windstorms
Published journal article:
Haas, R., and J. G. Pinto (2012), A combined statistical and dynamical ap- proach for downscaling large-scale footprints of European windstorms, Geo- physical Research Letters , 39, L23804, doi:10.1029/2012GL054014.
The permission to reuse the following material in this thesis has been given by a License Agreement between Rabea Haas and John Wiley and Sons pro- vided by Copyright Clearance Center.
License Number: 3342951334966
License date: Mar 06, 2014
Licensed content publisher: John Wiley and Sons
Licensed content publication: Geophysical Research Letters
Licensed content title: A combined statistical and dynamical approach for downscaling large-scale footprints of European windstorms
Licensed copyright line: © 2012. American Geophysical Union. All Rights Reserved.
Licensed content author: R. Haas, J. G. Pinto Licensed content date: Dec 5, 2012
10
A combined statistical and dynamical approach for downscaling large-scale footprints of European windstorms
R. Haas
1and J. G. Pinto
1Received 26 September 2012; revised 31 October 2012; accepted 1 November 2012; published 5 December 2012.
[
1] The occurrence of mid-latitude windstorms is related to strong socio-economic effects. For detailed and reliable regional impact studies, large datasets of high-resolution wind fields are required. In this study, a statistical downscal- ing approach in combination with dynamical downscaling is introduced to derive storm related gust speeds on a high- resolution grid over Europe. Multiple linear regression mod- els are trained using reanalysis data and wind gusts from regional climate model simulations for a sample of 100 top ranking windstorm events. The method is computationally inexpensive and reproduces individual windstorm footprints adequately. Compared to observations, the results for Ger- many are at least as good as pure dynamical downscaling. This new tool can be easily applied to large ensembles of general circulation model simulations and thus contribute to a better understanding of the regional impact of windstorms based on decadal and climate change projections. Citation: Haas, R., and J. G. Pinto (2012), A combined statistical and dynamical approach for downscaling large-scale footprints of European windstorms, Geophys. Res. Lett., 39, L23804, doi:10.1029/2012GL054014.
1. Introduction
[
2] Windstorms are the main natural hazards affecting Europe, with a large impact on the societal and economic sectors [e.g., Fink et al., 2009]. Their occurrence over Western Europe may increase under future climate conditions [e.g., Della-Marta and Pinto, 2009]. Studies quantifying impacts on regional scales [e.g., Della-Marta et al., 2010; Schwierz et al., 2010] typically use a combination of large-scale data like reanalysis datasets or General Circulation Model (GCM) simulations, and Regional Climate Model (RCM) simulations.
The high resolutions of RCMs (typically 10 – 50 km) involve high computational costs. Thus, they only focus on a region of interest and their applicability to multi-model ensembles is limited [cf. Kjellström et al., 2011].
[
3] A computational inexpensive alternative is statistical downscaling, which relates large-scale predictors and local predictands by transfer functions. Different statistical down- scaling techniques have been developed for various atmo- spheric parameters (e.g., Maraun et al. [2010] for a review).
In recent years, some studies also concentrated on the
regionalization of wind data. For example, Bernardin et al.
[2009] applied a system of stochastic differential equations on numerical weather prediction model data for wind refine- ment. A physical-statistical approach was introduced by De Rooy and Kok [2004], decomposing the total error between model and observation into small-scale representation mis- match and large-scale model error. Pryor et al. [2005] focused on wind energy applications and downscaled near-surface wind speed empirically using GCM data. Nevertheless, the research on statistical downscaling is still very limited for wind applications and none of the previous studies focused specif- ically on mid-latitude windstorms.
[
4] The objective of this work is to develop and validate an approach suitable to reproduce dynamical downscaled RCM gust speeds in a cost-efficient way. This is important for building a storm catalog of many thousands of events, required for decadal projections, climate change investiga- tions or insurance applications. We propose a new statistical downscaling tool, which is able to generate gust speeds on a high-resolution grid over Europe by Multiple Linear Regression (MLR) using RCM output for training purposes.
2. Data
2.1. Reanalysis Data
[
5] In this study, ERA-Interim reanalysis data [Dee et al., 2011] from the European Centre for Medium-Range Weather Forecasts (ECMWF) is used as large-scale forcing for both dynamical and statistical downscaling. The dataset has a hori- zontal resolution of T255 (0.75
0.75
) and covers the period from 1989 until the end of 2010. 6-hourly instantaneous wind speeds are used to establish a ranking of historical windstorms (details in Section 3.1.). For each storm, ERA-Interim data with original resolution within the investigation area ( 14.7656
E to 34.4531
E, 32.6315
N to 66.3155
N; Figure S1 in the auxiliary material) is compared to dynamically downscaled high-resolution data.
12.2. Regional Climate Model Data
[
6] The selected historical storms are dynamically down- scaled with the COSMO-CLM (RCM of the COnsortium for Small-scale MOdelling in CLimate Mode, hereafter CCLM [Rockel et al., 2008]). A resolution of 7 km (0.0625
) is reached by two step nesting using ERA-Interim as initial and boundary conditions. Wind gusts are estimated with an approach using friction velocity as a predictor for turbulence [Schulz, 2008]. For more details on RCM validation against
1
Institute for Geophysics and Meteorology, University of Cologne, Cologne, Germany.
Corresponding author: R. Haas, Institute for Geophysics and Meteorology, University of Cologne, Kerpener Str. 13, DE-50937 Cologne, Germany. (rhaas@meteo.uni-koeln.de)
©2012. American Geophysical Union. All Rights Reserved.
0094-8276/12/2012GL054014
1
Auxiliary materials are available in the HTML. doi:10.1029/
2012GL054014.
GEOPHYSICAL RESEARCH LETTERS, VOL. 39, L23804, doi:10.1029/2012GL054014, 2012
L23804 1 of 6
observations and other gust estimation approaches, see Born et al. [2012]. Each simulation consists of at least 4 days.
3. Methods
3.1. Selection of Events
[
7] Several methods have been developed to estimate the potential impact associated with windstorms based on wind or gust speeds [e.g., Klawa and Ulbrich, 2003]. Here, we consider a Meteorological Index (MI) to estimate potential losses, defined as spatially aggregated cubic exceedances of the local 98th gust percentile [see Pinto et al., 2012, equa- tion 3]. This variable is a proxy for the impact of a storm purely associated with its meteorological characteristics, without considering exposure or vulnerability. MI is com- puted over Europe ( 9.8438
E to 34.4531
E; 35.4385
N to 64.912
N; Figure S1), but only for land grid points. The 100 top-ranked days in the ERA-Interim period are derived according to MI (see Table S1). For training and validation of the statistical downscaling approach, events are defined as the storm date plus one day before and after. Several well known historical storms are included [cf. Fink et al., 2009].
Note that some consecutive days may be often attributed to the same storm (e.g., 20070118 and 20070119 for Kyrill).
However, in order to maintain a consistent database on a daily basis, those dates are kept separated. A windstorm footprint (wind signature) for the full extension of a storm like Kyrill can be obtained by considering the maximum gust on both days at each grid point.
3.2. Multiple Linear Regression
[
8] The statistical approach relates CCLM simulations and ERA-Interim data. We estimate a transfer function via MLR.
One regression model is build per CCLM grid point:
y
i¼ c
0þ c
1x
i1þ … þ c
kx
ikþ
ii ¼ 1; …; e k ¼ 1; …; 16 ð1Þ The model includes CCLM daily maximum gust speed (vmax) values as predictands y
i. The event set has been enlarged to a 300-day-list by adding one day before and after each event. Due to consecutive days in the 100-day-list (see Table S1), the 300-day-list includes duplication of calender days. These days have been excluded, thus e = 240. The predictors x
ikconsist of the wind speeds at the 16 ERA- Interim grid points next to the CCLM grid point. The vector of regression coefficients ^ c ¼ c
kcan be estimated by the method of least squares:
^
c ¼ X
TX
1X
Ty ð 2 Þ
with X = matrix of predictors and y = the vector of pre- dictands. This transfer function is here reapplied on reanal- ysis data for cross-validation (see Section 3.3). However, the regression coefficients can be easily applied to other datasets (e.g., GCM).
3.3. Validation
[
9] The effectiveness of the methodology is evaluated by cross-validation. Two distinct validation approaches are performed. First, the ability to reproduce the wind signature of a single storm with a transfer function estimated from the other 99 events (leave-one-out validation) is analysed.
Second, the list is separated into training and validation datasets according to dates and rank of MI. The separation can be performed with sequential (first and second 50 values) or disordered (even and odd entry numbers) lists. For both validation approaches, three-day-signatures are used.
[
10] The root mean squared error (RMSE) and the relative root mean squared error (RMSE
rel) are calculated per event and per grid point as a measure of skill:
RMSE ¼
ffiffiffiffiffiffiffiffiffiffiffiffiffiffiffiffiffiffiffiffiffiffiffiffiffiffi
∑
ni¼1ð ^ x x Þ
2n s
RMSE
rel¼
ffiffiffiffiffiffiffiffiffiffiffiffiffiffiffiffiffiffiffiffi
∑ni¼1ð^xxÞ2
n
q
∑ni¼1x n
ð 3 Þ
with x = dynamically downscaled CCLM gusts and ^ x = statistically downscaled gusts. For RMSE and RMSE
relper event, n = number of grid points. For RMSE and RMSE
relper grid point, n = number of events = 100.
4. Results
[
11] The performance of the statistical downscaling is now compared with dynamical downscaling and forcing ERA- Interim data (Figure 1). The leave-one-out validation of the statistically downscaled wind signatures shows that the method performs best for strong events with a broad wind signature associated with a typical cyclone propagating eastwards over the North and/or Baltic Sea (cf. example of storm Wiebke;
Figure 1a). Larger deviations between dynamical and statistical downscaling are found for uncommon weather situations, e.g., days with multiple footprints (cf. Xynthia; Figure 1d) or foot- prints affecting areas where severe windstorms are unusual (e.g., Southwestern Europe, cf. Martin; Figure 1b). Due to the low number of such events, the MLR model has difficulties to reproduce them adequately. A mismatch also occurs if the CCLM footprints do not follow the ERA-Interim footprints tightly, as our method follows the large-scale input (cf. wind speeds West of Norway for Xynthia; Figure 1d).
[
12] The absolute RMSE per event, i.e., the sum over all grid points, is 2 to 5 ms
1(not shown). Summed over all events, the range is 1 to 6 ms
1at most grid points (Figure 2a). The results are depicted except for the border of the model area, where the CCLM produces spurious values (compare, e.g., Figure 1c at the Northern and Eastern border). The statistical method performs best over most European onshore areas from Portugal to Belarus and results are biased by the number of events affecting each area. To take this into account, the number of events per grid point, where vmax exceeds 20 ms
1(corresponding to 8 Bft, a common threshold used by insurance companies [cf. Klawa and Ulbrich, 2003]) is ana- lyzed (Figure 2b). As a visible relation between the number of events and the absolute RMSE is revealed, a subset of grid points where less than one third of the events (33) reached this threshold is excluded, thus ensuring a reasonable sample size. Further, grid points above 2000 m are excluded to avoid deviations associated with underestimation of the model topography and unrealistic high dynamically down- scaled gusts which are not in congruence with the large-scale forcing. As the absolute RMSE is larger in areas where the gust speeds are generally higher, Figure 2c displays RMSE
relwith excluded grid points shaded in grey. Over those areas the relative errors amount to 20 – 40 %, except over a small area over Southeastern France with up to 70 %. Better results are achieved over the colored area with a 5 – 30 % range.
HAAS AND PINTO: STATISTICAL DOWNSCALING OF WINDSTORMS L23804 L23804
2 of 6
Figure 1. Three-day-signatures of the leave-one-out validation for selected events: (a) Wiebke, (b) Martin, (c) Kyrill, and (d) Xynthia. Dates are labeled as YYYYMMDD. (left) Original CCLM simulated gusts vmax. (middle) Estimated statistically downscaled gusts vmax est. (right) ERA-Interim wind speeds and 6-hourly positions of the associated cyclone tracks, marked as thick lines for the event days and thin lines for following days. UTC is only given for day two of the 3-day-signature.
HAAS AND PINTO: STATISTICAL DOWNSCALING OF WINDSTORMS L23804 L23804
3 of 6
[
13] The 100 events have relative errors of 10 – 20 % aver- aged over the colored area (Figure 2d). These deviations are randomly distributed, which means they are not correlated to MI or rank according to MI (compare colors of bars). A detailed analysis of the wind signatures (Figure 1) indicates that the location of the footprint plays indeed an important role for the skill of the technique. In fact, RMSE
relaveraged over all events and grid points decreases from 16 % to 14 % by the selection of colored areas in Figure 2c.
[
14] A second validation approach is to split the dataset into training and validation period. The periods are separated sequentially by dates (first and second 50 days) or by MI rank (more severe events and less severe events). Additionally, the original dataset is split disordered according to even and odd entry numbers of the dates or of the MI ranks, thus each second value will be used for validation. The results are similar as for the leave-one-out validation: The selection of colored areas (Figure 2c) brings a slight improvement
of about 2 % for both sequential and disordered periods (Table 1). Regarding sequential periods, the difference between choosing higher or lower MIs as training period is marginal. The separation by dates shows slightly better results for the estimation of the earlier period than for the later period. This could be associated with an enhanced number of difficult cases (e.g., uncommon footprints or mul- tiple footprints per event) during this later period.
[
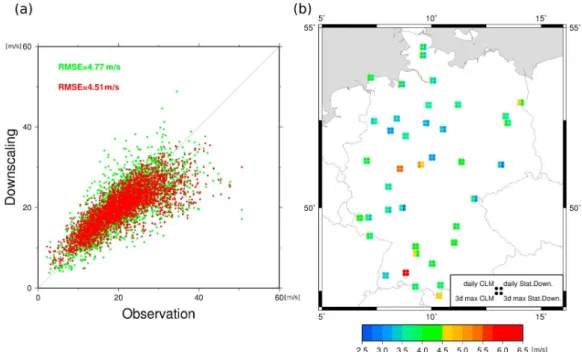
15] Finally, the quality of the results of the statistical downscaling is compared exemplary to those of pure dynamical downscaling against observations in Germany, as here the dataset of measurements is sufficiently large and quality-proofed unlike other countries. 39 test sites are selected according to the best data availability (Table S2). For each test site, the maximum wind gust observation (1-day- or 3-day- maxima) is compared to downscaled gusts at the nearest CCLM grid point. The scattering of the values of both downscaling methods around the optimal diagonal is similar Figure 2. (a) Absolute RMSE of leave-one-out validation summed over events in ms
1. (b) Number of events per grid point with gust speeds greater equal 20 ms
1. (c) Relative RMSE of leave-one-out validation summed over all events in
%. Colored grid points have a model height below 2000 m and are hit by gust speeds greater or equal 20 ms
1on at least 33 of the 100 events. All other grid points are shaded in gray. (d) Relative RMSE of leave-one-out validation summed over the colored grid points in %. Bars are colored according to the rank of MI of each event (red is top rank; blue is low rank).
Dates are given above each bar (YYYYMMDD).
HAAS AND PINTO: STATISTICAL DOWNSCALING OF WINDSTORMS L23804 L23804
4 of 6
(see Figure 3a for 3-day-maxima). In fact, the RMSE is slightly better for the statistical than for the dynamical downscaling (4.30 ms
1vs. 4.51 ms
1). This tendency is also found for the mean deviations summed over all events (Figure 3b). Thus, the results of the statistical approach are at least as good as the original CCLM values. This demonstrates the ability of the statistical downscaling to reproduce reliable gust speeds on a high-resolution grid. As Germany features a wide range of landscapes from lowland coastal areas to high alpine regions, the results are assumed to be representative for other European countries.
5. Summary and Conclusions
[
16] We have introduced and validated a new statistical downscaling tool to derive wind or gust speeds on a small- scale grid over Europe using CCLM simulations as training data. ERA-Interim data and CCLM output of 100 selected windstorm events are related by a MLR model. The cross- validation shows that the statistical MLR model is able to reproduce dynamically downscaled wind signatures well, with relative errors of 10 – 20 % per event, and is thus a cost-efficient alternative. Larger deviations are obtained for
high altitudes [cf. also Bernardin et al., 2009], for events with multiple footprints or events affecting locations rarely hit by windstorms. The windstorms associated with untypi- cal weather situations, which are currently not well captured by the training dataset of dynamical downscaled footprints, could be improved by a larger set of events. Compared to observations, the results of this statistical approach are in Germany at least as good as the dynamical downscaling.
[
17] The proposed combination of statistical and dynami- cal downscaling permits to apply once obtained regression coefficients to large datasets to produce a wide sample of high-resolution wind signatures. This is a clear advantage to pure dynamical downscaling that is limited by its prohib- itive computational costs. On the other hand, the use of dynamical downscaled wind gusts for training the method enables to overcome the obvious handicaps of a purely sta- tistical approach, e.g., regarding the representation of smaller scale effects like flow deviation and channeling due to oro- graphic features. These effects are included here, provided they are represented in the RCM simulations. A better repre- sentation of such effects might be obtained by considering RCM simulations at higher spatial resolution. Compared to other statistical downscaling techniques applied on wind or
Figure 3. (a) Observations of 100 events and 39 test sites against dynamically downscaled values (green) and statistically downscaled values (red). All values are the maxima of three days. For the calculation of the RMSE n = 390, ^ x ¼ observa- tions, and x = downscaled values. (b) RMSE of dynamical downscaling (left points) and statistical downscaling (right points) for daily values (top points) and for 3-day-maxima (bottom points). The errors are calculated as for Figure 3a.
Table 1. RMSE
relin % for Cross-Validation With Training and Validation Periods
aValidation Period Training Period
Sequential All Grid Points
Disordered All Grid Points
Sequential Selected Grid Points
Disordered Selected Grid Points
dates 1 dates 2 16.56 15.66 14.42 13.84
dates 2 dates 1 17.39 16.12 15.67 14.18
MIs 1 MIs 2 16.37 15.95 14.58 14.08
MIs 2 MIs 1 16.90 16.00 14.77 14.08
a
Dates 1 are for the sequential case the first 50 days and dates 2 the 50 later ones. MIs 1 are for the sequential case the more severe events and MIs 2 the less severe ones. Selected grid points have (i) a model height under 2000 m and (ii) gust speeds reaching 20 ms
1on at least on 33 of the 100 events.
HAAS AND PINTO: STATISTICAL DOWNSCALING OF WINDSTORMS L23804 L23804
5 of 6
gusts, this method is quite straightforward to apply on other datasets and model domains.
[
18] The intention of this study was to reproduce the dynamically downscaled wind signatures. Future investiga- tions will focus on model output statistics to calibrate the downscaled wind signatures to observations. The probability distributions of simulations and observations may be related by probability mapping [e.g., Haas and Born, 2011]. This would enable to correct the footprints and apply the approach on pre-adjusted gust speeds.
[
19] Acknowledgments. We thank the ECMWF for the ERA-Interim Reanalysis dataset. This research was supported by the German Federal Ministry of Education and Research (BMBF) under the project Probabilistic Decadal Forecast for Central and Western Europe (MIKLIP-PRODEF, con- tract 01LP1120A). We thank K. Born and P. Ludwig for the CCLM runs, and M. K. Karremann for help with windstorm ranking. We also thank two anonymous reviewers for their constructive comments.
[
20] The Editor thanks the two anonymous reviewers for their assis- tance in evaluating this paper.
References
Bernardin, F., M. Bossy, C. Chauvin, P. Drobinski, A. Rousseau, and T. Salameh (2009), Stochastic downscaling method: Application to wind refinement, Stochastic Environ. Res. Risk Assess., 23, 851–859.
Born, K., P. Ludwig, and J. G. Pinto (2012), Wind gust estimation for mid-European winter storms: Towards a probabilistic view, Tellus, Ser. A, 64, 17471, doi:10.3402/tellusa.v64i0.17471.
Dee, D. P., et al. (2011), The ERA-Interim reanalysis: Configuration and performance of the data assimilation system, Q. J. R. Meteorol. Soc., 137, 553–597.
Della-Marta, P. M., and J. G. Pinto (2009), Statistical uncertainty of changes in winter storms over the North Atlantic and Europe in an ensemble of transient climate simulations, Geophys. Res. Lett., 36, L14703, doi:10.1029/2009GL038557.
Della-Marta, P. M., M. A. Liniger, C. Appenzeller, D. N. Bresch, P. Köllner- Heck, and V. Muccione (2010), Improved estimates of the European win- ter windstorm climate and the risk of reinsurance loss using climate model data, J. Appl. Meteorol. Climatol., 49, 2092–2120.
De Rooy, W. C., and K. Kok (2004), A combined physical-statistical approach for the downscaling of model wind speed, Weather Forecast., 19, 485–495.
Fink, A. H., T. Brücher, V. Ermert, A. Krüger, and J. G. Pinto (2009), The European storm Kyrill in January 2007: Synoptic evolution, meteorolog- ical impacts and some considerations with respect to climate change, Nat.
Hazards Earth Syst. Sci., 9, 405–423.
Haas, R., and K. Born (2011), Probabilistic downscaling of precipitation data in a subtropical mountain area: A two-step approach, Nonlinear Pro- cesses Geophys., 18, 223–234.
Kjellström, E., G. Nikulin, U. Hansson, G. Strandberg, and A. Ullerstig (2011), 21st century changes in the European climate: Uncertainties derived from an ensemble of regional climate model simulations, Tellus, Ser. A, 63, 24–40.
Klawa, M., and U. Ulbrich (2003), A model for the estimation of storm losses and the identification of severe winter storms in Germany, Nat.
Hazards Earth Syst. Sci., 3, 725–732.
Maraun, D., et al. (2010), Precipitation downscaling under climate change:
Recent developments to bridge the gap between dynamical models and the end user, Rev. Geophys., 48, RG3003, doi:10.1029/2009RG000314.
Pinto, J. G., M. K. Karremann, K. Born, P. M. Della-Marta, and M. Klawa (2012), Loss potentials associated with European windstorms under future climate conditions, Clim. Res., 54, 1–20.
Pryor, S. C., J. T. Schoof, and R. J. Barthelmie (2005), Empirical downscal- ing of wind speed probability distributions, J. Geophys. Res., 110, D19109, doi:10.1029/2005JD005899.
Rockel, B., A. Will, and A. Hense (2008), The regional climate model COSMO-CLM (CCLM), Meteorol. Z., 17, 347–348.
Schulz, J. P. (2008), Revision of the turbulent gust diagnostics in the COSMO model, COSMO Newsl., 8, 17–22.
Schwierz, C., P. Köllner-Heck, E. Zenklusen Mutter, D. N. Bresch, P.-L.
Vidale, M. Wild, and C. Schär (2010), Modelling European winter wind storm losses in current and future climate, Clim. Change, 101, 485–514.
HAAS AND PINTO: STATISTICAL DOWNSCALING OF WINDSTORMS L23804 L23804
6 of 6
DOWNSCALING OF WINDSTORMS
Supplementary material
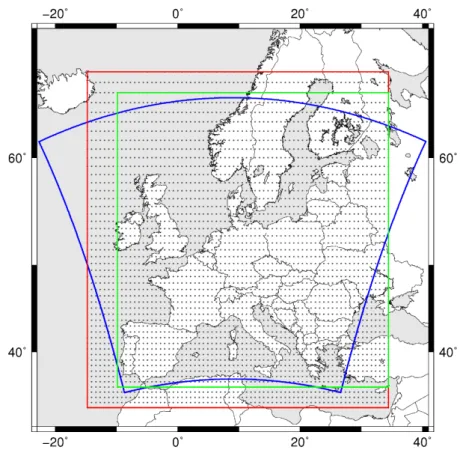
Figure S1: Investigation area. CCLM is simulated with 0.0625 ◦ resolution within blue area; ERA-Interim data is used with 0.7 ◦ resolution for the sta- tistical downscaling within red area, and for MI calculation within green area.
Table S1: 100 Days with highest M I between 1989 and 2010 in chronological order. MI is computed using daily maximum of ERA-Interim surface wind speeds for each grid point. The cubic exceedances of the local 98th percentile are aggregated over land within green area in Figure 1a (-9.8438 ◦ E to 34.4531 ◦ E, 35.4385 ◦ N to 64.912 ◦ N).
Date MI Rank Date MI Rank
19890115 284.1512 43 19990205 448.1312 13 19890129 224.8765 74 19991201 293.425 41 19890215 222.4623 79 19991203 233.2323 64 19890225 414.3149 16 19991204 298.1472 39 19890226 533.812 5 19991225 282.9562 45 19891217 226.6007 70 19991226 376.3548 20 19900125 400.3774 18 19991227 249.6054 56
17
DOWNSCALING OF WINDSTORMS 19900208 352.1099 24 19991228 339.1889 31
19900212 219.3445 87 20000118 219.596 84 19900214 231.6447 65 20000121 225.3398 73 19900226 647.7467 2 20000129 220.7681 81 19900227 812.5004 1 20000130 427.668 14 19900228 468.9158 10 20000131 222.6852 77 19900301 426.4633 15 20000303 279.1825 46 19900306 224.2552 75 20000406 238.1307 60 19900310 264.1957 51 20001030 335.1147 32 19920101 331.9634 34 20001106 211.2333 93 19920117 343.8363 27 20010605 207.2603 99 19920224 256.163 53 20011115 458.3886 11 19920313 292.8794 42 20020129 293.883 40 19920906 326.7523 36 20020222 266.8806 49 19921126 208.9968 95 20020223 216.4567 88 19921202 211.3982 92 20020307 251.2844 54 19921219 241.972 59 20021027 342.3214 29 19930114 310.9885 37 20021028 450.3947 12 19930117 234.2697 62 20040321 348.731 25 19930118 226.3903 71 20041114 219.5183 85 19930122 369.4093 21 20041119 214.6404 90 19930123 363.7773 23 20041222 229.9375 68 19930124 506.141 7 20050108 220.9854 80 19930125 283.432 44 20050109 250.7358 55 19930319 242.7713 58 20050213 231.2205 67 19931209 339.8903 30 20070111 329.6783 35 19931220 220.5499 82 20070112 219.436 86 19940128 411.3488 17 20070118 584.8074 3 19940314 383.7234 19 20070119 491.8994 8 19940324 272.2186 47 20070129 344.4809 26 19940401 258.6016 52 20070320 231.6341 66 19950122 209.8251 94 20070405 235.7918 61 19950123 488.5009 9 20080127 207.3255 98 19950127 227.775 69 20080128 222.4852 78 19950328 302.8398 38 20080131 206.7533 100 19950513 226.0232 72 20080223 211.5456 91 19970225 271.1239 48 20080301 574.3024 4 19970327 246.0028 57 20080302 332.8554 33 19970407 216.0787 89 20080305 208.3307 96 19970411 514.6126 6 20081123 219.6692 83 19981024 223.8985 76 20090124 343.356 28 19981028 366.3806 22 20091013 207.9343 97 19990204 233.9155 63 20100228 264.3112 50
18
DOWNSCALING OF WINDSTORMS
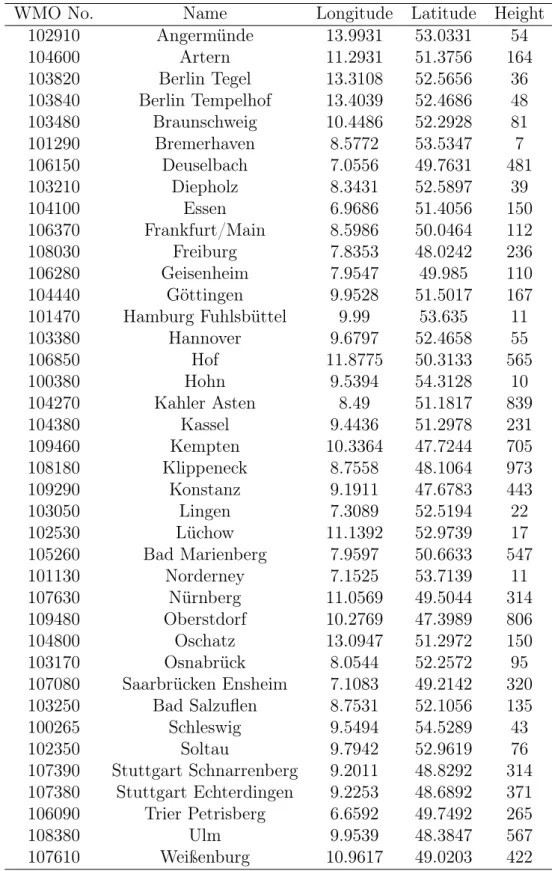
Table S3: 39 test sites in Germany providing three gust observations for all events (day of the highest MI plus one day before and after).
WMO No. Name Longitude Latitude Height
102910 Angermünde 13.9931 53.0331 54
104600 Artern 11.2931 51.3756 164
103820 Berlin Tegel 13.3108 52.5656 36
103840 Berlin Tempelhof 13.4039 52.4686 48
103480 Braunschweig 10.4486 52.2928 81
101290 Bremerhaven 8.5772 53.5347 7
106150 Deuselbach 7.0556 49.7631 481
103210 Diepholz 8.3431 52.5897 39
104100 Essen 6.9686 51.4056 150
106370 Frankfurt/Main 8.5986 50.0464 112
108030 Freiburg 7.8353 48.0242 236
106280 Geisenheim 7.9547 49.985 110
104440 Göttingen 9.9528 51.5017 167
101470 Hamburg Fuhlsbüttel 9.99 53.635 11
103380 Hannover 9.6797 52.4658 55
106850 Hof 11.8775 50.3133 565
100380 Hohn 9.5394 54.3128 10
104270 Kahler Asten 8.49 51.1817 839
104380 Kassel 9.4436 51.2978 231
109460 Kempten 10.3364 47.7244 705
108180 Klippeneck 8.7558 48.1064 973
109290 Konstanz 9.1911 47.6783 443
103050 Lingen 7.3089 52.5194 22
102530 Lüchow 11.1392 52.9739 17
105260 Bad Marienberg 7.9597 50.6633 547
101130 Norderney 7.1525 53.7139 11
107630 Nürnberg 11.0569 49.5044 314
109480 Oberstdorf 10.2769 47.3989 806
104800 Oschatz 13.0947 51.2972 150
103170 Osnabrück 8.0544 52.2572 95
107080 Saarbrücken Ensheim 7.1083 49.2142 320
103250 Bad Salzuflen 8.7531 52.1056 135
100265 Schleswig 9.5494 54.5289 43
102350 Soltau 9.7942 52.9619 76
107390 Stuttgart Schnarrenberg 9.2011 48.8292 314 107380 Stuttgart Echterdingen 9.2253 48.6892 371 106090 Trier Petrisberg 6.6592 49.7492 265
108380 Ulm 9.9539 48.3847 567
107610 Weißenburg 10.9617 49.0203 422
19
3 Improvement of footprints
Published journal article:
Haas, R, J. G. Pinto, and K. Born (2014), Can dynamically downscaled windstorm footprints be improved by observations through a probabilistic ap-
proach? Journal of Geophysical Research , 119, 713–725, doi: 10.1002/2013JD020882.
The permission to reuse the following material in this thesis has been given by a License Agreement between Rabea Haas and John Wiley and Sons pro- vided by Copyright Clearance Center.
License Number: 3342951474198
License date: Mar 06, 2014
Licensed content publisher: John Wiley and Sons
Licensed content publication: Journal of Geophysical Research: Atmo- spheres
Licensed content title: Can dynamically downscaled windstorm footprints be improved by observations through a probabilistic approach?
Licensed copyright line: © 2014. American Geophysical Union. All Rights Reserved.
Licensed content author: Rabea Haas, Joaquim G. Pinto, Kai Born Licensed content date: Jan 31, 2014
20
Can dynamically downscaled windstorm footprints be improved by observations through
a probabilistic approach?
Rabea Haas
1, Joaquim G. Pinto
1,2, and Kai Born
1,31
Institute for Geophysics and Meteorology, University of Cologne, Cologne, Germany,
2Department of Meteorology, University of Reading, Reading, UK,
3TÜV Rheinland Energie und Umwelt GmbH, Cologne, Germany
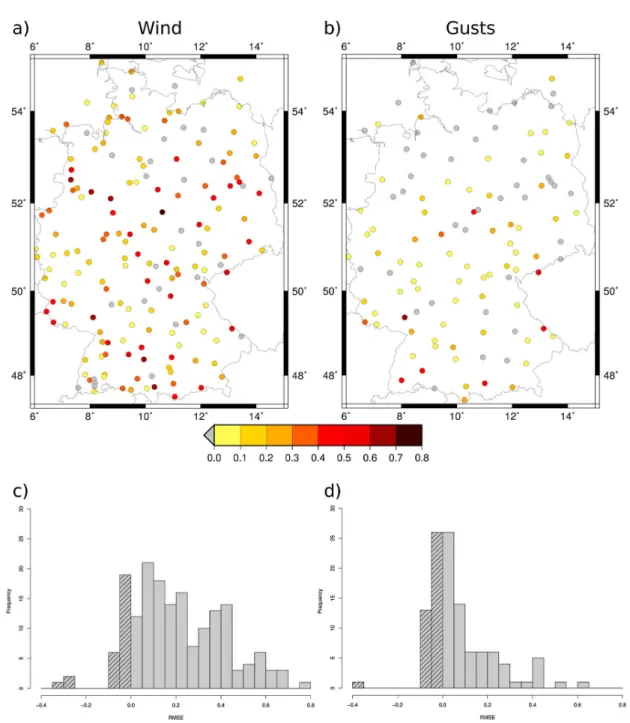
Abstract Windstorms are a main feature of the European climate and exert strong socioeconomic impacts. Large effort has been made in developing and enhancing models to simulate the intensification of windstorms, resulting footprints, and associated impacts. Simulated wind or gust speeds usually differ from observations, as regional climate models have biases and cannot capture all local effects. An approach to adjust regional climate model (RCM) simulations of wind and wind gust toward observations is introduced.
For this purpose, 100 windstorms are selected and observations of 173 (111) test sites of the German Weather Service are considered for wind (gust) speed. Theoretical Weibull distributions are fi tted to observed and simulated wind and gust speeds, and the distribution parameters of the observations are interpolated onto the RCM computational grid. A probability mapping approach is applied to relate the distributions and to correct the modeled footprints. The results are not only achieved for single test sites but for an area-wide regular grid. The approach is validated using root-mean-square errors on event and site basis, documenting that the method is generally able to adjust the RCM output toward observations. For gust speeds, an improvement on 88 of 100 events and at about 64% of the test sites is reached. For wind, 99 of 100 improved events and ~84% improved sites can be obtained. This gives con fi dence on the potential of the introduced approach for many applications, in particular those considering wind data.
1. Introduction
In recent decades, global circulation models (GCMs) have become commonly used tools to understand physical processes in the climate system [e.g., Meehl et al., 2007]. They allow for an assessment of possible representations of past, present, and future climate conditions for different spatial scales and a wide range of temporal scales. However, due to their comparatively coarse resolution, GCMs show de fi ciencies in representing regional and local climate conditions adequately. To overcome this shortcoming, several downscaling techniques have been developed, which can be roughly grouped into dynamical and statistical methods, or a combination of both (for review see, e.g., Giorgi and Mearns [1991], Hewitson and Crane [1996], Wilby and Wigley [1997], and Maraun et al. [2010]). For statistical downscaling, large-scale variables (predictors) are related to local variables (predictands) via statistical transfer functions [e.g., Wilby et al., 1998; Hanssen-Bauer et al., 2005]. For dynamical downscaling, large-scale reanalyses or GCM data are combined with regional climate models (RCMs) resulting in high-resolution simulations (5–50 km) over a region of interest [Meehl et al., 2007;
Christensen et al., 2007]. Statistical-dynamical downscaling usually combines a weather-typing approach with regional climate model (RCM) modeling [e.g., Fuentes and Heimann, 2000; Pinto et al., 2010]. These techniques can be used both for the purpose of numerical weather prediction and to determine the response of climate change on local- and regional-scale variables.
A large suite of methods has been developed in recent decades, particularly focusing on temperature and precipitation [e.g., Wilby and Wigley, 1997]. Less attention has been paid to other variables like 10 m wind speed and — even less often — to wind gusts, although 10 m wind speed is one of the standard meteorological variables reported by weather stations [World Meteorological Organization, 2008]. Research on wind speeds and wind gusts at regional and local scales has focused, e.g., on the development and enhancement of method- ologies to estimate gust speeds from wind observations [e.g., Wieringa, 1973; Verkaik, 2000; De Rooy and Kok, 2004]. Not only absolute values but also probability distributions of wind speeds can be estimated by empirical downscaling [e.g., Pryor et al., 2005; Pryor and Barthelmie, 2010]. Further, modeling approaches including wind
HAAS ET AL.
©2014. American Geophysical Union. All Rights Reserved.713
PUBLICATIONS
Journal of Geophysical Research: Atmospheres
RESEARCH ARTICLE
10.1002/2013JD020882
Key Points:
•
We introduced an approach to adjust RCM windstorm footprints to observations
•
The method is generally able to enhance the results of dynamical downscaling
•
The application of the approach produces better results for wind than for gusts
Supporting Information:
•
Readme
•
Figure S1
•
Figure S2
•
Figure S3
•
Figure S4
Correspondence to:
R. Haas,
rhaas@meteo.uni-koeln.de
Citation: