Wind speed and wind energy potentials over Europe: Regionalisation, decadal predictability, and long-term future changes
Inaugural-Dissertation zur
Erlangung des Doktorgrades
der Mathematisch-Naturwissenschaftlichen Fakultät der Universität zu Köln
vorgelegt von Julia Mömken
aus Köln
Karlsruhe, 2018
Berichterstatter: Prof. Dr. Joaquim Pinto
Prof. Dr. Yaping Shao
Tag der mündlichen Prüfung: 17. November 2017
Abstract
Abstract
The mitigation of climate change demands a fundamental conversion of our energy system, from a mainly fossil fuel-driven system to one with a higher share of renewable sources. For Europe, wind has emerged as an important renewable energy source with high potential.
However, wind energy production is strongly influenced by weather and climate conditions, and hence subject to day-to-day, seasonal and long-term climate change. The analysis and estimation of the impact of these changes on the future wind energy production is of high importance for the development of an energy system with higher renewable energy content.
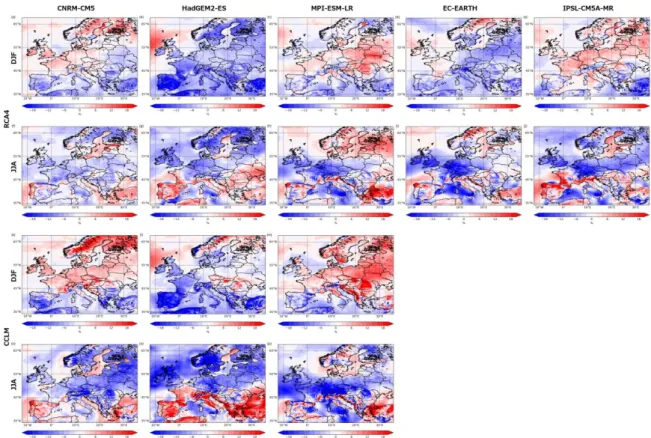
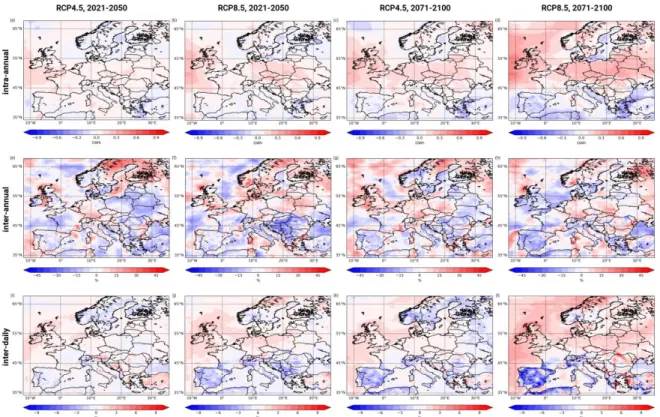
The overall objective of this thesis is to investigate regional scale wind speeds and wind energy potentials over Europe at different timescales, focussing on the near-term and long- term future. With this aim, three studies are performed. The first study estimates future changes of wind energy output ( Eout ) of an exemplary wind turbine over Europe in a large multi-model ensemble. For this purpose, model output from 22 global climate mo- dels (GCMs) from CMIP5 is regionalised using a statistical-dynamical downscaling (SDD) approach. This method is based on a combination of circulation weather type (CWT) anal- ysis and regional climate modelling with COSMO-CLM. Mean annual Eout is projected to increase over Northern and Central Europe and decrease over Southern Europe in the ensemble mean. However, the individual ensemble members can differ both in terms of magnitude and sign of change. Simulated future changes are more robust in seasonal terms, in which Eout generally increases for winter and decreases in summer. These changes lead to an enhancement of the intra-annual variability of Eout for most parts of Europe, which in turn results in a higher volatility of wind energy production under future climate condi- tions. Regarding changes in the inter-annual variability, results for the individual models vary strongly and the spatial patterns are not coherent between future periods and sce- narios. The study clearly reveals an impact of climate change on wind energy potentials over Europe, but in some aspects results depend strongly on the choice of GCM. This highlights the large uncertainties between different GCMs and the importance to analyse multi-model ensembles.
The second study evaluates future changes of regional wind speed and wind energy output
over Europe, this time in a dynamically downscaled ensemble. The high resolution EURO-
CORDEX ensemble is based on nine GCM-RCM chains at 12 km spatial and three-hourly
temporal resolution. The ensemble mean projects a weak decrease of mean annual Eout
for most parts of Europe and a small but robust increase for the Baltic and the Aegean
Abstract
variability, small robust changes are simulated for inter-daily variability, while changes are larger but more uncertain for inter- and intra-annual variability of Eout . Both inter-daily and intra-annual variability are projected to increase for Northern, Central and Eastern Europe. In terms of wind speed characteristics relevant for wind energy production, an increased occurrence of low wind speeds is detected. The study reveals that regions like the Baltic and the Aegean Sea could profit from climate change due to a combination of increasing mean annual Eout and decreasing intra-annual variability. On the other hand, negative impacts are projected for regions like Germany, France and Iberia with decreasing mean Eout and a higher intra-annual variability.
The third study examines the decadal predictability of wind speed and wind energy poten- tials over Central Europe in three generations of the decadal prediction system developed within the German MiKlip (‘Mittelfristige Klimaprognosen’) project. The prediction sys- tem is based on the global Max-Planck-Institute Earth System Model (MPI-ESM). Unini- tialised historical and yearly-initialised hindcast experiments are downscaled applying the same SDD approach as used in the first study to assess the decadal forecast skill. The three ensemble generations show some decadal forecast skill for both mean annual wind speed and Eout . This skill is mainly limited to the first years (1-4) after initialisation. In seasonal terms, skill scores are generally lower than for annual means with lowest values in summer and highest values in autumn. In general, differences between the individual ensemble generations are small. The regionalisation is able to preserve and sometimes increase the forecast skill from the global model, and it often improves the ensemble spread. The study identifies a dominant westerly weather type with strong pressure gradients over Central Europe as potential source for the forecast skill, showing similar MSE-based skill scores as Eout . Overall, results are encouraging for the installation of a decadal prediction system for Central Europe and for the utilization of such a system for wind energy applications.
This thesis extends the current knowledge on wind speed and wind energy potentials over Europe. The outcomes show that climate change affects future wind energy generation at different timescales. Future responses depend on the analysed ensembles, which consider different models and downscaling approaches. Differences arise mainly from the model choice, while the different downscaling methods provide similar climate change signals.
The results proved to be important for an advanced impact study, which analysed climate
change impacts on a European renewable energy system. The results on decadal pre-
dictability are encouraging for the establishment of a decadal prediction system for wind
energy applications. Overall, outcomes of this thesis may be relevant for the successful
Zusammenfassung
Zusammenfassung
Der Klimaschutz erfordert einen grundlegenden Umbau unseres Stromnetzes, von einem vorwiegend mit fossilen Brennstoffen angetriebenen System zu einem System mit höheren Anteilen an erneuerbaren Energien. In Europa hat sich Wind als wichtige und vielverspre- chende erneuerbare Energiequelle erwiesen. Allerdings wird die Windenergieproduktion stark von vorherrschenden Wetter- und Klimabedingungen beeinflusst und unterliegt da- durch dem Klimawandel auf täglichen, saisonalen und langfristigen Zeitskalen. Die Analyse und Abschätzung der Auswirkungen des Klimawandels auf die zukünftige Windenergie- produktion ist somit von großer Bedeutung für die Entwicklung eines Energiesystems mit einem höheren Anteil an erneuerbaren Energien.
Das Ziel dieser Arbeit ist die Untersuchung von Windgeschwindigkeiten und Windenergie- potentialen auf der regionalen Skala für Europa auf verschiedenen Zeitskalen. Der Fo- kus liegt dabei auf der näheren und der langfristigen Zukunft. Mit diesem Ziel wer- den drei Studien durchgeführt. Die erste Studie untersucht zukünftige Änderungen der Windenergieleistung ( Eout ) für eine Beispiel-Windkraftanlage in Europa in einem großen Multimodell-Ensemble. Zu diesem Zweck wurde der Modelloutput von 22 globalen Klima- modellen (GCMs) aus CMIP5 mit einem statistisch-dynamischen Downscaling-Verfahren (SDD) regionalisiert. Dieses Verfahren basiert auf einer Kombination der Analyse von „Cir- culation Weather Types“ (CWTs) und regionaler Klimamodellierung mit COSMO-CLM.
Für den mittleren jährlichen Eout wird im Ensemblemittel eine Zunahme über Nord- und
Mitteleuropa und eine Abnahme über Südeuropa simuliert. Allerdings können sich die
einzelnen Ensemblemitglieder sowohl in der Größenordnung als auch dem Vorzeichen der
Veränderung unterscheiden. Für die einzelnen Jahreszeiten sind die simulierten Änderun-
gen robuster, mit einem generellen Anstieg von Eout im Winter und einer Verminderung
im Sommer. Diese saisonalen Änderungen führen zu einer Verstärkung der intra-annuellen
Variabilität für große Teile von Europa. Daraus resultiert wiederum eine erhöhte Unbe-
ständigkeit der Windenergieproduktion unter künftigen Klimabedingungen. In Bezug auf
Änderungen der inter-annuellen Variabilität variieren die Ergebnisse der einzelnen Modelle
stark und die räumlichen Muster der verschiedenen Zeiträume und Szenarien sind nicht
kohärent. Die Studie zeigt einen deutlichen Einfluss des Klimawandels auf Windenergiepo-
tentiale über Europa. Allerdings hängen die Ergebnisse in mancher Hinsicht stark von der
Wahl der GCMs ab. Dies unterstreicht die Unsicherheiten zwischen verschiedenen GCMs
Zusammenfassung
Die zweite Studie analysiert zukünftige Änderungen der regionalen Windgeschwindigkeit und Windenergieleistung über Europa, diesmal in einem dynamisch regionalisierten Ensem- ble. Das hochaufgelöste EURO-CORDEX Ensemble basiert auf neun GCM-RCM Modell- ketten mit einer Auflösung von 12 km und drei Stunden. Das Ensemblemittel simuliert eine schwache Abnahme des mittleren jährlichen Eout für große Teile Europas und eine schwa- che aber robuste Zunahme für die Ostsee und die Ägäis. Unterschiede zur vorhergehenden Studie beruhen in erster Linie auf der Auswahl der Modelle. In Bezug auf die Variabilität von Eout werden kleine robuste Änderungen für die Variabilität zwischen einzelnen Tagen simuliert, während die Änderungen für die inter- und intra-annuelle Variabilität stärker aber unsicherer sind. Sowohl für die zwischentägliche als auch die intra-annuelle Varia- bilität wird ein Anstieg über Nord-, Mittel- und Osteuropa erwartet. Außerdem ist ein vermehrtes Auftreten von Schwachwindphasen erkennbar. Die Studie zeigt, dass Regionen wie die Ostsee und die Ägäis vom Klimawandel profitieren könnten da der mittlere jährli- che Eout zunimmt und gleichzeitig die intra-annuelle Variabilität schwächer wird. Auf der anderen Seite zeigen sich negative Auswirkungen für Regionen wie Deutschland, Frankreich und die iberische Halbinsel, wo weniger Eout und zeitgleich eine steigende Variabilität si- muliert wird.
Die dritte Studie untersucht die dekadische Vorhersagbarkeit von Windgeschwindigkeit und
Windenergiepotentialen für Mitteleuropa in drei Generationen des dekadischen Vorhersage-
systems, das im Rahmen des deutschen MiKlip-Projekts („Mittelfristige Klimaprognosen“)
entwickelt wurde. Das Vorhersagesystem basiert auf dem globalen Max-Planck-Institute
Earth System Model (MPI-ESM). Das gleiche SDD-Verfahren wie in der ersten Studie wird
genutzt, um nicht-initialisierte historische Läufe und jährlich-initialisierte Hindcast-Läufe
zu regionalisieren und den dekadischen Vorhersage-Skill zu bewerten. Die drei Ensemble-
Generationen zeigen eine dekadische Vorhersagbarkeit für mittlere Windgeschwindigkeiten
und Eout . Diese Vorhersagbarkeit ist im Allgemeinen auf die ersten Jahre nach der Initia-
lisierung (1-4) beschränkt. Für die Jahreszeiten ist der Vorhersage-Skill generell schwächer
ausgeprägt als für jährliche Mittelwerte. Die schwächsten Werte zeigen sich im Sommer
und die höchsten Werte im Herbst. Die Unterschiede zwischen den einzelnen Ensemble-
Generationen sind allgemein klein. Die Regionalisierung ist in der Lage den Vorhersage-
Skill des globalen Modells zu bewahren und in einigen Fällen zu verbessern. Außerdem
wird oftmals der Ensemble-Spread verbessert. In der Studie wird eine dominante westliche
Wetterklasse mit starken Druckgradienten über Mitteleuropa als mögliche Quelle für die
Vorhersagbarkeit identifiziert. Diese Wetterklasse zeigt ähnliche MSE-basierte Skill Scores
Zusammenfassung Vorhersagesystems für Mitteleuropa und dessen Nutzung für Windenergie-Anwendungen.
Diese Arbeit erweitert den momentane Wissensstand zu Windgeschwindigkeit und Wind-
energiepotentialen in Europa. Die Ergebnisse zeigen, dass der Klimawandel die zukünftige
Windenergieproduktion auf verschiedenen Zeitskalen beeinflusst. Die Zukunftsprojektionen
hängen dabei von den betrachteten Ensembles ab, die unterschiedliche Modelle und Regio-
nalisierungsansätze berücksichtigen. Unterschiede ergeben sich überwiegend aus der Wahl
des Modells, während die verschiedenen Regionalisierungsverfahren ähnliche Klimaände-
rungssignale liefern. Die Ergebnisse sind für eine weiterführende Studie von Bedeutung,
die den Einfluss des Klimawandels auf ein europäisches Stromnetz, das zu 100% mit er-
neuerbaren Energien angetrieben wird, untersucht. Die Resultate zur dekadischen Vorher-
sagbarkeit sind vielversprechend für die Etablierung eines dekadischen Vorhersagesystems
für Windenergie-Anwendungen. Insgesamt können die Ergebnisse dieser Arbeit für eine
erfolgreiche Einbindung von Windenergie in unser bestehendes Stromnetz relevant sein.
Contents
Abstract i
Zusammenfassung iii
1 Introduction 1
2 Background 5
2.1 Wind speed and wind energy . . . . 6
2.1.1 Historical and current climate conditions . . . . 7
2.1.2 Future climate conditions . . . . 9
2.2 Decadal climate predictions . . . 11
2.3 Downscaling of global climate model data . . . 13
3 Downscaling for wind energy applications 15 3.1 Dynamical downscaling . . . 15
3.2 Statistical-dynamical downscaling . . . 16 4 Future changes of wind energy potentials over Europe in a large CMIP5
multi-model ensemble 21
5 Future changes of wind speed and wind energy potentials in EURO-
CORDEX ensemble simulations 47
6 Impact of climate change on backup energy and storage needs in wind-
dominated power systems in Europe 75
7 Decadal predictability of regional scale wind speed and wind energy
potentials over Central Europe 79
8 Development and prospects of the regional MiKlip decadal prediction
Contents
9 Summary and discussion 107
9.1 Paper I . . . 108
9.2 Paper II . . . 109
9.3 Paper III . . . 111
9.4 Discussion and outlook . . . 112
10 Appendix 119 10.1 Reyers et al. (2015) . . . 119
10.2 Weber et al. (2018) . . . 137
10.3 Reyers et al. (2017) . . . 169
References 199
List of Abbreviations 211
Danksagung 213
Beiträge zu den Publikationen 215
Erklärung 217
1 Introduction
The IPCC (2013) demands a considerable reduction of greenhouse gas emissions to limit climate change. At present, the energy supply sector accounts for a large amount of global greenhouse gas emissions affecting the earth’s climate (Bruckner et al., 2014). The control and reduction of these emissions through an increased share of renewable and ecologi- cally sustainable energy sources in the global energy mix plays a key role for a successful mitigation of climate change (e.g. Solomon et al., 2007). Still, the transition from a fossil fuel-driven energy system to one with a higher share of renewables remains one of the main challenges for decision makers in politics and economy (Manwell et al., 2009). Although the potential of renewable energies exceeds the energy demand worldwide (Fischedick et al., 2011), individual renewable energy sources are restricted to certain regions due to specific weather and climate conditions. In Europe, wind energy production has a large potential as an alternative to fossil fuel sources, while other sources, like e.g. hydropower are limited in terms of application (Wiser et al., 2011). To tap the full potential of wind energy gener- ation, the successful integration of the highly volatile wind energy into the electric system (von Bremen and Lange, 2011) and the installation of an effective network of wind power plants (Manwell et al., 2009; Wilkes et al., 2012) are of high importance. Additionally, storage and backup facilities are required to maintain electricity supply in times with low wind energy production (e.g. Rodriguez et al., 2014).
Wind energy generation depends on several factors: geographical parameters (e.g. land
use; Vautard et al., 2014), economical and technical parameters (Manwell et al., 2009), as
well as weather and climate conditions (e.g. atmospheric circulation, near-surface wind
conditions; Pryor and Barthelmie, 2010, 2013). Hence, the energy generation is strongly
fluctuating on different timescales, which has a large impact on the operation of the energy
system (e.g. Huber et al., 2014; Bloomfield et al., 2016). Highly resolved forecasts and
predictions of regional and local scale wind speeds and wind energy potentials are required
for the actual state, the near-term future, and the long-term future. Short-term forecasts
Introduction
days in advance, thus allowing to compensate fluctuations and avoiding high losses or ex- cesses (von Bremen and Lange, 2011). These forecasts are also relevant for energy trading.
Near-term forecasts on seasonal to decadal timescales fall within the planning horizon of politics and economy (e.g. Meehl et al., 2009) and are therefore of particular interest for the future development of wind energy production. Finally, climate change projections are important for long-term planning and the analysis of the potential impact of a changing climate on wind energy potentials (e.g. Pryor and Barthelmie, 2010). Several studies over the last decades have shown that both wind speeds and wind energy are sensitive to cli- mate change (e.g. Pryor et al., 2005a,b; Barstad et al., 2012; Hueging et al., 2013; Tobin et al., 2015). These studies use different global and regional climate models (GCMs and RCMs) with different emission scenarios and downscaling techniques focussing on differ- ent parts of Europe. A shortcoming of most of these studies is that they use large-scale parameters and boundary conditions from a limited number of GCMs, often only one, for the regionalisation of the global model output. To account for uncertainties arising from the choice of GCM/RCM, it is advisable to analyse simulations from multi-model ensem- bles. In addition, the projected long-term trends and future changes for wind speed and wind energy are relatively small compared to temperature trends (IPCC, 2012), while the natural variability of wind on inter-annual to decadal timescales is quite large and could thus conceal potential long-term trends.
The idea for this thesis originated within the German MiKlip project (Marotzke et al., 2016)
and from a previous cooperation with the German Climate Service Center (HZG/GERICS,
formerly CSC). Together with GERICS, a prototype database was developed to provide
the wind energy sector and the public with information on wind energy resources for Ger-
many. Special focus was given to potential climate change impacts. To prove beneficial
for user applications, the database should contain data for different future periods and
emission scenarios considering output from different models to take model uncertainties
into account. However, the database currently stores data from a single RCM for the
present and the future climate focussing only on long-term trends. Thus, one aim of this
thesis is to extend the current analyses of regional scale wind speed and wind energy
potentials over Europe for the near-term and the long-term future. Focus is given to dif-
ferent timescales (from sub-daily to multi-year means), different downscaling techniques
(dynamical vs. statistical-dynamical) and different model ensembles. With this aim, a
unique ensemble is created, considering both GCMs and RCMs. The objective of MiKlip
is among others the prediction of potentially user-relevant variables (e.g. wind energy po-
Introduction (near-term future). However, the field of research dealing with decadal climate predictions is still relatively new. So up to now most studies analyse the potential predictive skill of existing decadal prediction systems focussing on global meteorological parameters like temperature and precipitation. For the first time, this thesis analyses the MiKlip decadal prediction system with regard to regional wind energy potentials.
Overall, results from this thesis should help to achieve a better understanding of the poten- tial impact of climate change for the near-term and the long-term future. This is important to adjust planning strategies concerning climate change adaptation, e.g. to meet the Eu- ropean Commission’s aim to produce 14.9% of the European electricity demand from wind energy resources by 2020 (Moccia et al., 2014). In addition, results may be relevant for stakeholders in politics and economy and the planning of a future renewable energy system (e.g. Wohland et al., 2017). Three scientific publications form the basis for the investigation of two main research objectives:
1. Estimation of future changes of wind speed and wind energy potentials over Europe at the regional scale for the middle and the end of the 21
stcentury, considering
a) Future climate projections for two emission scenarios of a large CMIP5 multi- model ensemble (22 GCMs) downscaled with a statistical-dynamical downscal- ing approach (Paper I; Reyers et al., 2016).
b) An ensemble of nine climate simulations with GCM-RCM model chains from EURO-CORDEX (dynamical downscaling of CMIP5) following two emission scenarios (Paper II; Moemken et al., 2018).
2. Analysis of the decadal predictability of wind speed and wind energy potentials over Central Europe in three generations of the MiKlip (‘Mittelfristige Klimaprognosen’) decadal prediction system downscaled with the same statistical-dynamical downscal- ing approach as in Paper I (Paper III; Moemken et al., 2016).
The three publications are linked with each other (see also Figure 9.2, chapter 9), either
through the analysed datasets or through the used downscaling approach (for details see
chapters 2.3 and 3). Paper I provides an overview of the ensemble mean responses to
climate change and quantifies the uncertainties between the individual models in terms of
regional wind energy potentials. Focus is given to changes of mean annual wind energy
output ( Eout ), changes of mean seasonal Eout (including intra-annual variability), and
changes in the inter-annual variability. Paper II investigates future changes of wind energy
potentials at a very high temporal resolution, thus allowing insights on several timescales
Introduction
changes in variability (inter-annual to inter-daily), and changes in the occurrence of wind speeds relevant for wind energy production. The comparison of Papers I and II could provide a better understanding on the impact of different model ensembles and different downscaling techniques on the estimation of future changes of wind energy potentials. Pa- per III examines the decadal predictability of wind energy potentials over Central Europe.
Focus is given to the analysis of decadal forecast skill for different lead times and seasons, and to the estimation of the added value of regionalisation.
Furthermore, the main results from three additional publications are presented, including the development and evaluation of the statistical-dynamical downscaling method for wind energy applications (Reyers et al., 2015) as applied in Papers I and III, the impact of cli- mate change on a wind-dominated European power system (Weber et al., 2018), and the development and prospects of a regional MiKlip decadal prediction system (Reyers et al., 2017).
This thesis is organised as follows. Chapter 2 gives an overview of the meteorological background, including climate conditions for wind speed and wind energy potentials over Europe (2.1), decadal climate predictions (2.2), and the downscaling of global climate model data (2.3). Chapter 3 provides a detailed description of the used downscaling meth- ods for wind energy applications: dynamical downscaling as applied in Paper II (3.1), and statistical-dynamical downscaling (Reyers et al., 2015) as applied in Papers I and III (3.2).
Chapters 4, 5 and 7 supply the relevant publications (Paper I – III), which form the core of
this thesis. Chapter 6 gives an overview of the main results from Weber et al. (2018), while
results from Reyers et al. (2017) are presented in chapter 8. A summary and discussion of
the main findings as well as an outlook of possible future work is given in chapter 9.
2 Background
Compensatory processes are the main drivers for atmospheric circulation. Thus, a bal- anced system would have no circulation in the atmosphere. At the earth, particularly two processes lead to global atmospheric circulation: the uneven heating of the earth- atmosphere-system by solar radiation, and the rotation of the earth (e.g. Kraus, 2004).
The input of solar energy is highest at the equator (positive net radiation), while the earth loses energy at the poles through thermal radiation (negative net radiation). This uneven heating leads to temperature differences across the earth’s surface on all spatial scales (Emeis, 2013). Simplified, warm air rises at the equator and is transported to the poles.
The air is cooled along the way, sinks at the poles and is transported back to the equa- tor. This causes semi-permanent pressure systems at the surface, marked by low-pressure systems at the equator and high-pressure systems at the poles. In upper levels, the distri- bution is vice versa with high-pressure systems at the equator and low-pressure systems at the poles. These distributions lead to a north-south pressure gradient between the warm subtropics and the cold polar regions. In order to compensate these pressure differences, air is transported from areas with high pressure to regions with low pressure. The rotation of the earth modifies this circulation by the Coriolis force leading to a deflection of mov- ing air. Thus, three circulation cells are formed: the Hadley cell, the Ferrel cell and the polar cell. These cells produce mainly meridional winds (e.g. from North to South), while the Coriolis force adds a westerly component to winds towards the poles and an easterly component to winds towards the equator (Emeis, 2013). Besides this global wind system, smaller scale systems develop due to e.g. temperature differences between land and sea or between mountains and valleys.
In addition to the Coriolis force and the pressure gradient force, horizontal winds in the
atmosphere depend on the centrifugal force and the frictional force (due to surface friction
and turbulent viscosity of air). The frictional force can be neglected under idealised con-
ditions outside the planetary boundary layer. A scale analysis shows that the centrifugal
2.1. Wind speed and wind energy
equilibrium of pressure gradient and Coriolis force is described by the so-called geostrophic winds, which flow parallel to the isobars. The wind speed of these geostrophic winds is proportional to the pressure gradient (e.g. Peixoto and Oort, 1992). In reality, the equilib- rium is never achieved, since the sun radiates continuously and the earth stays a rotating system. Therefore there are always winds, which can potentially be used as energy source.
2.1 Wind speed and wind energy
Wind is used as operating power since thousands of years, when humans first started to built sailboats and sailing ships for transportation. Later on, wind powered mills were built to pump water and ground grain. In 1887, the first windmill for the production of electric power was developed (Price, 2005). Finally, the oil crisis during the 1970’s intensified the investigation of non-fossil fuel energy sources (Manwell et al., 2009) and lead among others to the development of wind turbines and a new industry segment. Modern wind power plants generate electric power by using the buoyant force caused by air flowing along the rotors. This generated electricity depends on the size, the efficiency and the location of the wind turbine. Modern wind turbines can convert up to 45% of the wind’s kinetic energy into mechanical energy and thus generate electric power. In Europe, the currently installed wind power capacity (on- and offshore) covers up to 11.4% of the EU’s electricity demand (EWEA, 2016). In the German power system, the share of wind energy is 12.3%
( www.strom-report.de , 2017). By 2020, the European Commission aims at producing 14.9%
of the European electricity demand from wind energy resources (Moccia et al., 2014).
Like any other energy source, the use of wind energy has advantages and disadvantages.
Wind is practically available worldwide without any limits since it is formed from solar
radiation and is replenished by it continuously (Emeis, 2013). The transition from solar
radiation to wind energy does not include the carbon cycle except for production, trans-
portation, installation and maintenance of wind power plants (Emeis, 2013), which makes
the generation of energy from wind comparatively low-emission. Modern wind power plants
have a positive ecological balance after approximately two years since their start of oper-
ation. Additionally, wind energy still has a large potential through the expansion of wind
farms both onshore and offshore. The main challenge for the usage of wind as energy
source is its high volatility on different timescales. This can lead to strong fluctuations and
the need for compensation with other energy sources (e.g. Huber et al., 2014; Bloomfield
et al., 2016). In addition, there is currently no direct way to store energy produced by
2.1. Wind speed and wind energy
2.1.1 Historical and current climate conditions
Wind is a highly variable quantity on both spatial and temporal scales. On the spatial scale, the large-scale pressure gradient between the Icelandic Low and the Azores High generates westerly winds over Europe. It is connected to the phase of the North Atlantic Oscillation (NAO). The pressure gradient between land and sea surfaces leads to relatively higher wind speeds along the European coastlines. Additionally, orographic barriers like the Alps or the Scandinavian mountain chain influence the wind at the local scale, leading to e.g. föhn effects (Troen and Petersen, 1989). In temporal terms, wind speeds over Europe vary at different timescales. The diurnal cycle of wind speed is related to the diurnal cycle of the planetary boundary layer (e.g. Stull, 1988) with higher winds around noon and a minimum during night. On seasonal scales, wind speed variability in Western Europe is influenced by the NAO (e.g. Hurrell and van Loon, 1997; Yan et al., 2002; Trigo et al., 2002). This influence is more pronounced during the winter months. The decadal variability of wind speeds over Europe is large (Bett et al., 2013) with up to 30% estimated for historical periods (Petersen et al., 1998).
Several studies investigated wind speeds over Europe in reanalysis data for both 10m-winds and upper-air winds relevant for wind energy production with somewhat inconsistent re- sults. Bett et al. (2013) analysed 140 years of reanalysis data (Compo et al., 2011) finding no clear long-term trend of wind speed over Europe. Bakker et al. (2007) found a small decrease of mean annual geostrophic wind speeds over the Baltic Sea and a small increase for the Mediterranean Sea in the 40-year ERA-40 reanalysis dataset (Uppala et al., 2005).
However, this trend is very small compared to the inter-annual variability. Pryor and Barthelmie (2003) investigated upper-air wind speeds (in 850 hPa) in the NCEP reanal- ysis (Kalnay et al., 1996). They discovered a significantly increasing trend for 1953-1999 over the Baltic region, which seems to be associated with increases in the upper quartile of the wind distribution. Vautard et al. (2010) observed a stilling trend in 10m-wind speeds that is not visible at higher levels. The stilling could be explained by an increase in surface roughness. Regions with pronounced stilling overlap with regions where vegetation has increased over the last 30 years, supporting the assumption that vegetation can have a slowing down effect on 10m-winds.
The potential of wind energy can be described through the wind energy density (WED) and
the wind energy output ( Eout ) of an exemplary wind turbine. WED depends on the air
density and the wind speed (often in 10m), while Eout takes specific wind turbine charac-
teristics (e.g. cut-in and cut-out velocities, rotor diameter) into account. Both parameters
2.1. Wind speed and wind energy
WED and Eout should be available in regions with generally higher wind speeds, e.g. the North Sea, while the wind energy potential should be lower in areas with lower wind speeds (e.g. Southern Europe). This is confirmed by several studies: Troen and Petersen (1989) gave the first detailed overview of potential wind energy sources in Europe in their Euro- pean Wind Atlas, which is based on observational data. The Atlas provides an overview of mean wind speeds and energy densities for several European countries. Large energy sources are depicted for the British Isles, the western coast of Central Europe, the eastern North Atlantic, the North Sea, and the Aegean. Lu et al. (2009) analysed the global wind energy potential for individual countries based on reanalysis data. Inconsistent with Troen and Petersen (1989) and Hueging et al. (2013) they found higher wind energy potentials over land (onshore) than over sea (offshore) for most European countries. Mean annual Eout of 3000 TWh is depicted for Germany, Poland and Norway, while higher Eout (up to 5000 TWh) is depicted for Spain and Great Britain. Hueging et al. (2013) investigated the ability of different regional climate models (RCMs) to simulate the present wind energy indices. With this aim, they used two RCMs (CCLM and REMO), which are driven by a control simulation for the present climate. The simulated annual Eout of a 2.5 MW wind turbine shows a spatial pattern with distinct regional structures and a strong land-sea gradient (Figure 2.1). Highest values of 14000 MWh can be found in the North Atlantic to the northwest of the British Isles, while Eout of 12000 MWh is depicted for the North and Baltic Sea and along the western coast of Europe. Over the European continent, there is a strong north-south gradient with Eout values between 2000 and 8000 MWh. Lowest Eout is found over mountainous regions, where uncertainties due to the representation of orography in the models are highest (Hueging et al., 2013).
Fig. 2.1: Annual Eout of a 2.5 MW wind turbine in 10
3MWh obtained from CCLM-20C (1961-
2000). Source: Hueging et al. (2013), Figure 1e. ©American Meteorological Society. Used with
permission.
2.1. Wind speed and wind energy
2.1.2 Future climate conditions
Several studies indicated an influence of climate change on the atmospheric circulation and the surface pressure systems (e.g. Pryor and Barthelmie, 2010; Hueging et al., 2013).
These changes can also influence the wind distribution and the wind energy potential in future decades (Pryor and Barthelmie, 2010).
Hueging et al. (2013) investigated changes in the mean sea level pressure (MSLP) and the MSLP gradients for the end of the 21
stcentury in a global climate model (GCM) focussing on the different seasons. They discovered a decrease of MSLP in the northern North At- lantic during winter, which is associated with an intensification and displacement of the Icelandic Low. At the same time, MSLP is increasing in the south-eastern North Atlantic and over Southern Europe, resulting in an intensification and eastward shift of the Azores High. This combination causes a larger pressure gradient over the North Atlantic and Europe. Projected changes for summer are weaker, with a decrease (increase) of MSLP over the subtropics and high latitudes (North-western Europe).
Changes in regional scale wind speeds and wind energy potentials over Europe were ad- dressed in several studies over the last years. Most of these studies agree on a small increase of wind energy potentials over Northern Europe and a small decrease over South- ern Europe under future climate conditions. However, there can be differences regarding the magnitude and sometimes the sign of the projected changes. Räisänen et al. (2004) depicted a significant increase of mean wind speeds over Northern Europe, which is in agreement with the MSLP changes discovered by Hueging et al. (2013) and is confirmed by Kjellström et al. (2011). However, the changes can differ strongly between different GCMs and emission scenarios. Bloom et al. (2008) found a strong seasonal dependence of the projected changes. Pryor et al. (2005a) discovered an increase of wind energy density during winter over Northern Europe for 2071-2100. At the same time, future changes can affect the wind distribution in different ways: while mean wind speeds are projected to decrease, the 90
thpercentile is projected to increase (Pryor et al., 2005b). Pryor et al.
(2012) found an increase in the magnitude of wind gusts in Scandinavia and an increasing
intra-annual variability. Again, projected changes are sensitive to the model choice (Pryor
et al., 2005a) due to different initial conditions and model parameterisations (Pryor et al.,
2012). Hueging et al. (2013) analysed changes in the regional-scale wind energy potential
over Europe using high-resolution data of two RCMs (CCLM and REMO, driven by the
same GCM ECHAM). They focussed on changes in wind energy density and wind energy
output of a 2.5 MW wind turbine. The projected changes are related to simulated changes
2.1. Wind speed and wind energy
the North-Atlantic. Hueging et al. (2013) found an increase of mean annual Eout over Northern and North-eastern Europe (Figure 2.2), which is in line with changes in mean wind speeds depicted in Räisänen et al. (2004). At the same time, a decrease is detected
Fig. 2.2: Changes in annual Eout of a 2.5 MW wind turbine in % between the RCM-A1B and RCM-20C for CCLM for all year (g), winter (DJF; i), and summer (JJA; k). Reference periods are 1961-2000 and 2061-2100. Source: Hueging et al. (2013), Figure 3. ©American Meteorological Society. Used with permission.
for Southern Europe except the Aegean region, with highest values for Spain and the Mediterranean Sea. Changes are more pronounced for the different seasons (Figure 2.2):
a significant increase of Eout is simulated for Northern and Central Europe during winter, together with a strong decrease over Southern Europe. Changes for summer are different, with decreasing Eout for large parts of Southern and Central Europe and increases for the Baltic and Aegean regions. The seasonal changes depicted in Hueging et al. (2013) lead to a higher intra-annual variability. Tobin et al. (2016) investigated climate change impacts on the wind power generation in an RCM ensemble conducted within EURO-CORDEX focussing on a European mid-century wind farm scenario. They found that the annual energy yield remains stable throughout the next decades. Nevertheless, changes at the local scale can reach up to 15%.
Additionally, climate change could alter the environmental context for operation, mainte-
nance and design of wind power plants (Pryor and Barthelmie, 2010). For example, wind
extremes can lead to critical loads on wind turbines resulting in more frequent power-downs
or even damages. Several studies found evidence for increasing magnitudes of wind speed
extremes for Northern Europe (e.g. Pryor et al., 2005a; Haugen and Iversen, 2008) and
Central Europe (Leckebusch et al., 2008) in future decades.
2.2. Decadal climate predictions under future climate conditions. This link is of high importance for future wind energy production. However, the demand for forecasts/predictions on timescales from one year up to one decade has strongly increased over the last years, especially in politics and economy (Goddard et al., 2013). These decadal predictions are introduced in the next chapter.
2.2 Decadal climate predictions
Decadal climate predictions focus on short-term climate change and natural climate vari- ability on timescales from one year to one decade (Meehl et al., 2009). These timescales are of high importance for decision makers in ecology, economy, politics and society (Meehl et al., 2009; Chikamoto et al., 2013; Goddard et al., 2013) and thus are of particular interest for the short-term development and planning of wind energy production. One of the main challenges for decadal predictions is the initialisation of the climate system (Meehl et al., 2009). While long-term climate projections depend mostly on the boundary conditions, decadal predictions depend on both realistic initial and boundary conditions (Figure 2.3;
van Oldenborgh et al., 2012) for example from observational data.
Fig. 2.3: Schematic illustration of different forecast/prediction timescales. Adapted from: Meehl et al. (2009).
Additionally, the predictability is prone to model uncertainties and systematic model biases (e.g. used physics or climatology; Chikamoto et al., 2013). The forecast skill of decadal pre- dictions depends on the ability of the employed GCMs to realistically simulate the decadal variability, both in terms of pattern and magnitude (Meehl et al., 2009). Therefore they need to account for internal generated variability as well as variability forced by external processes (e.g. volcanic eruptions).
Within the German consortium MiKlip (‘Mittelfristige Klimaprognosen’, decadal climate
predictions; Marotzke et al., 2016) a model system based on the Max-Planck-Institute
Earth System Model (MPI-ESM) is developed to produce skilful decadal predictions on
global and regional scales. The first generation of this model system contributes to the
2.2. Decadal climate predictions
CMIP5, a set of global coordinated climate model experiments has been made available, comprising simulations for the recent past, decadal simulations and climate change pro- jections. The decadal simulations are divided into two kinds of experiments: hindcasts (initialised forecasts of past cases) and predictions (near future projections starting from current climate conditions). The initial conditions for these runs are taken from assimi- lation runs that use reanalysis data from the past and the present, either ocean-only or ocean-atmosphere. Only observed CO
2values are used as boundary conditions. Some models also consider effects due to volcanic eruptions or changes in the solar activity. En- sembles are generated through an initialisation at different time steps of the assimilation run (usually 1-day-lagged initialisation; e.g. Müller et al., 2012). The hindcast experiments enable the analysis of decadal predictability for different parameters through a compari- son with observations or reanalysis data (e.g. Smith et al., 2007). This is usually realised by calculating skill scores. Simplified, these scores estimate whether the initialisation of the hindcasts improves the decadal predictability compared to a reference simulation (e.g.
Müller et al., 2012; Goddard et al., 2013). Typically, either uninitialised historical runs (for past cases) or the climatology serve as reference. Skill scores are calculated for different lead times (e.g. yr1-4: first to fourth year after initialisation) to quantify how far ahead the initialisation provides predictive skill.
Over the last years, several studies assessed the decadal forecast skill of existing forecast
systems. These systems are based on individual model ensembles (e.g. Müller et al., 2012,
2014; Goddard et al., 2013; Marotzke et al., 2016) or multi-model ensembles (e.g. van Old-
enborgh et al., 2012; Doblas-Reyes et al., 2013; Eade et al., 2014). All of these studies
found some predictive skill, but the results differ strongly for different parameters, regions
and lead times. Importantly, Eade et al. (2014) pointed out that the potential forecast skill
is often underestimated due to a lower predictable component in the models compared to
observations. While focus is given mostly on the global scale and primary meteorological
parameters like temperature (e.g. Smith et al., 2007; Müller et al., 2012) and precipitation
(e.g. van Oldenborgh et al., 2012), only few studies deal with the decadal predictability
at the regional scale and of user-relevant variables. For example, Kruschke et al. (2014)
analysed the forecast skill of decadal predictions conducted within MiKlip for cyclone ac-
tivity over the Northern Hemisphere. For intense cyclones, they found some regions in
the North Atlantic with positive predictive skill. Mieruch et al. (2014) considered dy-
namically downscaled MiKlip hindcasts to evaluate the decadal predictability of seasonal
temperature anomalies and precipitation sums over Europe. While the positive forecast
2.3. Downscaling of global climate model data skill of precipitation sums could be improved by the downscaling. Haas et al. (2016) used a statistical-dynamical downscaling approach to estimate the decadal forecast skill of peak winds in MPI-ESM at the regional scale. Results from their study showed highest skill scores for short lead times (1-4) and upper wind percentiles (75
th-90
th).
Results on both the global and the regional scale are promising for the decadal prediction of different variables. However, the results for the regional prediction systems depend not only on parameters, regions or lead times but also on the downscaling technique applied for regionalisation. The differences between the different downscaling methods and their advantages and disadvantages are described in the next section.
2.3 Downscaling of global climate model data
GCMs are a useful tool for climate change projections and decadal predictions. But for applications to the regional or even the local scale, the resolution of the GCM simulations (typically 100-300 km) is insufficient. Therefore, a downscaling of the global model data is necessary to provide information at a higher resolution. Several methods have been developed and applied in recent years. All downscaling methods belong to one of the following three categories: statistical/empirical downscaling, dynamical downscaling, and statistical-dynamical downscaling (e.g. Hewitson and Crane, 1996; Wilby and Wigley, 1997;
Fuentes and Heimann, 2000; Maraun et al., 2010).
The statistical downscaling (SD) consists of two steps. First, a statistical relationship
between the local climate variable of interest (e.g. temperature or wind speed) and the
large-scale parameter (e.g. MSLP field) is developed based on observational or reanalysis
data. This relationship is applied to the GCM output in the second step to simulate local
climate characteristics. The SD is computationally inexpensive (cost efficient), easy to use,
and can be applied very fast to large GCM ensembles (Wilby et al., 2004). However, the
approach assumes a stationary statistical relationship and does not include sub-grid-scale
processes like e.g. land and sea breeze. Pryor et al. (2005c) used a SD approach to analyse
the impact of climate change on wind speed and wind energy densities over Europe for the
end of the 21
stcentury. The approach includes relative vorticity and MSLP gradients as
large-scale predictors and parameters of the wind speed probability distribution function
(PDF) as predictants. Devis et al. (2013) developed a SD method to downscale GCM
output to the wind speed distribution at the hub height of wind turbines using local-scale
hub height wind speed PDF parameters as predictants and PDF parameters of large-scale
2.3. Downscaling of global climate model data
The dynamical downscaling (DD) is based on the modelling of atmospheric processes at the regional scale. A high-resolution RCM is nested into the coarser resolution GCM using the GCM output as boundary conditions (e.g. Räisänen et al., 2001). The RCM has a physically-based dynamical core, which allows the resolution of synoptic patterns. Different physical parameterisations account for sub-grid-scale-processes like convection, turbulence or radiation (Teixeira et al., 2008). Additionally, the RCM provides information at very high spatial and temporal resolution. However, the DD is computationally very expensive, thus typically only small ensembles can be generated. Accordingly, most studies using DD for climate change studies are restricted to single GCMs and single emission scenarios. For example, Hueging et al. (2013) investigate regional scale changes in wind energy potentials using two RCMs driven with the same GCM for a single emission scenario.
The statistical-dynamical downscaling (SDD) combines the advantages of SD and DD.
SDD approaches are often based on the classification of weather types from large-scale
parameters (e.g. MSLP). In a next step, representatives for each weather type are simulated
with a RCM. The results are analysed statistically, in which the frequency of the individual
weather classes determines the corresponding weights. Pinto et al. (2010) developed a SDD
approach to estimate the impact of winter storms over Western Europe under future climate
conditions. Haas and Pinto (2012) developed a SDD approach to reproduce dynamically
downscaled wind gust speeds in a cost efficient way. A further approach for wind energy
application by Reyers et al. (2015) is described in detail in the next chapter.
3 Downscaling for wind energy applications
In this thesis, two downscaling approaches are considered to analyse wind energy poten- tials on the regional scale over Europe: dynamical downscaling and statistical-dynamical downscaling.
3.1 Dynamical downscaling
Chapters 5 and 6 are based on regional climate projections from the European branch within the CORDEX framework (EURO-CORDEX, http://www.euro-cordex.net ). The CORDEX initiative (WCRP Coordinated Regional Downscaling Experiment; Giorgi et al., 2009) aims at dynamically downscaling the CMIP5 global climate projections to generate multi-model ensembles of regional projections for different regions all over the globe. There- fore several RCMs are nested into different GCMs.
The GCMs provide simulated large-scale atmospheric fields (surface pressure, temperature, humidity) as boundary conditions, and soil moisture, sea surface temperature and sea ice as initial conditions to the RCMs. The RCMs incorporate more complex topography and coastlines, heterogeneous landscapes, and detailed descriptions/parameterisations of phys- ical processes to generate realistic climate information at spatial resolutions of usually 20 to 50 km. However, the quality of the dynamically downscaled data depends on the accu- racy and biases of the GCMs (Seaby et al., 2013).
Within EURO-CORDEX, historical and climate change simulations are provided for ap-
proximately 27°N - 72°N and 22°W - 45°E with a resolution of 12 km (0.11°) and 50 km
(0.44°). More details on e.g. the used GCM-RCM chains can be found in Paper II (chapter
3.2. Statistical-dynamical downscaling
3.2 Statistical-dynamical downscaling
In chapters 4 and 7, a statistical-dynamical downscaling approach is used to regionalise a large GCM ensemble from CMIP5 (chapter 4) and the MiKlip decadal prediction system (chapter 7). The SDD methodology was developed in Mömken (2014) and Reyers et al.
(2015) and is described in the following, according to the two references.
Fig. 3.1: Schematic illustration of the SDD with its four steps. Source: Reyers et al. (2015), Figure 1. ©Royal Meteorological Society. Used with permission.
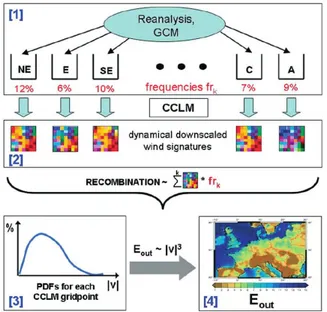
The SDD approach consists of four steps (Figure 3.1). In the first step, the large-scale circulation is analysed and characterised for each day using a weather type classification.
For this purpose, an extended version of the circulation weather type (CWT) method by
Jones et al. (1993) is employed. The CWT method follows the objective Lamb weather
types (Lamb, 1972; Jenkinson and Collinson, 1977) and has been used in a wide range
of studies (e.g. Jones et al., 2012). Daily global MSLP fields interpolated on a regular
2.5° grid are used as input data for the classification. By considering instantaneous MSLP
values at 16 grid points around the central point at 50°N 10°E (Frankfurt, Germany)
the direction and strength of the geostrophic flow and the vorticity are calculated based
on pressure gradients. The near-surface atmospheric flow is then assigned to one of ten
basic CWTs: northeast (NE), east (E), southeast (SE), south (S), southwest (SW), west
(W), northwest (NW), north (N), cyclonic (C), anti-cyclonic (A). Additionally, the mixed
3.2. Statistical-dynamical downscaling wind energy production, the strength of the geostrophic flow is a crucial factor. This strength is described by the f-parameter, which represents the current MSLP gradient at the central point. Depending on the CWT, the f-parameter ranges from values slightly above 0 hPa/1000km (weak gradient) to ca. 45 hPa/1000km (strong gradient). Each of the 11 CWTs is subdivided into classes of f-parameters with 5 hPa/1000km intervals (0-5 to 45-50 hPa/1000km) to capture the complete range of wind speeds within a CWT. This results in a maximum of 110 classes, but only 77 of them are assigned. In addition, the frequency of occurrence for each of these classes is estimated. Figure 3.2 shows exemplarily the climatological MSLP fields for classes W and C, both with a low and a high f-parameter.
Fig. 3.2: Climatological mean of MSLP fields for two exemplary CWTs obtained from ERA- Interim. Source: Reyers et al. (2015), Figure 2. ©Royal Meteorological Society. Used with permission.
In the second step, representative days for each of the 77 classes are simulated with the
RCM COSMO of the German Weather Service (Deutscher Wetterdienst, DWD) in its Cli-
mate Mode (version 4.8, hereafter CCLM; e.g. Rockel et al., 2008). CCLM simulations with
a horizontal resolution of 0.22° are performed using the domain of the EURO-CORDEX
project (roughly 20°N - 70°N and 30°W - 50°E). ERA-Interim data serves as initial and
boundary conditions. For each class, up to ten representative days are selected. The choice
of representatives within a class is random, but data from all four seasons is included if pos-
sible. The ERA-Interim-driven representatives are used for the downscaling of all global
datasets, assuming that the wind characteristics of the individual CWTs are similar in
model and reanalysis.
3.2. Statistical-dynamical downscaling
recombined to wind velocity PDFs at each CCLM grid point. Therefore the occurrence of a given wind speed (in 0.1 m/s intervals) is calculated as the sum of the contributions from all classes weighted by the respective class frequency and the number of representative days.
In the last step, the wind speed PDFs are used to calculate gridded Eout for an exemplary wind turbine. First, the hourly 10m-wind velocities are extrapolated to the average hub height of a wind turbine using a vertical wind profile. This is a standard procedure in wind energy applications (e.g. Manwell et al., 2009; Hueging et al., 2013). Here, the power law is used:
U (z) U (z
r) =
z
z
r α(3.1) where U(z) and U(z
r) are the wind speeds at hub height z and a reference height z
r(usually 10 m). α is the power law exponent, which is set to 0.2 for onshore areas (IEC, 2005a) and 0.14 for offshore sites (IEC, 2005b). The extrapolated wind velocities are used for the computation of Eout , following the characteristics of the exemplary wind turbine:
1. No Eout is produced below the cut-in velocity (around 3 m/s) and above the cut-out velocity (ca. 25 m/s).
2. Between the cut-in velocity and the rated velocity (around 13 m/s), Eout can be determined as:
E
out= c
p1
2 ρπR
2U
3(3.2)
with the power coefficient c
p(0.35), the air density ρ (constant value of 1.225 kg/m
3), the rotor radius R (50m), and the wind speed at hub height U(z) .
3. Between the rated velocity and the cut-out velocity, a constant maximum Eout of 2.5 MW is assumed.
Finally, gridded Eout is calculated by assuming that a wind turbine is placed at every grid point. Spatial distributions of mean annual Eout are obtained by integrating Eout over all wind speed ranges with the respective climatological velocity frequencies as weighting factors. Figure 3.3a shows the spatial distribution of mean annual Eout downscaled from ERA-Interim reanalysis data (climatology for 1979-2010).
The SDD method is easily applicable to different datasets like reanalysis data or climate
3.2. Statistical-dynamical downscaling
Fig. 3.3: (a) Climatological mean of annual Eout in 10
3MWh for ERA-Interim (1979-2010) as obtained by SDD. (b) as (a), but obtained by DD. (c) Difference between annual Eout from SDD and DD in 10
3MWh obtained from ERA-Interim. Adapted from: Reyers et al. (2015), Figure 7.
©Royal Meteorological Society. Used with permission.
to be recalculated. Reyers et al. (2015) used the SDD approach for the regionalisation of three different datasets. For evaluation, they applied the SDD to ERA-Interim reanalysis (Dee et al., 2011) and compared the results to a purely DD method and wind data from the German Weather Service (DWD). The SDD is able to simulate realistic near-surface wind distributions for most stations in Germany with largest discrepancies for coastal stations.
Additionally, the results for simulated Eout show a good agreement between SDD and DD
(Figure 3.3b) for Central Europe and a reduced agreement over areas like the North Sea and
the Mediterranean region (Figure 3.3c). Reyers et al. (2015) also tested the applicability
of SDD to decadal hindcasts from the MiKlip consortium (see section 2.2) and climate
change projections. Regarding the application to decadal hindcasts, a good accordance
between SDD and DD is found for Germany and nearby areas, especially the Benelux
region, Czech Republic and Poland, while correlations to DD are lower for other European
countries (Figure 3.4). In terms of climate change projections, the SDD approach performs
well for the entire European sector. Reyers et al. (2015) concluded that the SDD method
is a suitable and inexpensive alternative to a purely DD approach and that it can easily
be applied to large ensembles of global data.
3.2. Statistical-dynamical downscaling
Fig. 3.4: Correlation per grid point between annual Eout time series simulated by SDD and DD
for four exemplary hindcasts. Grid points with a significant correlation are dotted. Source: Reyers
et al. (2015), Figure 11. ©Royal Meteorological Society. Used with permission.
4 Future changes of wind energy potentials over Europe in a large CMIP5 multi-model ensemble
Reference:
Reyers, M., Moemken, J., and Pinto, J. G. (2016). Future changes of wind energy poten- tials over Europe in a large CMIP5 multi-model ensemble. Int. J. Climatol. , 36:783–796.
doi:10.1002/joc.4382
Permission to reprint:
The permission to reuse the following material in this thesis has been given by a License Agreement between Julia Moemken and John Wiley and Sons provided by Copyright Clearance Center.
License Number : 4377071375978 License date : Jun 27, 2018
Licensed Content Publisher : John Wiley and Sons
Licensed Content Publication : International Journal of Climatology
Licensed Content Title : Future changes of wind energy potentials over Europe in a large CMIP5 multi-model ensemble
Licensed Content Author : Mark Reyers, Julia Moemken, Joaquim G. Pinto Licensed Content Date : Jun 1, 2015
Page numbers are as published in International Journal of Climatology .
INTERNATIONAL JOURNAL OF CLIMATOLOGY Int. J. Climatol. 36: 783–796 (2016)
Published online 1 June 2015 in Wiley Online Library (wileyonlinelibrary.com) DOI: 10.1002/joc.4382
Future changes of wind energy potentials over Europe in a large CMIP5 multi-model ensemble
Mark Reyers, a * Julia Moemken a and Joaquim G. Pinto a,b
a
Institute for Geophysics and Meteorology, University of Cologne, Germany
b
Department of Meteorology, University of Reading, UK
ABSTRACT: A statistical-dynamical downscaling method is used to estimate future changes of wind energy output (Eout) of a benchmark wind turbine across Europe at the regional scale. With this aim, 22 global climate models (GCMs) of the Coupled Model Intercomparison Project Phase 5 (CMIP5) ensemble are considered. The downscaling method uses circulation weather types and regional climate modelling with the COSMO-CLM model. Future projections are computed for two time periods (2021–2060 and 2061–2100) following two scenarios (RCP4.5 and RCP8.5). The CMIP5 ensemble mean response reveals a more likely than not increase of mean annual Eout over Northern and Central Europe and a likely decrease over Southern Europe. There is some uncertainty with respect to the magnitude and the sign of the changes. Higher robustness in future changes is observed for specific seasons. Except from the Mediterranean area, an ensemble mean increase of Eout is simulated for winter and a decreasing for the summer season, resulting in a strong increase of the intra-annual variability for most of Europe. The latter is, in particular, probable during the second half of the 21st century under the RCP8.5 scenario. In general, signals are stronger for 2061–2100 compared to 2021–2060 and for RCP8.5 compared to RCP4.5. Regarding changes of the inter-annual variability of Eout for Central Europe, the future projections strongly vary between individual models and also between future periods and scenarios within single models. This study showed for an ensemble of 22 CMIP5 models that changes in the wind energy potentials over Europe may take place in future decades. However, due to the uncertainties detected in this research, further investigations with multi-model ensembles are needed to provide a better quantification and understanding of the future changes.
KEY WORDS