Policy Research Working Paper 6987
Integrating Border Regions
Connectivity and Competitiveness in South Asia
Massimiliano Calì Thomas Farole Charles Kunaka Swarnim Waglé
Trade and Competitiveness Global Practice Group July 2014
WPS6987
Public Disclosure Authorized Public Disclosure Authorized Public Disclosure Authorized Public Disclosure Authorized
Produced by the Research Support Team
Abstract
The Policy Research Working Paper Series disseminates the findings of work in progress to encourage the exchange of ideas about development issues. An objective of the series is to get the findings out quickly, even if the presentations are less than fully polished. The papers carry the names of the authors and should be cited accordingly. The findings, interpretations, and conclusions expressed in this paper are entirely those of the authors. They do not necessarily represent the views of the International Bank for Reconstruction and Development/World Bank and its affiliated organizations, or those of the Executive Directors of the World Bank or the governments they represent.
Policy Research Working Paper 6987
This paper is a product of the Trade and Competitiveness Global Practice Group. It is part of a larger effort by the World Bank to provide open access to its research and make a contribution to development policy discussions around the world.
Policy Research Working Papers are also posted on the Web at http://econ.worldbank.org. The authors may be contacted at mcali@worldbank.org, tfarole@worldbank.org and ckunaka@worldbank.org.
Deeper regional integration can be beneficial especially for regions along international borders. It can open up new markets on opposite sides of borders and give consum- ers wider access to cheaper goods. This paper uses data from five contiguous districts of India, Nepal, and Bangla- desh in the northeast of the subcontinent to measure the degrees of trade complementarity between districts. The paper illustrates that the regions are underexploiting the potential of intraregional commerce. Price wedges of up to 90 percent in some important consumption products along with measures of complementarity between house- holds’ production and consumption suggest the potential
for relatively large gains from deeper trade integration.
Furthermore, an examination of a specific supply chain of
tea highlights factors that help industries scale up, aided
by institutions such as an organized auction and decent
physical and legal infrastructure. However, districts alike
in geography but located across international boundar-
ies face different development prospects, suggesting that
gains from reduced “thickness of borders” would not
accrue automatically. Much rests on developing intrinsic
industry competitiveness at home, including the reform
of regulatory and business practices and infrastructural
bottlenecks that prevent agglomeration of local economies.
Integrating Border Regions:
Connectivity and Competitiveness in South Asia *
Massimiliano Calì, Thomas Farole, Charles Kunaka and Swarnim Waglé
†JEL Classification: F13, F15, O18
Keywords: border regions, trade integration, supply chain, tea, South Asia
* Paper prepared for the World Bank South Asia Chief Economist Office. Funding from the Multi-Donor Trust Fund for Trade and Development is gratefully acknowledged. The authors are grateful to Denis Medvedev, Onno Ruhl, Salman Zaidi and Johannes Zutt for useful comments and to Deborah Winkler and Josephine Kibe for excellent research assistance. Thanks also go to Dean Jolliffe and Lea Duarte for the help with the Bangladeshi data and to Siobhan Murray for assistance with the map. The usual disclaimer applies.
† Calì, Farole and Kunaka are with the World Bank’s Trade and Competitiveness Global Practice and Waglé is with Nepal’s National Planning Commission.
2
1. Introduction
In recent years, South Asia has been one of the world’s most economically dynamic regions. But economic growth has been associated with increasing spatial inequality, with metropolitan regions often expanding much more rapidly than peripheral regions. In South Asia, low-income areas often coincide with border regions. In India, for example, the majority of low-income states are border states.
3International evidence shows that border regions often flourish as gateways for cross-border trade.
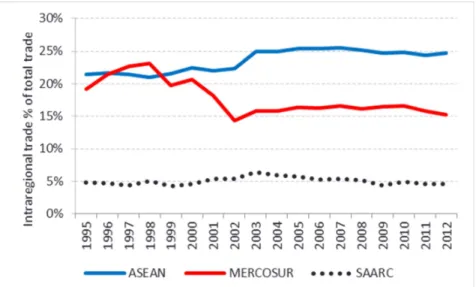
But in South Asia weak regional integration along with often difficult terrain (much of it desertic or mountainous) blocks this crucial source of growth. Figure 1 shows how limited intra-regional trade is in South Asia relative to other developing country trading blocs – just 5% of South Asia’s trade takes place within the region. While the large relative size of India naturally limits the share of intra- regional trade in South Asia (relative to the ASEAN block), this share is also considerably lower than MERCOSUR where Brazil is far larger than the other members. ; In addition in high income regions, trade integration is much more advanced – nearly 50% in NAFTA; above 50% in East Asia; and over 60% in the EU.
Figure 1: Comparison of intra-regional trade shares in South Asia compared to other regions
Source: Author’s calculation based on data from UN Comtrade
Thus, deepening integration in South Asia may contribute not only to driving higher growth overall but also to reducing spatial inequalities. That is especially the case to the extent that this increased integration can improve access to markets and to trading opportunities for the border regions.
Deeper integration may allow firms to expand sales opportunities, deepen specialization, and join regional and international value chains. For farmers, improved market access may allow them to diversify the range of markets to serve and reduce the volatility of the prices of their goods.
Consumers may benefit too from deeper regional integration as it may expand the range of products for consumers at reduced cost, and moderate volatility in prices especially for border regions in South Asia that are typically far from the countries’ main economic centers.
Of course, deepening regional integration alone is not likely to be sufficient to address the challenges of border regions. Taking advantage of these opportunities is also likely to require addressing weaknesses in the regional environment, including infrastructure, firms’ productive
3 See World Bank (2013) for the classification of low income states.
3
capacity, institutions, and the investment climate, that may prevent firms from exploiting the new potential. Moreover, integration also introduces new competition into weakly competitive regional markets, so challenges of adjustment to structural change will also determine the outcomes of deeper integration.
In this context, this study sets out to assess the potential benefits of deeper market integration for border regions in South Asia as well as illustrate some of the bottlenecks that would need to be addressed to enhance integration. In order to do so the study focuses on one of the key border areas in South Asia, i.e. the strip of land bordering Nepal, India and Bangladesh. The area of the study comprises five contiguous districts across the three countries and it is illustrative of some of the challenges underlying the process of market integration in the region.
First we show various indicators which suggest the extent of the potential gains from deeper integration for the districts in each country. We then focus on an important commodity for the area of study, tea (Camellia Sinensis & Assamica), to gather evidence on the structure and nature of value chains in selected cross-border districts in South Asia. This analysis helps understand the scale and scope of current trade, the barriers to deepening integration (including border-specific barriers, as well as barriers caused by market structures and by other factors in the business environment), and the potential scale of benefits that could accrue to firms, farms, and households from deeper integration.
We also find that there exists a considerable degree of complementarity in production and consumption, presenting opportunities for mutually beneficial cross-border trade. The presence of price wedges – of up to 90% -- in similar products suggests that trade can also help narrow cross- national divergences. The paper highlights the importance of factors that help industries scale-up, aided in part by innovative institutions (such as an organized auction) and decent physical and legal infrastructure (such as protection of intellectual property). However, benefits do not seem to spread across national boundaries by default. Districts that are comparable in geography, but located across international borders face quite different development prospects. To optimize gains from the removal of cross-border restrictions, much would still rest on honing intrinsic competitiveness of home industries.
The paper is organized as follows: The next section describes the methodological approach of the study; section 3 provides the socio-economic profile of the case study districts, including also the extent to which they can be considered low-income relatively both to the countries’ and the regional averages; section 4 describes the likely gains from deeper trade integration for border regions in light of existing theory and evidence, illustrating the potential size of these gains for the study regions using measures based on secondary data; section 5 zooms into the tea case study and assesses the organization of the supply chains in each region and tests the degree of spatial integration of tea markets.
2. Methodology
The analysis uses a case study approach. It focuses on two sets of adjoining, cross-border regions –
on the India-Nepal and the India-Bangladesh borders. Table 1 outlines the specific geographical
coverage of the case studies. Specifically, we focus on the geographical area near where all three
borders converge – the northern part of West Bengal state in India (comprising Darjeeling and Uttar
Dinjapur) being the common region (see Map 1).
4 Table 1: Case study locations
Country State/Region District(s)
India- Nepal
India West Bengal Darjeeling
Nepal Mechi Ilam, Jhapa
India- Bangladesh
India West Bengal Uttar Dinajpur
Bangladesh Rangpur Panchagarh
Source: Authors’ elaboration
Map 1: Map of case study regions and districts
Source: Authors’ elaboration
This focus is justified by a number of reasons. First these regions fulfill the criteria of being relatively
remote from the core in each of the three countries, and they share some common production
structures (notably pronounced agricultural specialization, with a large tea production) that allow for
5
useful comparisons across all three countries. In addition, their specific locations are useful for assessing the potential impacts of cross-border integration
4. For example, borders aside, producers in the Jhapa district in Nepal may find it easier to reach markets in Siliguri or even Kolkata in India than they would Kathmandu.
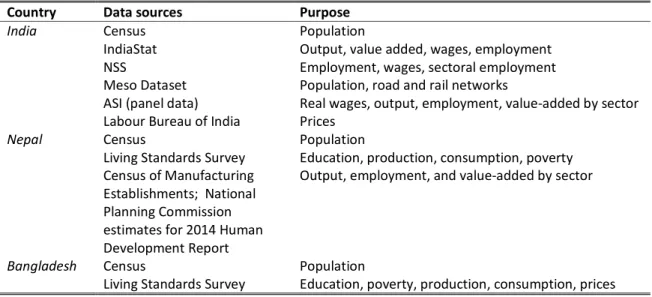
The analysis is composed of two parts. First we carry out desk-based research to profile the case study districts in terms of demography, education and employment outcomes, poverty, economic structures, and infrastructure. Much of this analysis relied on detailed micro-data, including household and labor force surveys, regional economic accounts and industrial census. The main sources for this analysis are summarized in Table 2. Additional data came from national government reports, the state government in West Bengal, the Tea Board of India, FAO and others.
Table 2: Summary of main secondary data sources: India and Nepal
Country Data sources Purpose
India Census Population
IndiaStat Output, value added, wages, employment
NSS Employment, wages, sectoral employment
Meso Dataset Population, road and rail networks
ASI (panel data) Real wages, output, employment, value-added by sector Labour Bureau of India Prices
Nepal Census Population
Living Standards Survey Education, production, consumption, poverty Census of Manufacturing
Establishments; National Planning Commission estimates for 2014 Human Development Report
Output, employment, and value-added by sector
Bangladesh Census Population
Living Standards Survey Education, poverty, production, consumption, prices
We use these data also to assess the extent to which deeper integration could lead to economic gains for the various districts. We use two sets of measures to that end. The first set consists of indices of complementarity in employment as well as in production-consumption between bordering districts. These measures provide some indication of the potential trade that may occur should barriers to trade be lowered. The second type of measures is the price differential in some of the main consumption items across the borders. These differentials are rough proxies for the ‘thickness’
of the borders.
The second part of the analysis focuses specifically on the value chain for tea within and across these regions. This focus is due to several reasons:
• The primary economic activity in all the regions is agriculture – within the agricultural sector, tea is common across all these regions and is one of the most important (but not always the main) cash crops in all of them.
• It is among the most widely traded crops in the region, locally, nationally, and internationally and in fact it is the only major agricultural product that is essentially only traded as its local consumption is negligible relative to production.
4 There are also practical reasons for this approach – the logistics for undertaking the field research is made easier by concentrating on nearby locations across the three countries.
6
• It is a relatively complex value chain and one whose trade tends to be regulated in several ways, making it potentially an interesting example of where and to what extent enhanced integration may promote the development of cross-border value chains.
From a methodological perspective, by focusing on a single commodity we are able to control for product/sector heterogeneity in comparing the dynamics between individual regions across the borders as well as between the regional pairs. For example, it is generally considered that the border between Nepal and India is more open than the border between Bangladesh and India. Therefore, by identifying the differences in how tea is traded in the different border areas (of course, confirming first and specifying the scale and nature of border barriers in each regional pair), we are more likely to be able to link outcomes with border effects.
The case studies are based primarily on field research, complemented with desk-based analysis of secondary data. The field research focused on implementing a detailed survey (with more than 100 discrete questions) designed to capture the structure, trading processes, and challenges facing participants in the tea value chain, covering growers, traders, processors, and other participants in the value chain. In total, some 150 individual interviews were completed (30 in Bangladesh, 61 in India; 59 in Nepal) during the period from April 11 to May 5, 2013. These interviews were complemented by semi-structured interviews with 20-30 stakeholders in each region, including growers, traders, and processors, as well as transporters, customs officials, and other government and industry representatives.
3. Profile of targeted districts
Location and demography
The Darjeeling district, at the foothills of Mt. Kanchanjanga, the third highest mountain in the world, with a geographical area of 3,149 square km, shares its international boundaries with Nepal, Bhutan and Bangladesh and state boundaries with Sikkim and Bihar. There are four subdivisions of Darjeeling district: Darjeeling, Kalimpong, Kurseong and Siliguri. The district has two different topographic characteristics: the plains (Terai) and the hills, which also correspond to the two different types of tea produced in the region.
Jhapa and Ilam belong to Mechi zone of eastern Nepal, covering an area of 1,606 square km and 1,703 square km, respectively. Jhapa district shares its international boundaries with West Bengal (India) to the east and Bihar to the south, and with Nepal’s Morang district to the west and Ilam district to the North. With administrative headquarters at Chandragadi, the district has three municipalities and 47 Village Development Committees (VDCs), all of them lying in the Terai plains.
Ilam district has its boundaries as Panchthar in the North, Morang in the South West, Jhapa in the South and Darjeeling District of India in the East. The district is connected to Charali and the neighboring districts Panchthar and Taplejung in Nepal as well as to Darjeeling via a road from Fikkal through Pashupati Nagar (Government of Nepal, 2011). Ilam covers only mountain terrain lying at 140 meters above sea level. With Ilam bazaar as the district headquarters and only municipality, the district has 48 VDCs.
The entire region is densely populated, yet also highly rural (Table 3). The Indian districts have
densities much higher than their national averages with the density in North Dinajpur almost three
times as large as the whole of India. The district with the lowest population density (as well as
overall population) is Ilam, whose density is in line with that of the Nepalese average. In 2011, Ilam
had about 290,000 residents and Jhapa had about 813,000. The combined population of Jhapa and
Ilam exceeds 1.1 million, which is more than half that of neighboring Darjeeling. The population is
7
overwhelmingly concentrated in rural areas with higher share of rural population than the national average in Bangladesh and India, except in Darjeeling, which is slightly below the national average.
Despite the relatively high density, there are few significant towns – across the districts in the three countries studied, the only settlements with a population above 100,000 are Siliguri and Darjeeling (India).This population distribution is likely to reflect the agricultural nature of the districts. At the same time it is also likely to affect the future economic specialization of the district: the absence of large centers may make it difficult to achieve those economies of agglomeration needed for many non-primary resource based sectors to develop. Thus, these regions are likely to be failing to take advantage of the benefits of agglomeration for growth and development.
Table 3: Population in the districts
2001 2011 2001 2011 2001 2011
Pop ('000) Density (pop/km
2) % rural Area (km
2)
Panchagarh 874 1,026 622 731 91% 90% 1,405
Bangladesh 130,523 144,044 884 976 76% 72% 147,570
Darjeeling 1,609 1,842 511 585 68% 61% 3,149
Uttar Dinajpur 2,442 3,001 777 955 88% 88% 3,142
India 1,027,015 1,210,193 312 368 72% 69% 3,287,263
Ilam 283 290 166 174 n/a n/a 1,703
Jhapa 688 810 428 505 n/a n/a 1,606
Nepal 23,151 26,494 157 181 86% 83% 147,181
Sources: Population census data: Indiastat; Nepal Central Bureau of Statistics; Bangladesh Bureau of Statistics
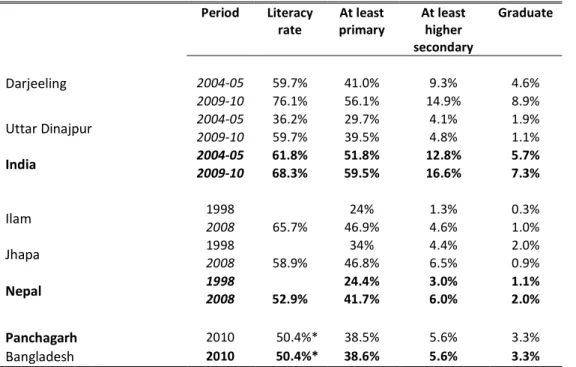
Table 4: The education profile in Indian and Nepalese districts
Period Literacy
rate
At least primary
At least higher secondary
Graduate
Darjeeling
2004-05 59.7% 41.0% 9.3% 4.6%
2009-10 76.1% 56.1% 14.9% 8.9%
Uttar Dinajpur 2004-05 36.2% 29.7% 4.1% 1.9%
2009-10 59.7% 39.5% 4.8% 1.1%
India 2004-05 61.8% 51.8% 12.8% 5.7%
2009-10 68.3% 59.5% 16.6% 7.3%
Ilam 1998 24% 1.3% 0.3%
2008 65.7% 46.9% 4.6% 1.0%
Jhapa 1998 34% 4.4% 2.0%
2008 58.9% 46.8% 6.5% 0.9%
Nepal 1998 24.4% 3.0% 1.1%
2008 52.9% 41.7% 6.0% 2.0%
Panchagarh 2010 50.4%* 38.5% 5.6% 3.3%
Bangladesh 2010 50.4%* 38.6% 5.6% 3.3%
* literacy is measured according to whether the individual has passed at least one class as the non response rate to the question on literacy is high.
Sources: Nepal LSS; India NSS; Bangladesh HIES
8
The districts suffer from substantial illiteracy (between 41% in Jhapa to 24% in Darjeeling), although there has been some rapid progress on this front over the past years (Table 4). Despite the progress, the majority of the adult population has not completed primary education in all districts but Darjeeling. Uttar Dinajpur has a much lower rate of at least primary educated population than the rest of India. Panchagarh has the lowest rate of primary school attainment in 2010 across all districts, a reflection of the low rate for Bangladesh relatively to Nepal and India. The share of secondary educated population is low everywhere and that of graduates negligible except in Darjeeling. This type of education profile along with the population figures suggests a pattern of comparative advantage in these districts skewed towards unskilled labor intensive activities. The only partial exception may be Darjeeling district, which has a record of slightly better education achievements. Nepalese districts, particularly Jhapa, may have some advantage in more land intensive agriculture given the relatively higher land-labor ratio.
Development and poverty
Available data paint a mixed picture about the level of economic development and poverty across the districts under analysis. Overall the data suggests that, while not amongst the poorest in South Asia, these districts - with the exception of Darjeeling - are poor relatively to the South Asian average. This picture is consistent with low levels of intra-regional trade, which do not help border districts flourish as the most direct beneficiaries of the potential gains from trade. On the other hand these districts – with the exception of Uttar Dinajpur - are also not poorer than the national average.
In fact in the case of Darjeeling and Jhapa, they are considerably better-off than their countries’
average, underscoring the importance of the tea production and trade in their economic achievements.
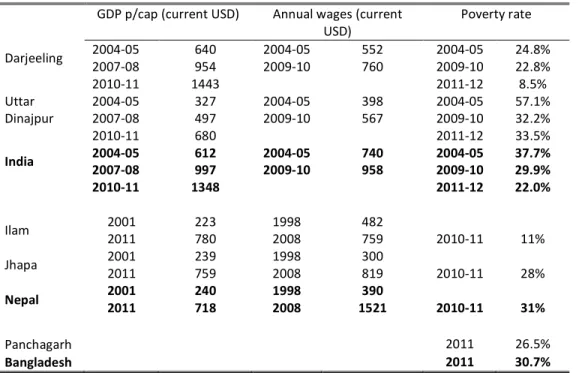
In Bangladesh, the district of Panchagarh has a poverty rate below the national average but it is above the Indian poverty rate (Table 5). On the Indian side, the case study districts of West Bengal are quite different. In the last decade Darjeeling has been catching up with the rest of the country in terms of GDP and poverty and has eventually achieved better indicators than the average around the end of the past decade (table 5).
5On the other hand in Uttar Dinajpur the poverty rate is higher and the wages and income per capita lower than the Indian average. In particular, over one in three residents of the district were poor in 2011-12, a rate 50% higher than the Indian one.
In Nepal, Ilam and Jhapa rank among the leading districts in the country on a number of measures of output and welfare, including components of the Human Development Index in which both are in the top quartile among Nepal’s 75 districts. Life expectancy is higher in Ilam than Jhapa, but literacy, mean years of schooling and income per capita are higher in the better connected Jhapa. Jhapa is also the fourth richest district in terms of aggregate output among Nepal’s 75 districts, compared to Ilam which stands at 27
th; however, in per capita terms, Ilam’s GDP per capita is higher at US$780 than Jhapa’s US$759. Both districts rank in the second quartile among the country’s 75 districts, and they are just above the national average (Table 5). The poverty rate in both districts is also not severe by national standards: it is almost one-third the national average in Ilam. However, the level and the growth of wages in the two districts are lower than the national average.
Comparing the data for districts on the India-Nepal border, it is worth noting that while Jhapa and Ilam score above average among Nepali districts, they lag on most indicators in comparison to their cross-border neighbors, and Darjeeling in particular. In relative rankings, Jhapa and Ilam fare better because the most backward districts in terms of development are located in Nepal’s remote mid-
5 The Indian poverty data use the latest Tendulkar poverty lines, which are considered more reliable to measure poverty than the older Lakdawala poverty lines (Government of India, 2009).
9
and far-west, not the more accessible central or eastern regions. By regional standards, however, Jhapa and Ilam are both low-income (as is the rest of Nepal).
Table 5: Economic welfare across Indian and Nepalese districts GDP p/cap (current USD) Annual wages (current
USD)
Poverty rate
Darjeeling
2004-05 640 2004-05 552 2004-05 24.8%
2007-08 954 2009-10 760 2009-10 22.8%
2010-11 1443 2011-12 8.5%
Uttar Dinajpur
2004-05 327 2004-05 398 2004-05 57.1%
2007-08 497 2009-10 567 2009-10 32.2%
2010-11 680 2011-12 33.5%
India
2004-05 612 2004-05 740 2004-05 37.7%
2007-08 997 2009-10 958 2009-10 29.9%
2010-11 1348 2011-12 22.0%
Ilam 2001 223 1998 482
2011 780 2008 759 2010-11 11%
Jhapa 2001 239 1998 300
2011 759 2008 819 2010-11 28%
Nepal 2001 240 1998 390
2011 718 2008 1521 2010-11 31%
Panchagarh 2011 26.5%
Bangladesh 2011 30.7%
Sources: World Development Indicators; UN Human Development Report 2004; Planning Commission, India; India National Sample Survey (various years); Nepal LSS; Bangladesh poverty mapping, World Bank (forthcoming); National Planning Commission, Nepal.
Economic structure
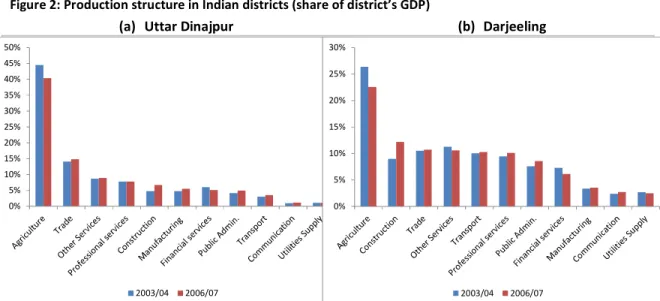
Agriculture dominates production and employment in all of the districts. That is due to the combination of the relatively low levels of development and the importance of tea production for the entire region. However there are also some relevant differences between districts. Consider for example the composition of output in Darjeeling (on the India-Nepal border) and Uttar Dinajpur (on the India-Bangladesh border). Agriculture is substantially more important in the latter where it accounted for 40% of GDP in 2006/07, while it accounted for only half of that in Darjeeling – the production structure in Darjeeling is more spread across sectors, with construction, trade, other services and transport accounting for at least 10% of GDP.
6Interestingly agriculture is becoming slightly less important in both districts, with construction and to a less extent manufacturing, increasing their share especially in Darjeeling.
Agriculture (including fisheries and mining) is the dominant activity in both Ilam and Jhapa, followed by a range of services including construction, trade and travel; manufacturing contributes less than 5% in both districts (Figure 3). According to the latest Agricultural Census (CBS 2012), Ilam and Jhapa ranked first and second among the 75 Nepali districts in terms of land area devoted to vegetable farming (more than 4,000 hectares each). They also rank in the top five in the farming of potatoes and spices (such as cardamom and ginger). Earlier production data (from 2001, the latest available to us) show that agriculture accounts for over half of the production value and in Jhapa the share is just below 50%. The other sectors are therefore relatively marginal with the exception of trade (in both districts) and transport, storage and communications in Jhapa (but not in Ilam). The importance of
6 In particular the importance of the transport sector is significant in Darjeeling, where its share is the highest in West Bengal districts after Kolkata. That may be related at least in part to the importance of the tea trade.
10
the latter sector in Jhapa may be related to the substantial tea production, which is the largest in the district (as shown below) and one of the largest in the country.
Figure 2: Production structure in Indian districts (share of district’s GDP)
(a) Uttar Dinajpur (b) Darjeeling
Source: Indian Planning Commission (http://planningcommission.nic.in/plans/stateplan/index.php?state=ssphdbody.htm)
Figure 2: Production structure in Nepalese districts (share of district’s GDP), 2011
Source: National Planning Commission estimates for
2014 Nepal Human Development Report (forthcoming)
While we do not have comprehensive production data for Panchagarh, the employment data from the most recent household survey is also consistent with a production structure dominated by agriculture. In the next section we will try to use production (and consumption) data to assess the extent to which gains from trade could potentially materialize.
District Transport Connectivity
The three countries are connected by a trade route and border infrastructure that intersect with the so-called Siliguri Corridor, a major trade route linking the mainland and NE States of India. Siliguri is
0%
5%
10%
15%
20%
25%
30%
35%
40%
45%
50%
2003/04 2006/07
0%
5%
10%
15%
20%
25%
30%
2003/04 2006/07
0%
10%
20%
30%
40%
50%
60%
70%
Ilam Jhapa
11
the main commercial city in the northern part of West Bengal. Located strategically at state and international borders, Siliguri has become an important regional hub, with good connectivity to Kalimpong in Darjeeling district and Sikkim by road, as well as with Darjeeling and Jalpaiguri by rail; it also includes the only airport in the region, in Bagdora. There is a north-south route that intersects with the Siliguri Corridor running between the Kakarbhitta (Nepal)/Panitanki (India) and the Fulbari (India)/Banglabandha (Bangladesh) border posts. All three countries therefore have access to Siliguri.
The road from Fulibari to Panitanki is in a fair condition, but in need of an upgrade and widening. In Nepal the route links to the recently renovated Nepal East-West highway. The Siliguri Corridor handles more than 40m tonnes of traffic per year most of it east bound between mainland India and the North-East States. Nepal/Bhutan – India/Bangladesh traffic passing through the corridor is close to 1m tonnes per year. There is therefore some potential for the trade traffic flows between the three countries to interact with and benefit from the larger flows passing through the corridor.
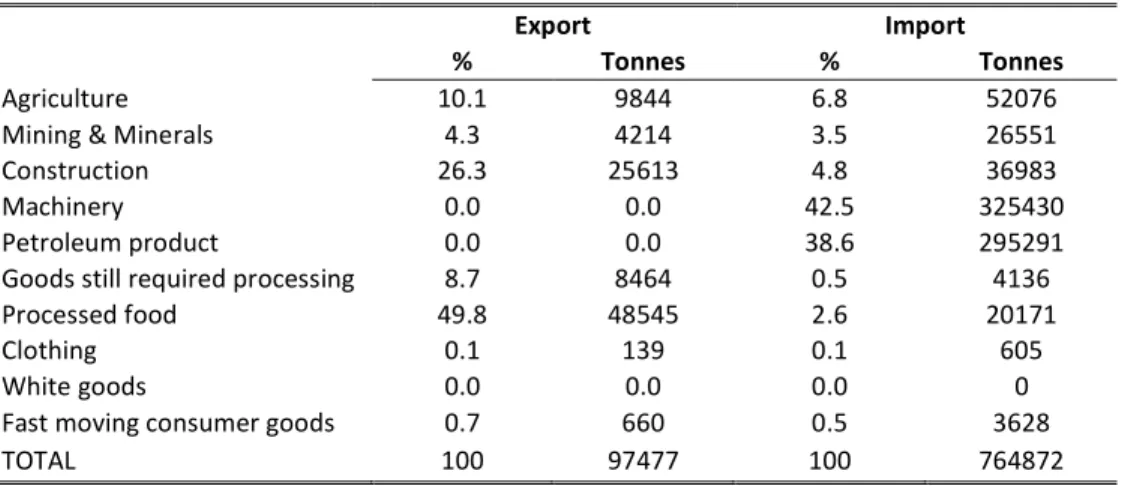
The Kakarbhitta/Panitanki border station pair between Nepal and India handles approximately 100 to 150 trucks per day. In 2012 Kakarbhitta handled 3 percent of Nepal’s imports and 11 percent of exports. Exports are dominated by construction materials and processed foodstuffs while imports are dominated by machinery and petroleum products (Table 6). In Nepal there is a road based inland container depot at Kakarbhitta. The border stations on both sides are open seven days a week, except one Saturday per month. India is building a new four-lane bridge across the river that forms the boundary line to relieve the current, overcrowded, two-lane bridge. However, generally, there are no obvious infrastructure constraints to trade between the two countries through this point.
Table 6: Volumes through Kakarbhitta/Panitanki Land Border Crossing Point
Export Import
% Tonnes % Tonnes
Agriculture 10.1 9844 6.8 52076
Mining & Minerals 4.3 4214 3.5 26551
Construction 26.3 25613 4.8 36983
Machinery 0.0 0.0 42.5 325430
Petroleum product 0.0 0.0 38.6 295291
Goods still required processing 8.7 8464 0.5 4136
Processed food 49.8 48545 2.6 20171
Clothing 0.1 139 0.1 605
White goods 0.0 0.0 0.0 0
Fast moving consumer goods 0.7 660 0.5 3628
TOTAL 100 97477 100 764872
Source: Mott MacDonald (2013)
At Banglabandha-Fulbari is the land border crossing point on the shortest route between Bangladesh and Nepal. There is a modern facility on the Indian side, with two "warehouses" (one of which is refrigerated), and a large car park (used for trans-loading purposes) among other infrastructure. The Bangladesh side is far less elaborate in terms of infrastructure, but offers sufficient space to process existing traffic and any growth in the medium term.
There are special arrangements to allow informal interactions within the border region. As there
are settlements adjacent to the border, the inhabitants are allowed to utilize a strip of land along the
border, within defined hours. In India the residents as well as their livestock have to be registered
with the Border Security Force in India. The arrangement is based on a realization that the border is
not always clearly delineated.
12
The land border crossings between the three countries therefore allow both formal and informal trade exchanges to take place.
4. The potential gains from trade integration
4.1. The gains from trade for border regions
The gains from trade integration are one of the most studied topics in the economics literature. The classic Heckscher-Ohlin and Ricardian models predict a country’s gains from trade to be proportional to the difference in factor endowments or in production technology vis-à-vis the rest of the world.
According to these models the amount of trade generated in moving from autarky to an open trade regime will be increasing in these differences. This basic insight has been confirmed by recent developments in the trade literature (Krugman, 1980; Eaton and Kortum, 2002; Melitz, 2003) that have further highlighted additional gains that are associated with: i) the “love of variety” through intra-industry trade; ii) allocative efficiency through shifting of labor and capital from less productive to more productive firms, and iii) productive efficiency through trade-induced innovation (Melitz and Trefler, 2012).
In fact Arkolakis et al. (2012) show that in these models the welfare gains from trade integration are an increasing function of the change in the share of imports in the economy and the elasticity of trade with respect to trade costs.
7This powerful insight is intuitive: the higher the increase in imports relative to domestic consumption, the higher the benefits for consumers and producers that can access a wider variety of goods at lower prices relative to autarky.
While these gains from trade integration are typically considered at the national level, their implications should carry over to the within-country regional level as well. In particular, in this paper we are concerned on how the potential gains from deeper integration may apply to border regions (as opposed to the country’s average). There are at least two ways in which these regions differ from the rest of the country, which are relevant in computing the gains.
First, price changes due to deeper integration (i.e. reduction in prices of traded goods) tend to be more pronounced in border regions than in the rest of the country. That is due to the incomplete price pass-through of the international prices especially in locations remote from where the goods enter the country. Using data on Ethiopia and Nigeria, Atkin and Donaldson (2014) show that these elasticities are decreasing with the distance to the goods’ port of entry. Similarly Nicita (2009) finds that part of the reason why the effects of the North American Free Trade Agreement (NAFTA) on households’ welfare in Mexico were more pronounced in regions bordering the US was due to the decaying effects of the price changes following NAFTA. Calì (2014) also shows that the reduction in prices of traded goods following trade liberalization in Uganda in the 1990s was higher in districts hosting or close to a major border-post. This stronger price reduction in border regions following trade integration should yield larger benefits for these regions as their share of imported goods in total expenditures should increase by more than in the other regions.
7 The authors show that for a large class of trade models these gains are equal to: = / where the first term is the change in real income associated with international trade integration; the term is the change in the share of domestic expenditures and ε is the trade elasticity with respect to variable trade costs.
13
In addition trade integration expands the market for domestic production, which tends to move progressively to the border regions as they become closer to the economic core.
8That is the story of Mexico after NAFTA, which induced a flurry of domestic and foreign investments towards the regions near the US border (Hanson, 2004). Similar findings apply also to the case of Austria following the fall of the Iron Curtain in 1990. This event was particularly beneficial for the regions close to Austria's eastern border, where employment grew more than elsewhere as these regions were closer to the newly accessible markets of Eastern Europe (Brülhart et al., 2012).
This production effect may go beyond the goods’ sector and extend to services as well. Indeed the increased trade flowing through the border regions increases the demand for incidental services, such as storage, transport and logistics, which are often supplied by contractors located in these regions. Consistent with this hypothesis Hanson (1998) finds strong positive employment effects of NAFTA in the transportation and wholesale trade industries for the small US cities bordering Mexico.
Interestingly for our setting, the author also finds that in large US border cities, the employment effects are strongest for the manufacturing industry. This finding confirms that integration alone is not sufficient to generate large gains via the production side. Without agglomeration economies several manufacturing industries would not be attracted to the border regions regardless of how close these regions are to the new markets. The regions in this study are dominated by agriculture.
Thus, this caveat may have limited application in the short run. But it is an important one as these regions may try to move up the value chain to penetrate agro-processing and manufacturing industries which require agglomeration economies.
4.2. Assessing the size of the possible gains in the study region
This brief review confirms that border regions stand to gain from deeper integration. But what is the size of this potential gain? The discussion above suggests that the answer depends on the size of the trade expansion across the border regions following trade integration as well as the increase in the share of imported goods in the regions’ expenditure.
The objective of this section is to present measures that - we argue – may predict at least in part the possible size of these two parameters and thus the gains from trade integration our study regions.
These measures are based on available secondary data and are complemented by the findings from the tea case study, which provides a more granular picture of the possible gains and the nature of such gains for an important commodity produced in the region.
We compute two types of measures. The first set consists of measures of complementarity between district economies on each side of the border. These measures hinge on the simple idea that higher complementarity would provide more opportunities to trade. Constraints in data availability induce us to rely mainly on household production and consumption data to compute these measures.
The second type of measure consists of price differentials between important consumption items across the borders. Comparing price data provides a complementary way to assess potential trade expansion following the elimination of trade barriers across the borders. Equivalently these differentials proxy the thickness of trade barriers which prevent the price equalization (net of transport costs) predicted by the law of one price (LOP). This exercise is similar in spirit – although more basic - to Brenton et al. (2013), who assess the effects of the border on the deviation of the LOP in three commodities between 25 pairs of contiguous countries in Sub-Saharan Africa.
8 This production effect could still be subsumed in the simple formula of the welfare gains computed by Arkolakis et al.
(2012) by noting that export industries have higher share of expenditures on imported goods. Therefore that raises the overall share for the regions hosting this new production.
14 Measures of complementarities
The typical way to measure complementarity between countries is to compare one country’s import flows with the other country’s export flows at disaggregated sectoral level. The closer the sectoral composition of the two flows, the higher the complementarity -- and potential gains from trade.
However these data are not available at the district level for our countries.
The next best alternative would be to use data representative of the overall district’s production.
Unfortunately the production data – reported in tables 5 and 6 above - are not really suitable for a comparison of districts across the border. They are relatively outdated and refer to different time periods. More importantly they are highly aggregated and use different sectoral classifications.
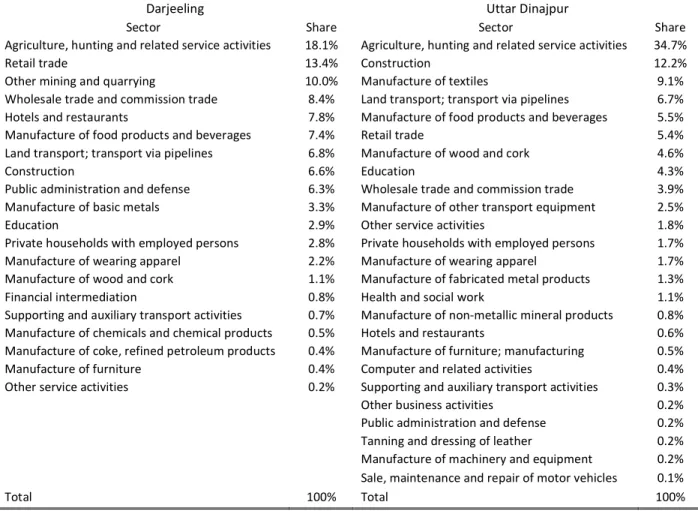
Therefore we try to compare the districts on each side of the borders through their employment composition. As shown in Table 7, in the case of the Indian districts this composition reflects to a large extent that of production, albeit with some relevant differences – for example, sectors like mining (in Darjeeling) and manufacturing appear to be far more important in employment than in the production structure.
9Table 7: Employment structure in Indian districts (share of total), 2009/10
Darjeeling Uttar Dinajpur
Sector Share Sector Share
Agriculture, hunting and related service activities 18.1% Agriculture, hunting and related service activities 34.7%
Retail trade 13.4% Construction 12.2%
Other mining and quarrying 10.0% Manufacture of textiles 9.1%
Wholesale trade and commission trade 8.4% Land transport; transport via pipelines 6.7%
Hotels and restaurants 7.8% Manufacture of food products and beverages 5.5%
Manufacture of food products and beverages 7.4% Retail trade 5.4%
Land transport; transport via pipelines 6.8% Manufacture of wood and cork 4.6%
Construction 6.6% Education 4.3%
Public administration and defense 6.3% Wholesale trade and commission trade 3.9%
Manufacture of basic metals 3.3% Manufacture of other transport equipment 2.5%
Education 2.9% Other service activities 1.8%
Private households with employed persons 2.8% Private households with employed persons 1.7%
Manufacture of wearing apparel 2.2% Manufacture of wearing apparel 1.7%
Manufacture of wood and cork 1.1% Manufacture of fabricated metal products 1.3%
Financial intermediation 0.8% Health and social work 1.1%
Supporting and auxiliary transport activities 0.7% Manufacture of non-metallic mineral products 0.8%
Manufacture of chemicals and chemical products 0.5% Hotels and restaurants 0.6%
Manufacture of coke, refined petroleum products 0.4% Manufacture of furniture; manufacturing 0.5%
Manufacture of furniture 0.4% Computer and related activities 0.4%
Other service activities 0.2% Supporting and auxiliary transport activities 0.3%
Other business activities 0.2%
Public administration and defense 0.2%
Tanning and dressing of leather 0.2%
Manufacture of machinery and equipment 0.2%
Sale, maintenance and repair of motor vehicles 0.1%
Total 100% Total 100%
Source: Indian National Sample Survey, 2009-10
9 This issue may be due to the mobility of people, who may work in other districts despite maintaining the residence in their original one. Thus the employment structure may not reflect the production structure as accurately as we would like.
15
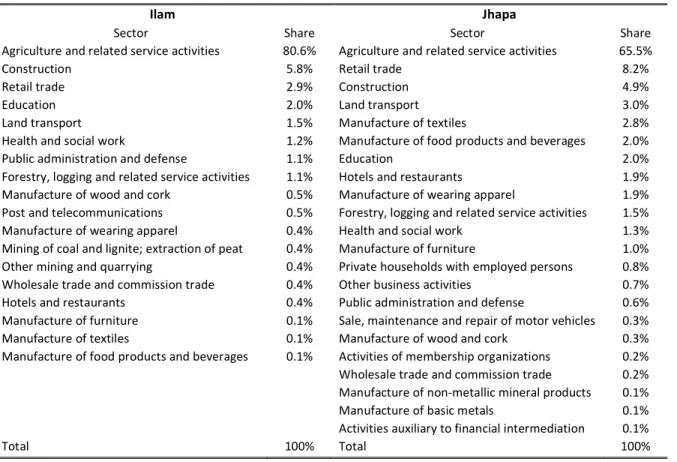
Comparing this with the employment structure in the Nepalese districts, reported in Table 8, we see greater dominance of agriculture in both Ilam and Jhapa. Two-thirds of employment in Jhapa and more than 80% in Ilam is in agriculture; moreover, manufacturing sectors account for only around 8% of employment in Jhapa and just over 1% in Ilam, far below the levels in the Indian districts.
These data suggest that the economies of the Nepalese districts are much less diversified than their West Bengal counterparts (particularly Darjeeling) and suggest some complementarity in production structures and hence opportunities for trade.
Table 8: Employment structure in Nepalese districts (share of total), 2008
Ilam Jhapa
Sector Share Sector Share
Agriculture and related service activities 80.6% Agriculture and related service activities 65.5%
Construction 5.8% Retail trade 8.2%
Retail trade 2.9% Construction 4.9%
Education 2.0% Land transport 3.0%
Land transport 1.5% Manufacture of textiles 2.8%
Health and social work 1.2% Manufacture of food products and beverages 2.0%
Public administration and defense 1.1% Education 2.0%
Forestry, logging and related service activities 1.1% Hotels and restaurants 1.9%
Manufacture of wood and cork 0.5% Manufacture of wearing apparel 1.9%
Post and telecommunications 0.5% Forestry, logging and related service activities 1.5%
Manufacture of wearing apparel 0.4% Health and social work 1.3%
Mining of coal and lignite; extraction of peat 0.4% Manufacture of furniture 1.0%
Other mining and quarrying 0.4% Private households with employed persons 0.8%
Wholesale trade and commission trade 0.4% Other business activities 0.7%
Hotels and restaurants 0.4% Public administration and defense 0.6%
Manufacture of furniture 0.1% Sale, maintenance and repair of motor vehicles 0.3%
Manufacture of textiles 0.1% Manufacture of wood and cork 0.3%
Manufacture of food products and beverages 0.1% Activities of membership organizations 0.2%
Wholesale trade and commission trade 0.2%
Manufacture of non-metallic mineral products 0.1%
Manufacture of basic metals 0.1%
Activities auxiliary to financial intermediation 0.1%
Total 100% Total 100%
Source: Nepal labor force survey 2008
We assess the extent to which the Nepalese and Indian districts may benefit from integration by comparing more formally their employment structures. To do so we use a simple cosine index of similarity between Nepal and Indian districts’ employment. That is essentially defined as the ratio of the covariance between the two variables and the product of each variable’s variance:
cos = ∑ ( − ) × ( − )
∑ ( − ) × ∑ ( − )
where y is employment (in districts j and s), is the average employment in the relevant district; i is the tradable sector and N is the number of tradable sectors. The index varies between -1 (perfect complementarity) and 1 (perfect similarity).
Given the importance of agriculture, especially among the tradable, it is unsurprising that the values
of the index are close to 1 for all pair-wise combinations (Table 9). Ideally we would need more
16
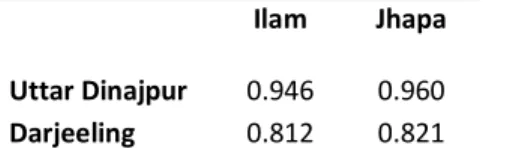
disaggregated data to draw stronger inferences on the similarities between the local economies, as districts trade in specific agricultural products. In the absence of such disaggregated data, we can still infer from the index that overall similarity across districts is relatively high; however Darjeeling is less similar to its Nepalese counterparts than Uttar Dinajpur. And Ilam and Darjeeling, despite being geographically alike, seem to be economies most different among the four district pairs, suggesting greater gains from new trade opportunities.
Table 9: Cosine index of employment similarity between Indian and Nepalese districts
Ilam Jhapa
Uttar Dinajpur 0.946 0.960 Darjeeling 0.812 0.821
Source: Authors’ elaboration based on India NSS and Nepal Labor Force Survey
To some extent the employment data at this level of aggregation suffers from similar problems to the production data. As the agricultural sector dominates tradable sector’s employment across districts, the absence of employment disaggregated data within this sector masks any potential differences in employment structures. Therefore, we complement this index with one which relies on the similarity in households’ production in one district with consumption in the other. For the Indian districts we only have data on consumption, thus we use data on production for the districts in Nepal and Bangladesh and match them with the adjoining Indian districts.
More formally, the cosine index is computed as:
cos = ∑
#$(! − ! ) × (" − " )
∑ (! − ! )
#$× ∑ (" − " )
#$where P is total households’ sales of product i in district j, ! is average sales across products in j; C is total consumption of product i in district s, " is average consumption across products in s; N is the total number of products for the district pair.
Such an index has two main advantages over the employment structure index. First, it relies on product level information thus capturing much of production (and consumption) structure within the agricultural sector. Second, it provides a closer measure of trade potential as it captures potential supply and potential demand by looking at current production and consumption patterns.
The use of this measure also comes at a cost. The main one is that it disregards non-household production and consumption, including the firm and the public sector, which are important especially in the non-agricultural sectors. Households essentially produce only agricultural and related products, while they consume all sorts of goods. Therefore an index that used all households’
consumed goods would underestimate the true complementarity between economies. Because of
that we compute the index only for agricultural and animal products, which are consumed, produced
or both produced and consumed by the households across districts. So it is effectively an index of
complementarity in agriculture. Given the prominence of the sector in the overall economic
structure of these districts, this limitation may not be so severe at least when evaluating the trade
potential in the short term. Tea may in fact be the exception to this rule as much of the local
production is not consumed by households – as explained below - but rather sold to intermediaries
and processors. This may generate a downward bias in the index as production would not match
household consumption.
17
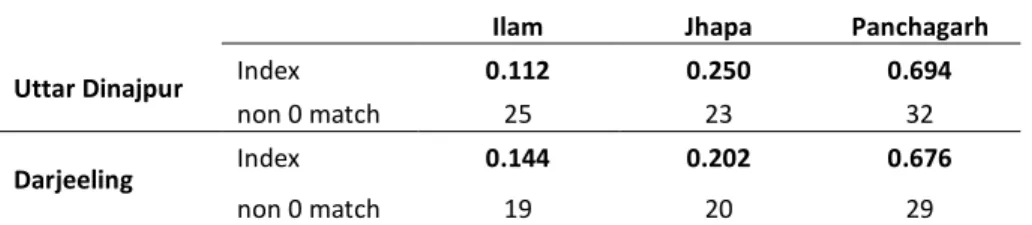
We use an average of 84 products by district pair with the majority of products recording nil in either consumption or production value (the products’ details along with their production and consumption values are reported in Tables A1-A6 in the Appendix). Table 10 presents the cosine index for each contiguous district pairs along with the number of matched products that have non zero values on each side of the border. The indices are always positive, which suggests that some degree of complementarity exists for all the district combinations. This result confirms that the trade potential (at least in agriculture) is promising in the entire study region.
The degree of complementarity varies markedly across district pairs. In particular, it is very high between Panchagarh and the Indian districts, with values of the index close to 0.7. Part of the reason for this high value is the importance of rice production in Panchagarh and in consumption in Indian districts, which signals a trade opportunity. In addition, Panchagarh’s production is generally more in line with Indian consumption than in the case of Nepalese districts with a higher number of non-zero matches.
Complementarity between the Nepalese and the Indian districts is lower, with Ilam having the lowest cosine index with both Uttar Dinajpur and Darjeeling. Part of the reason for these lower values is due to the greater importance of tea production in Nepalese districts than in Indian households’ consumption, as explained above. However for a number of products Nepalese districts’
production and Indian districts’ consumption are well above the average, such as milk, meat, potato (for Ilam). These are additional to the potential in tea trade discussed in the next sections.
Table 10: Cosine index of production-consumption complementarity
Ilam Jhapa Panchagarh
Uttar Dinajpur Index 0.112 0.250 0.694
non 0 match 25 23 32
Darjeeling Index 0.144 0.202 0.676
non 0 match 19 20 29
Note: the index uses consumption data for Indian districts and production data for the other districts Price differentials
Another way to look at potential trade gains from deeper integration is to examine price differentials of homogeneous products across-bordering districts. Such differentials would indicate potentially large spatial arbitrage opportunities if barriers were reduced. In that case increased trade would tend to bring prices of the same commodities more in line with each other.
We use three different sources for price data, one for each country. For India, we rely on the data from the Government of India’s Labour Bureau, which collects district-level consumption price data for industrial workers. The data are available only for Darjeeling. For Nepalese and Bangladeshi districts, we were unable to find price data at the district level, thus we compute unit values from the household surveys. We keep only those products with values that have a small dispersion. After this procedure we are able to match 7 products between Nepalese districts and Darjeeling and 6 products between Panchagarh and Darjeeling. We then convert Indian prices into the other currency using the average exchange rate for the year of the relevant survey (which happens to be 2010 for both Nepalese and Bangladeshi surveys).
It is important to note at least three limitations, which should induce caution when interpreting the
results of such comparisons. First, unit values are subject to measurement error as the household
has to recall both the price and the quantity of purchases (Gibson and Rozelle, 2005). Second, while
18
we have made efforts to use the same commodities across districts, unobserved differences in quality may still be present and capitalized in the prices. With this caveat, researchers have used unit values to estimate price differences across space as an alternative when market prices at the local level are not available (Coondoo et al., 2004; Majumder et al., 2012). In addition certain crops, such as rice, are subsidized to poor households through the Public Distribution System thus creating an artificially low price. Unfortunately the data available do not allow us to net out the effect of the subsidy from the price. Therefore the Indian prices of rice should be taken as a lower bound of the true market price.
The price comparisons for both sets of districts, presented in Tables 11 and 12, indicate large price differentials across the border. In the case of Darjeeling versus the Nepalese districts, prices are generally higher in the latter, suggesting large potential gains from deeper trade integration for Nepalese consumers as well as for Indian producers. These potential gains would be complementary to those estimated through the cosine index above, as the latter were based on Nepalese production and Indian consumption. In addition to the “border effect,” the generally poor transport infrastructure within Nepal creates large wedges in prices of similar products across districts. Ilam is linked to Jhapa by a narrow (two-lane) winding road (Mechi Highway) up the Chure mountains from the plains, frequently beset by hazards, both natural (landslides) and manmade (political agitations and bandhs). Unlike the Indian side, there is no railway connecting the plains with the hills in Nepal.
The price differences – varying between 2% to 49% of the price in the high-price district - are usually larger than any reasonable estimates of transport and distribution costs between bordering regions.
Therefore for most of the products considered, reducing barriers to trade between districts would likely generate a trade flow from the cheaper Indian district (Darjeeling) to the more expensive districts in Nepal. Such trade should bring about a convergence in prices across districts (net of transport and marketing costs).
Take the case of rice, the most important item (in value) in households’ consumption basket across the districts. The price of both fine rice and coarse rice recorded by Ilam consumers is higher than the consumption price of rice in Darjeeling by 37% and 26% respectively. Given that fine rice accounts for 4.7% and coarse rice for 19% of total household expenditures in Ilam, the potential gains for Ilam households of bringing the price down to the level of Darjeeling would be 2.7% and 6.5% of total expenditures respectively. Similar figures apply to Jhapa as well. These estimates should be taken as upper bound estimates of the potential gains as they do not consider that some price differences would remain even after eliminating all the barriers to trade due to transport and distribution costs. In addition they are likely to be biased from measurement errors and quality differences in price data as explained above. In particular pure market prices for rice may be higher in Darjeeling due to the subsidy scheme. Finally, these price differences do not account for possible substitution effect across items as relative prices change (which should bias the gains downward).
However, these estimates are suggestive of some potential gains from trade integration even on the consumer side.
And the gains would apply to Indian consumers as well. For example, milk is 22% cheaper in Ilam than in Darjeeling. As this product accounts for 2.5% of total households’ expenditures in Darjeeling, a price reduction would yield monetary benefits for Indian consumers close to 1% of their total expenditures. Similar price differences, although generally smaller in magnitude, exist also between Darjeeling and Jhapa.
The comparison of prices in Darjeeling and Panchagarh reveals even larger differences. Prices for
most products are lower in Panchagarh than in Darjeeling. For rice, wheat, onion and gur, prices are
19
between 73% and 93% higher in Darjeeling.
10In the case of rice alone these figures yield an upper bound of the potential consumption gains from the elimination of trade barriers as high as 8% of total expenditures. In fact consumer prices computed from households’ expenditure data are suspiciously low in Panchagarh. For rice, wheat and onion we are able to complement these data with producer prices from a different module of the same survey. The differences are still quite large, varying between 19% for wheat and 69% for gur. The upper bound of the potential gain from trade integration for rice is also substantial at 3% of total expenditures. These results resonate with the high production-consumption complementarity between Panchagarh and the Indian districts described above, providing confirmation of the potential large gains for Bangladeshi producers and Indian consumers from trade integration.
Table 11: Price differentials across bordering districts for selected products, Darjeeling vs. Nepalese districts (2010)
Darjeeling vs. Ilam Darjeeling vs. Jhapa
diff.
(NPR) % diff. Cons. % in total
Potential savings (%
cons.)
diff.
(NPR) % diff. Cons. % in total
Potential savings (%
cons.)
Fine rice/Kg -14.9 -37% 4.7% 1.7% -16.1 -39% 7.0% 2.7%
Coarse rice/Kg -8.8 -26% 19.0% 4.9% -6.6 -20% 15.9% 3.2%
Wheat Whole/KG -14.0 -42% 0.8% 0.3% -9.9 -34% 1.1% 0.4%
Milk/Litre 6.3 22% 2.5% 0.6% 2.3 8% 2.5% 0.2%
Pure Ghee/Litre 103.6 23% 0.1% 0.02% -25.5 -5% 3.0% 0.2%
Onion/KG -10.4 -23% 0.8% 0.2% 0.6 2% 0.8% 0.01%
Sugar/Kg -18.7 -27% 1.3% 0.3% -10.9 -17% 1.9% 0.3%
Gur/Kg -57.4 -49% 0.03% 0.01% -12.1 -17% 0.1% 0.02%
Source: Authors’ elaboration based on Government of India’s Labour Bureau, India NSS 2009-10; Nepal LSS 2010. Prices are converted using the average Indian Rupee-Nepalese Rupee exchange rate in 2010. The price differential is computed as the difference between Darjeeling consumer prices and Nepalese districts’ consumer prices as estimated from the NLSS. Rice is not differentiated by type in the data for Darjeeling. ‘Cons. % in total’
indicates the share of the product in total households’ expenditures in the more expensive district; ‘potential gains’ are the potential savings as a share of total households’ expenditures in the expensive district obtained by equalizing the price with that of the cheaper district.
For some products the gains from trade integration are also likely to be appropriated by Indian producers and Bangladeshi consumers. In particular chillies and tea leaf have lower prices in Darjeeling than in Bangladesh, a result consistent with the importance of these goods in the production in Darjeeling. The relatively low relevance of these products in Panchagarh households’
consumption basket makes the magnitude of the potential gains from integration low.
Taken together the analyses above suggest the presence of important opportunities to trade across borders which are currently underexploited. This finding is subject to a number of caveats mentioned above that may reduce the real extent of these potential opportunities. On the other hand data limitations may also have prevented to identify other gains. For example the analysis has focused on agricultural products, which are likely to compose a large share of the trading basket across districts in case of deeper trade integration. However, these gains may extend well beyond agriculture. Taking the case of tea, the next part of the study will illustrate some of the factors that may prevent these gains from materializing as well as on the nature of some of the gains.
10 Contrary to the India-Nepal case, the rice subsidy in India should artificially reduce the price gap in the case of the Bangladesh-India comparison.