Charge-State-Dependent Diffusion of Individual Gold Adatoms on Ionic Thin NaCl Films
Jascha Repp,1,* Wolfram Steurer,2 Ivan Scivetti,3Mats Persson,3 Leo Gross,2 and Gerhard Meyer2
1Institute of Experimental and Applied Physics, University of Regensburg, 93053 Regensburg, Germany
2IBM Research-Zurich, 8803 Rüschlikon, Switzerland
3Surface Science Research Centre and Department of Chemistry, University of Liverpool, Liverpool L69 3BX, United Kingdom
(Received 19 May 2016; published 30 September 2016)
It is known that individual metal atoms on insulating ionic films can occur in several different (meta) stable charge states, which can be reversibly switched in a controlled fashion. Here we show that the diffusion of gold adatoms on NaCl thin films depends critically on their charge state. Surprisingly, the anionic species has a lower diffusion barrier than the neutral one. Furthermore, for the former we observe that the diffusion atop a bilayer of NaCl is strongly influenced by the interface between NaCl and the underlying copper substrate. This effect disappears for a trilayer of NaCl. These observations open the prospect of controlling the diffusion properties of individual metal atoms on thin insulating films.
DOI:10.1103/PhysRevLett.117.146102
A most interesting finding is the observation that metal atoms on insulating films can exhibit several different charge states, which can be controlled on the level of individual atoms in the junction of a scanning probe microscope [1–10]. As the charge state of an adsorbate is decisive for many of its physical and chemical properties, a control of the charge state offers the prospect of controlling adsorbates in many other aspects, ranging from their spin degrees of freedom[6,7]to their catalytic activity [11]. Although the possibility of controlling the diffusion properties by means of charge-state manipulation was briefly mentioned[1], no corresponding experiments were reported so far.
Here we show from scanning tunneling microscopy (STM) experiments that the diffusion behavior of individ- ual gold adatoms on ultrathin NaCl films depends strongly on its charge state and can therefore be controlled by means of STM-based manipulation [1]. Somewhat surprisingly, the negatively charged gold anions diffuse more readily as compared to the neutral ones. This result is rationalized in view of a recent analysis of the different possible adsorp- tion sites of these adsorbates[10]. We further observe that Au anions on a bilayer of NaCl on Cu(111) show a diffusion pattern corresponding to the moiré pattern of the interface of NaCl to the underlying metal substrate.
Apparently, the ionic relaxations in the polar insulating film that are present around negatively charged Au− anions [1,12]interact with the bucklings of ions in bilayer NaCl films that arise from the incommensurate interface with the substrate.
The experiments were carried out with two homebuilt low-temperature STM apparatuses with a base temperature of 5 K. NaCl was evaporated thermally onto a clean Cu(111) single-crystal surface such that defect-free (100)-terminated NaCl bilayer islands were formed [13]
with smaller patches of a third NaCl(100) layer on top of
them. Gold atoms were deposited with the sample inside the STM atT <10K. All voltages refer to the sample bias with respect to the tip. For our diffusion study, many sequences of STM images were recorded at different temperatures. The temperature was stabilized by heating the entire STM head, being thermally only weakly coupled to the helium bath. The temperature was sensed at the STM head by means of diode thermometry. The temperature was kept stable for several hours for thermal equilibration before starting the acquisition of image sequences, from which diffusion patterns were extracted. These sequences were corrected for the remaining low creep and drift only in hindsight by means of markers provided by defects or stationary adatoms. Some sequences are available as movies; see [14]. The atomic positions were extracted numerically by locally fitting the adsorbates’protrusions in the STM images to two-dimensional Gaussian functions.
The diffusion of neutral gold adatoms (Au0) [20] was investigated by recording several series of subsequent STM images each at a fixed temperature T in the range of 50K< T <60K. From each of these series, the image- to-image displacement of the observed adatom was extracted. The resulting pattern for one of these is displayed in Fig.1(a). It reflects the square NaCl(100) surface lattice and is therefore compatible with the on-top Cl−adsorption site as reported earlier [1]. The image-to-image adatom displacement distribution fits the one expected for a single- step random walk[21], indicating conventional diffusion.
From each of the series of images, the hopping rateνwas extracted[14,15], which plotted against the inverse temper- ature yields the Arrhenius plot shown in Fig.1(b). Fitting these data to νðTÞ ¼ν0expð−ED=kBTÞ, where kB is the Boltzmann constant, yields the preexponential factorν0¼ 7×10112s−1and a diffusion barrierED¼ð0.1560.02ÞeV.
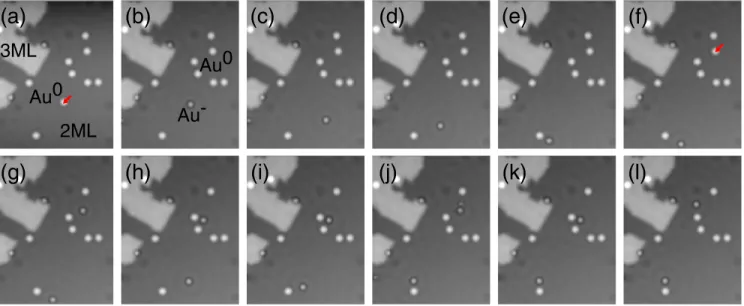
As can be seen in Fig. 2 and the corresponding movie [14], gold anions (Au−) diffuse more readily than the Au0
adatoms. AtT≃30K, Au− adatoms diffuse with hopping rates on the order of one per few minutes, whereas no hopping events are observed for Au0 adatoms consistent with the Arrhenius plot of Fig. 1(b). This enables the possibility to switch the diffusion on and off [22] by controlling the charge state. In this image sequence, two Au0 adatoms were deliberately charged (marked by red arrows), which was accompanied by an initiation of diffusion. Detailed inspection of the diffusion reveals a peculiar behavior. On the one hand, the image-to-image
adatom displacements are very large compared to the NaCl (100) lattice spacing indicating several hops. This requires the hopping rate to be multiples of the inverse of the time delay Δt between two subsequent images. On the other hand, however, Au− adatoms linger in certain sites for the duration of several subsequent frames, which—at first glance—is in contradiction with the above-mentioned hopping rate [18,23]. Furthermore, it becomes apparent that Au−adatoms tend to return to sites that were occupied previously. Given the distance of multiples of lattice spacings by which they moved in between images, it seems very unlikely that they return to the previous site just by mere coincidence. Instead, this observation suggests that certain lattice sites are energetically favored and preferentially occupied.
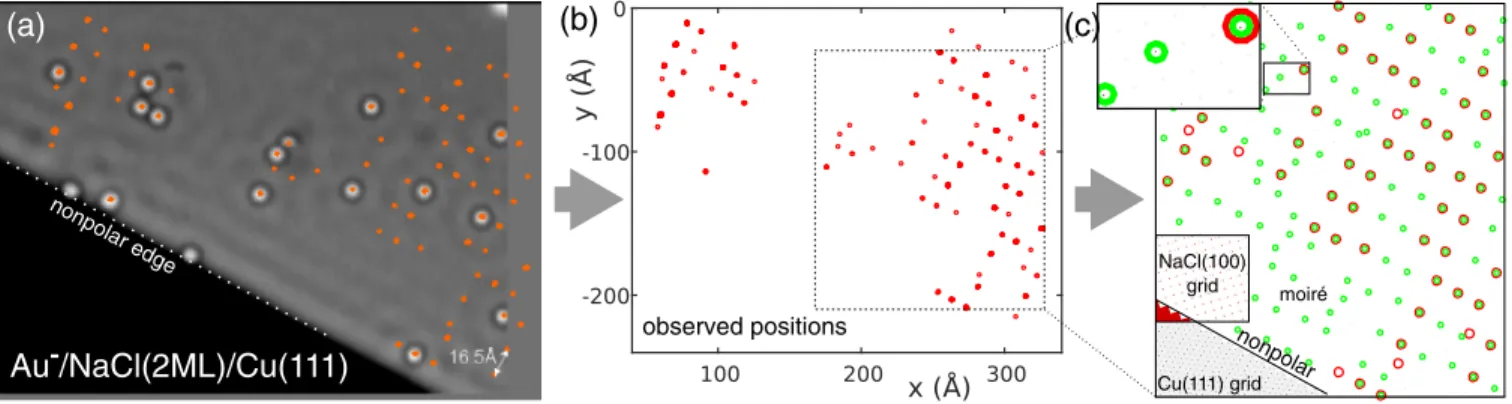
That behavior was analyzed in more detail, by following the diffusion of many Au− adatoms near an island edge of NaClð2MLÞ=Cuð111Þ; see Fig.3(a)and the corresponding movie [14]. The positions, at which these adatoms were observed were extracted and are displayed in Figs. 3(a) and 3(b). This analysis confirms the tendency of Au− adatoms to return to previously occupied sites and a pattern of diffusion emerges that shows some regularity. This pattern is in agreement with only one adsorption site per NaCl(100) surface unit cell (not shown), consistent with the observation of Au− adatoms on top of Cl− atoms as reported previously[1]. The pattern of diffusion, however, is much more sparse than the surface lattice itself; that is, only a very few of all lattice sites are occupied. As only the NaCl=Cu interface could possibly lift the degeneracy of
(g) (h) (i) (j) (k) (l)
(a) (b) (c) (d) (e) (f)
2ML 3ML
Au0
Au- Au0
FIG. 2. STM image sequence illustrating the selective diffusion of negatively charged gold atoms (Au−) on NaClð2MLÞ=Cuð111Þ (T≃30K;V¼76mV;I¼0.2pA;Δt¼6 min). (For the movie of the entire image sequence, see[14].) In frames (a) and (f), a neutral gold adatom (Au0) was deliberately charged by means of STM manipulation to form a Au−adatom, respectively. In contrast to the Au0 adatoms, the Au− adatoms diffuse at this temperature. Although often large adatom displacements are observed between subsequent images, sometimes Au−adatoms linger in certain sites for the duration of several subsequent frames [see (h) to (i) and (j) to (l)]. Moreover, Au−adatoms tend to return to sites that were occupied previously [see frames (i)–(k) and (d)–(h); for more examples, see[14]], despite the fact that they had moved a far distance (several multiples of lattice spacings) in between images.
(a) (b)
FIG. 1. (a) Image-to-image displacements of a single diffusing neutral Au0 atom adsorbed on NaClð2MLÞ=Cuð111Þ at T¼57.2K (image-to-image time interval Δt¼210s). The displacements are located on a square lattice (dashed grid lines) showing that only one adsorption site per NaCl(100) unit cell is a stable minimum. The colors indicate the displacement distance.
(b) Arrhenius plot of diffusion rateνðTÞas a function of inverse temperature T−1. The slope of the fit line corresponds to a diffusion barrier of 0.156 eV.
otherwise equivalent lattice sites, we analyzed the moiré pattern in the observed area as is shown in Fig.3(c). To this end, the hexagonal grid of the topmost layer of Cu(111), here represented as black dots in the bottom left corner of Fig. 3(c), was overlaid with the square surface lattice of NaCl(100). Depending on the ratio of lattice constants and the alignment angle, the moiré pattern is not necessarily periodic. Note that the ratio of the two lattice constants as well as the alignment angle are set by literature values and the observation of the strictly nonpolar island edge of NaCl, respectively. Only within narrow bounds could these parameters be varied to reproduce the moiré pattern [24].
This pattern is depicted by the black dots representing the Cu(111) lattice peeping through the grid representing NaCl(100). As this is difficult to see for the scaling of Fig.3(c)(see magnification in the inset), the coincidence of the NaCl grid with the Cu grid within 0.39 Å [25] was marked by small green circles. The resulting moiré pattern is almost identical to the observed diffusion pattern with all the prominent features being reproduced. This analysis reveals the direct link between the diffusion and the moiré pattern and explains why less than 10% of the possible NaCl-lattice sites are observed as being occupied by the adsorbates [26]. An influence of moiré patterns to the equilibrium sites of adatoms was observed before [26];
however, site preference was noted to have a rather smooth variation. Such induced site preference by a moiré pattern can be used as a template for regularly spaced adsorbates and clusters [27–31].
Bearing the above analysis in mind, it is not surprising that large image-to-image Au− adatom displacements were observed and, at the same time, Au− adatoms could linger in one site for the duration of several subsequent frames.
Turning back to Fig.1(a), it becomes also apparent that Au0 adatoms are not affected by the moiré pattern, in stark
contrast to Au−adatoms. Hence, the charging does not only affect the barrier height, but even the qualitative diffusion behavior is completely different. The selective interaction of Au− adatoms with the moiré pattern can be rationalized when considering that the charging of Au is accompanied by a strong relaxation pattern of the surrounding NaCl ions [1,12]. Apparently, this relaxation pattern interacts with the buckling of NaCl ions resulting from the interfacial moiré pattern.
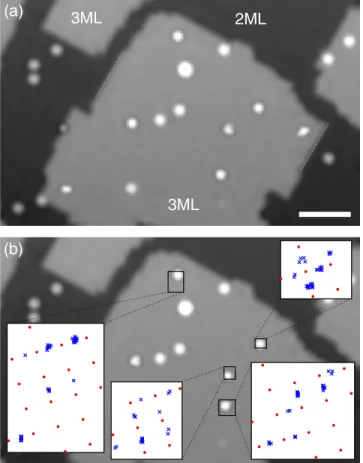
Finally, the influence of the moiré pattern should diminish for thicker insulating films, as the interface is separated further from the adsorbates. We therefore also investigated the diffusion of Au− and Au0adatoms at the same temper- ature of T≃30K on a trilayer island of NaCl(100) on Cu(111). The result is shown in Fig.4and a corresponding movie[14]. As for the bilayer data at this temperature, we observe the selective diffusion of Au− adatoms, whereas Au0 adatoms stay put. In contrast to the bilayer data, however, the Au− adatoms show conventional diffusion behavior without any signs of being influenced by a moiré pattern. Instead, the diffusion patterns (see insets) show two adsorption sites per NaCl surface unit cell, indicating the hollow site (between two Cl− and two Naþ ions) as the adsorption site in agreement with Ref.[10].
This last observation of a change in adsorption site from bi- to trilayers of NaCl for Au− adatoms suggests that the on-top Cl−site and the hollow site are almost degenerate in energy. Using manipulation at a temperatureTwell below the onset of diffusion, also nonequilibrium configurations can be occupied [32]. Indeed, using this technique at T≃5 K, Au− adatoms could be stabilized in both of the above-mentioned sites on the NaCl bilayer. This near degeneracy is in line with the observation that the diffusion barrier of Au− adatoms was lower than the one for Au0 adatoms. Relating the temperatures of the onset of diffusion Au-/NaCl(2ML)/Cu(111)
observed positions
Cu(111) grid NaCl(100)
grid moiré
(a) (b)
nonpolar edge
nonpolar
(c)
FIG. 3. Diffusion behavior of Au−adatoms on NaClð2MLÞ=Cuð111Þ. (T≃30K;V¼100 mV;I¼0.2pA;Δt¼6 min). (For the movie of the entire image sequence, see[14].) The preferential occupation of a small fraction of all lattice sites becomes apparent when extracting the observed adsorbates’positions from a sequence of images. The typical spacing of these positions is much larger than the NaCl lattice spacing. The pattern of extracted positions displayed in (b) can be reproduced by considering the moiré pattern shown in (c), arising from overlaying the hexagonal Cu(111) grid with the square grid of NaCl(100) [see the lower left corner in (c)]. The orientation of the NaCl(100) is known from the observation of the nonpolar island edges as indicated in (a) and (c). Small green circles indicate the coincidence of two grid points from both lattices within 0.39 Å. Comparing the resulting pattern with the experimentally observed sites (larger red circles) shows an almost identical structure with all the prominent features reproduced.
for Au− and Au0 adatoms with the diffusion barrier of Au0 adatoms extracted from the Arrhenius plot, we estimate the diffusion barrier of Au− adatoms to beEB≃ ð0.090.02Þ eV on the NaCl bi- and trilayer[14].
The observation that the diffusion barrier of Au− adatoms on the NaCl trilayer is relatively small and lower than the one for Au0 adatoms is corroborated by density functional theory calculations based on a perfect conductor model of the metal substrate[33,34]. The calculations were carried out using an implementation of this model[33]in
VASP[35]. The electron–ion-core interactions were handled by the projector augmented wave method (PAW)[36], and the exchange-correlation energy was treated using the version optB86b [37] of the van der Waals density
functional [38–40]. Each layer contained 16 Na and 16 Cl ions [41]. Since the measured relative change of the NaCl bilayer surface lattice constantafrom the truncated bulk surface lattice constant aB is very close to the corresponding calculated relative change ofða−aBÞ=aB¼
−1.9% of the freestanding bilayer, the calculated surface lattice constant of the freestanding trilayer was used for the trilayer corresponding toða−aBÞ=aB ¼−1.4%[42]. The most stable adsorption sites for the Au0 and Au− adatoms were found to be the top and hollow sites, respectively, in agreement with experiments. Using nudged elastic band calculations [43], the lowest potential energy barrier of 79 meV for the diffusion of the Au−adatoms was found to be between nearest neighboring hollow sites [44]. The transition state was found to be slightly displaced from the fourfold symmetric top site. In agreement with the experi- ments, this barrier is smaller than the calculated potential energy barrier of 96 meV for Au0adatoms between nearest neighboring top sites.
In conclusion, we found that Au0 and Au− adatoms exhibit fundamentally different diffusion properties. The diffusion barrier of the anion is only roughly 60% of that of the neutral species. The diffusion of Au− adatoms on a bilayer is strongly affected by the interfacial NaClð100Þ=
Cuð111Þmoiré pattern, whereas the diffusion of Au0atoms is not. As an interesting perspective, these observations suggest that the diffusion of anions on top of ultrathin films can be guided by designing suitable moiré patterns from the choice of the interface [27–31]. The mechanisms behind the peculiar diffusion behavior reported here are not limited to the system studied and therefore will have implications for the wide range of adsorbate-substrate systems that show charge bistability[1–10,45–47].
We thank Rolf Allenspach for helpful comments.
Financial support by the Volkswagen Foundation (Lichtenberg program), the European Research Council (Advanced Grant“CEMAS”), the Leverhulme Trust (F/00 025/AQ), and the allocations of computer resources at Chadwick, The University of Liverpool are gratefully acknowledged.
*jascha.repp@ur.de
[1] J. Repp, G. Meyer, F. E. Olsson, and M. Persson,Science 305, 493 (2004).
[2] G. Pacchioni, L. Giordano, and M. Baistrocchi,Phys. Rev.
Lett.94, 226104 (2005).
[3] F. E. Olsson, S. Paavilainen, M. Persson, J. Repp, and G. Meyer,Phys. Rev. Lett.98, 176803 (2007).
[4] M. Sterrer, T. Risse, U. Martinez Pozzoni, L. Giordano, M.
Heyde, H.-P. Rust, G. Pacchioni, and H.-J. Freund, Phys.
Rev. Lett.98, 096107 (2007).
[5] L. Giordano, G. Pacchioni, J. Goniakowski, N. Nilius, E. D. L. Rienks, and H.-J. Freund, Phys. Rev. Lett. 101, 026102 (2008).
(a)
(b)
2ML
3ML 3ML
FIG. 4. STM images out of a series of Au0and Au−adatoms on bi- (2 ML) and trilayers (3 ML) of NaCl(100) on Cu(111) (T≃30K; V¼150mV; I¼0.2pA; Δt¼6 min). (For the movie of the entire image sequence, see [14].) The sequence shows also selective diffusion of Au−adatoms only. The insets in (b) show the extracted pattern of occupied positions (blue crosses) overlaid with the square NaCl lattice (red dots, not referring to a specific site), the orientation of which is known from the nonpolar step edges indicated in (a). In contrast to the behavior on the bilayer, Au− adatoms on trilayers of NaCl on Cu(111) donotexhibit any peculiar influence from the interfacial moiré pattern. Instead, the diffusion pattern shows two adsorption positions per square NaCl(100) surface unit cell, which is compatible with adsorption in a hollow site (between two Cl− and two Naþ ions). The scale bar is 5 nm.
[6] J. Park, B. D. Yu, and H. Kim, Phys. Rev. B79, 233407 (2009).
[7] Y.-S. Fu, T. Zhang, S.-H. Ji, X. Chen, X.-C. Ma, J.-F. Jia, and Q.-K. Xue,Phys. Rev. Lett.103, 257202 (2009).
[8] L. Gross, F. Mohn, P. Liljeroth, J. Repp, F. J. Giessibl, and G. Meyer,Science324, 1428 (2009).
[9] B. Huang, H. Xiang, J. Yu, and S.-H. Wei,Phys. Rev. Lett.
108, 206802 (2012).
[10] W. Steurer, J. Repp, L. Gross, I. Scivetti, M. Persson, and G.
Meyer,Phys. Rev. Lett.114, 036801 (2015).
[11] B. Yoon, H. Häkkinen, U. Landman, A. S. Wörz, J.-M.
Antonietti, S. Abbet, K. Judai, and U. Heiz,Science307, 403 (2005).
[12] J. Goniakowski, C. Noguera, L. Giordano, and G.
Pacchioni,Phys. Rev. B80, 125403 (2009).
[13] R. Bennewitz, V. Barwich, M. Bammerlin, C. Loppacher, M. Guggisberg, A. Baratoff, E. Meyer, and H.-J.
Güntherodt,Surf. Sci.438, 289 (1999).
[14] See Supplemental Material at http://link.aps.org/
supplemental/10.1103/PhysRevLett.117.146102for the analysis of the temperature-dependent diffusion and the movies created from STM image sequences, which includes Refs. [15–19].
[15] G. Kellogg,Surf. Sci. Rep.21, 1 (1994).
[16] B. S. Swartzentruber,Phys. Rev. Lett.76, 459 (1996).
[17] J. D. Wrigley, M. E. Twigg, and G. Ehrlich,J. Chem. Phys.
93, 2885 (1990).
[18] D. C. Senft and G. Ehrlich,Phys. Rev. Lett.74, 294 (1995).
[19] H. Ibach, Physics of Surfaces and Interfaces (Springer- Verlag, Berlin, 2006).
[20] M. H. Hakala, O. H. Pakarinen, and A. S. Foster,Phys. Rev.
B78, 045418 (2008).
[21] T. R. Linderoth, S. Horch, E. Lægsgaard, I. Stensgaard, and F. Besenbacher,Phys. Rev. Lett.78, 4978 (1997).
[22] R. Otero, F. Hummelink, F. Sato, S. B. Legoas, P. Thostrup, E. Laegsgaard, I. Stensgaard, D. S. Galvao, and F.
Besenbacher,Nat. Mater.3, 779 (2004).
[23] M. Schunack, T. R. Linderoth, F. Rosei, E. Lægsgaard, I.
Stensgaard, and F. Besenbacher,Phys. Rev. Lett.88, 156102 (2002).
[24] A NaCl=Cu lattice-constant ratio of 1.532 and a relative alignment angle between the two grids of 22.25° (nonpolar versus close-packed directions) were obtained as best fit parameters.
[25] The distance of 0.39 Å was arbitrarily chosen to fit the observed pattern.
[26] N. Nilius, E. D. L. Rienks, H.-P. Rust, and H.-J. Freund, Phys. Rev. Lett.95, 066101 (2005).
[27] A. T. N’Diaye, S. Bleikamp, P. J. Feibelman, and T. Michely,Phys. Rev. Lett.97, 215501 (2006).
[28] J. Mao, H. Zhang, Y. Jiang, Y. Pan, M. Gao, W. Xiao, and H.-J. Gao,J. Am. Chem. Soc.131, 14136 (2009).
[29] J. Lu, P. S. E. Yeo, Y. Zheng, Z. Yang, Q. Bao, C. K. Gan, and K. P. Loh, ACS Nano6, 944 (2012).
[30] K. Wu, H. Zhang, Y. Wang, Y. Lu, Y. Cai, J. Song, H. Li, S. Bao, and P. He, Nanotechnology 24, 215302 (2013).
[31] Y. Han and J. W. Evans, J. Chem. Phys. 143, 164706 (2015).
[32] J. Repp, G. Meyer, K.-H. Rieder, and P. Hyldgaard,Phys.
Rev. Lett.91, 206102 (2003).
[33] I. Scivetti and M. Persson,J. Phys. Condens. Matter 25, 355006 (2013).
[34] I. Scivetti and M. Persson,J. Phys. Condens. Matter 26, 135003 (2014).
[35] G. Kresse and D. Joubert,Phys. Rev. B59, 1758 (1999).
[36] P. E. Blöchl,Phys. Rev. B50, 17953 (1994).
[37] J. Klimeš, D. R. Bowler, and A. Michaelides,Phys. Rev. B 83, 195131 (2011).
[38] M. Dion, H. Rydberg, E. Schröder, D. C. Langreth, and B. I.
Lundqvist,Phys. Rev. Lett.92, 246401 (2004).
[39] T. Thonhauser, V. R. Cooper, S. Li, A. Puzder, P. Hyldgaard, and D. C. Langreth,Phys. Rev. B76, 125112 (2007).
[40] G. Román-Pérez and J. M. Soler, Phys. Rev. Lett. 103, 096102 (2009).
[41] The PAW potential for the Na atom included thepsemicore.
The plane wave energy cutoff was 400 eV. The surface Brillouin zone was sampled using a 2×2kpoint grid.
[42] The experimental literature value of aB and the value calculated in this work are 3.988 and 3.971 Å, respectively.
[43] G. Mills, H. Jónsson, and G. K. Schenter,Surf. Sci.324, 305 (1995).
[44] This value includes repulsive dipole-dipole corrections between periodic images. This correction was confirmed for hollow and top sites using a larger surface unit cell with 36 Na and 36 Cl ions in each layer.
[45] S. W. Wu, N. Ogawa, and W. Ho, Science 312, 1362 (2006).
[46] S. W. Wu, N. Ogawa, G. V. Nazin, and W. Ho, J. Phys.
Chem. C112, 5241 (2008).
[47] I. Swart, T. Sonnleitner, and J. Repp,Nano Lett.11, 1580 (2011).