doi: 10.3389/fncel.2017.00050
Edited by:
Greg Stuart, Australian National University, Australia
Reviewed by:
Alon Korngreen, Bar-Ilan University, Israel Josef Bischofberger, University of Basel, Switzerland
*Correspondence:
Veronica Egger veronica.egger@ur.de
Received: 02 November 2016 Accepted: 14 February 2017 Published: 28 February 2017
Citation:
Ona-Jodar T, Gerkau NJ, Sara Aghvami S, Rose CR and Egger V (2017) Two-Photon Na
+Imaging Reports Somatically Evoked Action Potentials in Rat Olfactory Bulb Mitral and Granule Cell Neurites.
Front. Cell. Neurosci. 11:50.
doi: 10.3389/fncel.2017.00050
Two-Photon Na + Imaging Reports Somatically Evoked Action Potentials in Rat Olfactory Bulb Mitral and
Granule Cell Neurites
Tiffany Ona-Jodar
1, Niklas J. Gerkau
2, S. Sara Aghvami
1,3,4, Christine R. Rose
2and Veronica Egger
1,5*
1
Neurophysiology, Institute of Zoology, Universität Regensburg, Regensburg, Germany,
2Institute of Neurobiology, Heinrich-Heine-Universität Düsseldorf, Düsseldorf, Germany,
3School of Electrical and Computer Engineering, University of Tehran, Tehran, Iran,
4School of Cognitive Science, Institute for Research in Fundamental Science, Tehran, Iran,
5
Regensburg Center of Neuroscience, Universität Regensburg, Regensburg, Germany
Dendrodendritic synaptic interactions are a hallmark of neuronal processing in the vertebrate olfactory bulb. Many classes of olfactory bulb neurons including the principal mitral cells (MCs) and the axonless granule cells (GCs) dispose of highly efficient propagation of action potentials (AP) within their dendrites, from where they can release transmitter onto each other. So far, backpropagation in GC dendrites has been investigated indirectly via Ca 2+ imaging. Here, we used two-photon Na + imaging to directly report opening of voltage-gated sodium channels due to AP propagation in both cell types. To this end, neurons in acute slices from juvenile rat bulbs were filled with 1 mM SBFI via whole-cell patch-clamp. Calibration of SBFI signals revealed that a change in fluorescence 1 F/F by 10% corresponded to a 1 [Na + ] i of ∼ 22 mM. We then imaged proximal axon segments of MCs during somatically evoked APs (sAP).
While single sAPs were detectable in ∼ 50% of axons, trains of 20 sAPs at 50 Hz always resulted in substantial 1 F/F of ∼ 15% ( ∼ 33 mM 1 [Na + ] i ). 1 F/F was significantly larger for 80 Hz vs. 50 Hz trains, and decayed with half-durations τ 1 / 2 ∼ 0.6 s for both frequencies. In MC lateral dendrites, AP trains yielded small 1 F/F of ∼ 3% ( ∼ 7 mM 1 [Na + ] i ). In GC apical dendrites and adjacent spines, single sAPs were not detectable.
Trains resulted in an average dendritic 1 F /F of 7% (16 mM 1 [Na + ] i ) with τ 1 / 2 ∼ 1 s, similar for 50 and 80 Hz. Na + transients were indistinguishable between large GC spines and their adjacent dendrites. Cell-wise analysis revealed two classes of GCs with the first showing a decrease in 1 F/F along the dendrite with distance from the soma and the second an increase. These classes clustered with morphological parameters.
Simulations of 1 [Na + ] i replicated these behaviors via negative and positive gradients in Na + current density, assuming faithful AP backpropagation. Such specializations of dendritic excitability might confer specific temporal processing capabilities to bulbar principal cell-GC subnetworks. In conclusion, we show that Na + imaging provides a valuable tool for characterizing AP invasion of MC axons and GC dendrites and spines.
Keywords: olfactory bulb, granule cell, mitral cell axon, active dendrites, sodium transient, two-photon imaging, SBFI
Abbreviations: EPL, external plexiform layer; GC, granule cell; MC, mitral cell; MCL, mitral cell layer; SVR, surface to
volume ratio; TC, tufted cell.
INTRODUCTION
Many neuronal interactions in the vertebrate olfactory bulb are mediated by dendrodendritic synapses at both stages of the olfactory network, the glomerular input layer and the EPL. Accordingly, the dendrites of many classes of olfactory bulb neurons dispose of several mechanisms that support dendrodendritic processing, including release of transmitter (Sheperd et al., 1990; Wachowiak and Shipley, 2006). In particular, bulbar dendrites often are endowed with high densities of active conductances since they feature an efficient propagation of action potentials.
The principal MCs and the axonless GCs are especially interesting because they interact via dendrodendritic reciprocal synapses and thus both rely on dendritic transmitter release to exchange information. The specific functional consequences of this local interaction are not fully resolved yet. MC dendrites are accessible to whole-cell patch-clamp; in combination with Ca 2 + and voltage-sensitive dye imaging it has been shown that (1) action potentials can be initiated in their apical dendritic tuft and then propagate to the soma and that (2) under certain conditions action potentials will travel far out into their lateral dendrites (Chen et al., 1997; Margrie et al., 2001; Xiong and Chen, 2002;
Christie and Westbrook, 2003; Debarbieux et al., 2003; Djurisic et al., 2004).
So far, propagation in GC dendrites has been investigated only indirectly via Ca 2 + imaging (Egger et al., 2003; Zelles et al., 2006), since the small sizes of their dendrites and soma have precluded dendritic patching and voltage-sensitive dye imaging. Therefore other techniques such as Na + imaging might yield useful additional information on their active properties.
This approach has been introduced by Jaffe et al. (1992) and Ross et al. (1993), who used the fluorescent Na + -indicator SBFI for detection of Na + influx through voltage-gated sodium channels (Na v ) and thereby provided first direct evidence for active backpropagation of action potentials into dendrites of hippocampal CA1 pyramidal neurons. Later on, two-photon imaging with SBFI demonstrated the existence of Na + transients in response to backpropagating action potentials in dendritic spines of CA1 neurons (Rose et al., 1999). Na + imaging also allows detection of Na + influx into active axons (Kole et al., 2008;
Bender and Trussell, 2009; Fleidervish et al., 2010; Scott et al., 2014; Miyazaki and Ross, 2015).
Olfactory bulb GCs represent a special case since they do not bear a classical axon. Rather, their only output occurs onto MC and tufted cell (TC) lateral dendrites from their apical dendrite (Price and Powell, 1970). While this neurite bears spines, it also exhibits many properties of axons for which Na v play a particularly important functional role. GC dendrites are known to dispose of Na v -dependent backpropagation that can be blocked by TTX (Egger et al., 2003), and show dendritic Na + spikelets both in vitro and in vivo (Mori and Takagi, 1978; Wellis and Scott, 1990; Luo and Katz, 2001; Pinato and Midtgaard, 2005;
Zelles et al., 2006; Labarrera et al., 2013; Burton and Urban, 2015).
There is also accumulating evidence for an essential role of Na v in reciprocal processing at the GC spine, where their local activation triggered by AMPAR-mediated EPSPs can further depolarize the
spine to activate the classical voltage-gated presynaptic N/P/Q Ca 2 + channels (Bywalez et al., 2015). Thus it seems likely that GC APs evoke robust Na + signals detectable by Na + imaging in both apical GC dendrites and spines.
Based on this assumption, we chose to probe dendritic Na + signaling in MCs and GCs using both single APs and short AP trains at frequencies of 50 and 80 Hz, which correspond to the maximal frequencies of network oscillations in the olfactory bulb that dendrodendritic MC-GC synapses are involved in (slow and fast gamma range, e.g., Manabe and Mori, 2013). Our main aim was to further elucidate the active properties of GC apical dendrites via direct observation and characterization of AP-evoked Na + signals.
MATERIALS AND METHODS Animals and Slice Preparation
Rats were decapitated under deep anesthesia with isoflurane according to the stipulations of the German law governing animal welfare (Tierschutzgesetz) and according to the EU directive 2010/63/EU, as approved by the Bavarian state government (Regierung von Oberbayern). Brains were removed and horizontal olfactory bulb brain slices (300 µ m thick) were prepared of juvenile wild-type (Wistar) of either sex (postnatal days 11 – 18). The slices were incubated in artificial cerebrospinal fluid (ACSF, composition: 125 mM NaCl, 26 mM NaHCO 3 , 1.25 mM NaH 2 PO 4 , 20 mM glucose, 2.5 mM KCl, 1 mM MgCl 2 , and 2 mM CaCl 2 ) infused with carbogen gas (95% O 2 , 5% CO 2 ) in a heated water bath at 33 ◦ C for 30 min and then kept at room temperature (22 ◦ C) until experimentation.
Two-Photon Imaging and Electrophysiology
Fluorescence was recorded by two-photon laser scanning microscopy (TPLSM) on a Femto-2D microscope (Femtonics, Budapest, HU), equipped with a tunable, Verdi-pumped Ti:Sa laser (Chameleon Ultra I, Coherent, Glasgow, Scotland). The microscope was equipped with a 60 × Nikon Fluor water- immersion objective (NA 1.0; Nikon Instruments, Melville, NY, USA), and controlled by MES v4.5 software (Femtonics).
GC and MC somata were patched in whole-cell mode with patch pipettes (resistance 4–5 MOhm), filled with an intracellular saline (composition: 130 mM K-methylsulfate, 10 mM HEPES, 4 mM MgCl 2 , 2.5 mM Na 2 ATP, 0.4 mM NaGTP, 10 mM Na-phosphocreatine, 2 mM ascorbate, 1 mM SBFI (sodium-binding benzofuran isophthalate, Teflabs, Austin, TX and Molecular Probes, Eugene, OR, USA)) at pH 7.3.
Electrophysiological recordings were made with an EPC-10 amplifier using Patchmaster software (both HEKA Elektronik, Lambrecht/Pfalz, Germany).
All experiments were performed at room temperature (22 ◦ C).
The patched MCs and GCs were held in current-clamp mode near
their resting potential of − 60 and − 70 mV, respectively, and the
access resistance was monitored. Polarizing step pulses for 500 ms
each (first step − 90 pA, increased by + 50 pA for 10 steps, ending
at + 180 pA) were applied in order to identify the targeted cell
type via its firing pattern. During Na + imaging experiments, cells with a holding current value above − 25 pA for GCs and above
− 50 pA for MCs were rejected.
For Na + imaging, the excitation wavelength of the laser was set to 800 nm and cells were loaded with 1 mM SBFI via the patch pipette. After sufficient filling of the dendritic tree (at least 15 min past establishment of the whole-cell configuration), structures of interest were imaged in free line-scanning mode with a temporal resolution of ∼ 0.5 ms. At a given dendritic location, several consecutive focal line-scans were recorded during either somatically evoked single action potentials (sAPs) (evoked by an injected current step of 1000 pA) or action potential trains (20 steps at 50 Hz or 80 Hz). To ensure reliable AP induction, current steps had a duration of 5 ms. The duration of the scanning was set to 3.5–5.0 s depending on the decay time course of the Na + transients. Transients recorded sequentially at the same location were averaged and smoothed post hoc.
Post hoc data analysis was performed using custom macros written in IGOR Pro 7 (Wavemetrics, Lake Oswego, OR, USA) and OriginPro (OriginLab Corporation, Northampton, MA, USA). To correct for dye bleaching, Na + imaging was periodically performed without stimulation, during phases of low postsynaptic spontaneous activity. An exponential decay curve was fitted to these data and then subtracted from the traces during which a stimulation was performed.
Dendritic Na + transients, reflected by decreases in fluorescence emission 1 F/F, were analyzed relative to the resting fluorescence F 0 , with their decay measured in terms of half-duration τ 1/2 (Egger et al., 2003). τ 1/2 values were capped at 3 s, because a higher value could not be reliably extrapolated. Rise times of transients were analyzed in terms of the time interval from 20 to 80% of the maximal 1 F/F amplitude.
At the end of individual experiments, the neurites were imaged in a z-stack both in the fluorescence and the infrared channel of the TPLSM. Distance measurements were performed using Fiji’s Neurite Simple Tracer plugin (Longair et al., 2011) from z-stack scans of patched cells. The first initial branching of the neurite from the soma was selected as the starting point for the measurement. From that point on, the dendrite was traced in 3D up to the imaged scan line or its first branchpoint and the length of this tracing was determined. The distance of GC somata from the lower border of the MCL was determined in scans imaged in the infrared channel of the TPLSM.
Simulations
The NEURON simulation tool (Release 7.4, Carnevale and Hines, 2006) was used with Python (Hines et al., 2009) to construct a simple compartmental model of the GC apical dendrite for a simulation of Na + entry. Geometric dimensions were based on previous data (mean diameter of distal GC dendrite 1.2 µm, Egger and Stroh, 2009) and on two-photon fluorescence scans of the neurons in this data set (diameter of proximal segment for decreasing cells 2.7 ± 0.2 µ m, n = 6 GCs; for increasing cells 2.7 ± 0.4 µ m, n = 4). The model consists of 11 connected cylindrical compartments, with the first representing the soma (10 µ m diameter and length) and the 10 others a dendrite with
linear taper from 2.7 to 1.2 µ m or 2.0 to 1.2 µ m depending on the cell subtype and 200 µ m total dendritic length.
In addition to the passive parameters (R m = 5000 cm 2 , R i = 100 cm, C m = 1 µ F/cm 2 ) the model was equipped with two active conductances for Na + and K + channels (g Na and fast g K as in Zylbertal et al., 2015), and radial and longitudinal diffusion for Na + (as in Zylbertal et al., 2015). The stimulation was implemented as the experimental 50 Hz train of 1000 pA current injections. The basal sodium concentration was set to 15 mM.
Core assumptions of the model were
(i) faithful propagation of AP trains into proximal and distal dendrite which is in part supported by Ca 2 + imaging data (Egger et al., 2003, but see Discussion).
(ii) g Na and g K models as above, which are unlikely to perfectly capture physiological Na + entry itself; both the precise channel kinetics in general and the detailed Na v /K v subtype composition in GC dendrites are not known, therefore we used the model to estimate current densities rather than densities of fictive channels.
(iii) a fixed ratio of g Na /g K throughout all compartments (as in Zylbertal et al., 2015).
(iv) linear gradients in g Na density along the dendrite.
The source code for this model is available from ModelDB
1as model entry 225086.
Statistical Analysis
Statistics were performed with the VassarStats online software
2. The non-parametric Mann–Whitney test was used for all comparisons between two groups except for paired data [e.g., for ( 1 F/F) 50Hz and ( 1 F/F) 80Hz at the same location, or spines and their adjacent dendrite] where the Wilcoxon pair test was used. For correlations, a linear regression analysis was utilized to determine r-values. A cluster analysis of GC properties was performed using the online tool ClustVis (Metsalu and Vilo, 2015), after normalizing the individual parameter values for each property onto the range 0 – 1. Data are presented as mean values of parameters ± standard deviation (SD), unless indicated otherwise.
RESULTS
Calibration and General Approach
To allow for the conversion of fluorescence decrements detected by our TPLSM into absolute changes in intracellular [Na + ], we calibrated SBFI fluorescence signals from cells in olfactory bulb slices following a procedure described earlier (Rose et al., 1999;
Meier et al., 2006). Such an in situ calibration is required because the properties of SBFI change in intracellular environments, most likely because of increased viscosity. For example, SBFI fluorescence absorption spectra show a significant blue shift when loaded inside cells (e.g., Langer and Rose, 2009). In addition, its
1
https://senselab.med.yale.edu/ModelDB
2
http://vassarstats.net/
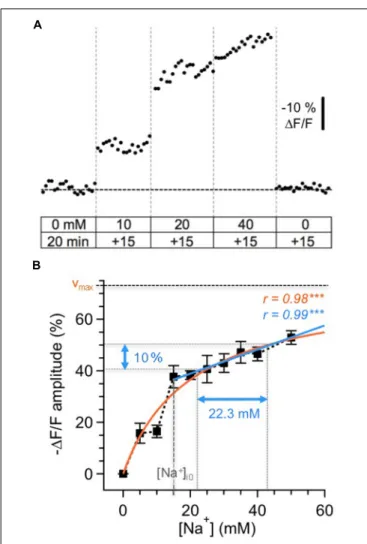
FIGURE 1 | Calibration of SBFI fluorescence. (A) Calibration of the Na
+sensitivity of SBFI in GC somata in acute tissue slices of the olfactory bulb.
Cells were bolus-loaded with the AM-form of SBFI and afterwards subjected to different calibration solutions containing ionophores, the Na
+/K
+-ATPase inhibitor ouabain and different Na
+concentrations as indicated. Stepwise changes in the extracellular [Na
+] from 0 to 50 mM for 15 min each and back caused stepwise changes in the fluorescence of SBFI. The trace represents an average from 12 cells obtained in one experiment. (B) Relationship between changes in the fluorescence of SBFI and intracellular sodium concentration [Na
+]
i, normalized to the fluorescence level in Na
+-free saline (0 mM). Shown are mean values ± SEM (n = 54 cells, five slices, three animals). The orange line represents a Michaelis–Menten fit of all the data (v
max= 73.5%, K
D= 20.2 mM). The blue line represents a linear fit of the data obtained between 15 and 50 mM [Na
+]
i. Within this range, a 10% change in fluorescence emission of SBFI corresponds to a change of 22.3 mM in [Na
+]
i.
K + sensitivity is significantly decreased as compared to in vitro calibrations (e.g., Rose and Ransom, 1996; Meier et al., 2006).
For calibration, cells were loaded by bolus injection with the membrane-permeable form of SBFI (SBFI-AM) into the GC layer and MC layer (MCL) as reported earlier for other brain regions (Langer and Rose, 2009; Karus et al., 2015).
Next, equilibration of intra- and extracellular Na + concentration was achieved by perfusing SBFI-loaded slices with calibration solutions containing ionophores (3 µ M gramicidin D and 10 µ M monensin) and the Na + /K + -ATPase blocker ouabain (100 µ M).
Slices were then perfused with calibration salines containing different Na + concentrations and resulting changes in SBFI fluorescence were recorded (n = 54 cells; five slices, three animals; cf. Figures 1A,B). As reported earlier (Rose et al., 1999;
Meier et al., 2006; Mondragao et al., 2016), changes in relative fluorescence levels were highly correlated to changes in [Na + ] i concentrations, with increasing [Na + ] causing a decrease in fluorescence emission of SBFI.
The changes in relative fluorescence (F/F o ) against [Na + ] i
could be fit by a Michaelis–Menten relationship (r = 0.98), revealing an apparent K D of 20.2 mM and a maximal change in fluorescence of v max = 73.5%. This observation indicates that SBFI fluorescence starts to saturate at levels well beyond 50 mM [Na + ] i , and is thus well suited to report [Na + ] i changes within the physiological range.
Pipette [Na + ] was 15 mM in our experiments. Under the assumption that this concentration also represented the baseline [Na + ] i of patch-clamped neurons, a linear correlation was extrapolated for [Na + ] i between 15 and 50 mM (r = 0.99, P < 0.001), with − 10% 1 F/F corresponding to an increase 1 [Na + ] i of 22.3 mM. Because our study only reports increases in [Na + ] i rising from the assumed baseline of 15 mM, we chose this simple linear correlation (the r-value of which was even slightly higher than that of the Michaelis–Menten plot), to convert changes in SBFI fluorescence to changes in [Na + ] i . Importantly, and in contrast to the situation if a Michaelis–
Menten relationship is applied, this linearization renders data conversion independent from the actual baseline levels, which – in active neurons undergoing axonal and dendritic sodium influx – might be higher that the presumed baseline of 15 mM.
Throughout the remainder of this study, neurons were filled with 1 mM of SBFI in the whole-cell configuration and stimulated with somatic current injections to generate either single APs or trains of 20 APs at 50 Hz or 80 Hz (train duration 400 ms and 250 ms, respectively; see Figure 2A).
Mitral Cell Axons and Dendrites
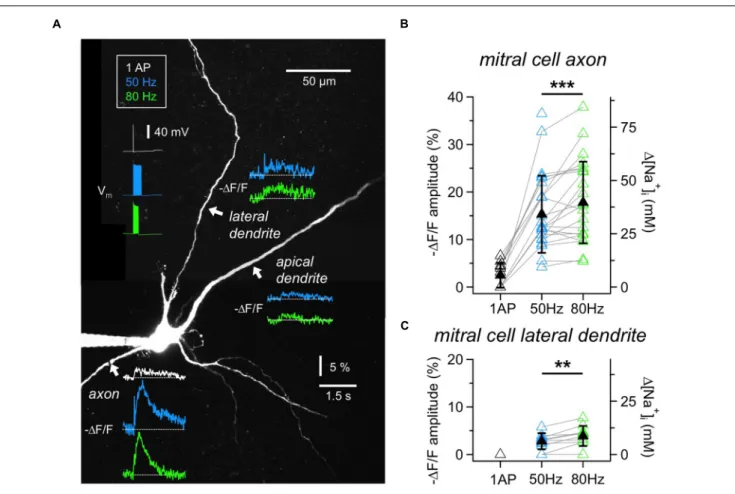
To establish measurements of Na + transients, we first imaged the initial segment of MC axons (Figures 2A,B). Single APs elicited detectable axonal 1 F/F changes in 6 out of 11 MCs tested (responding axons: mean ( 1 F/F) AP = 4.7 ± 1.2%, corresponding to roughly 10 mM 1 [Na + ] i ). In our set of experiments the detection threshold was ∼ 2% 1 F/F, corresponding to 4 mM 1 [Na + ] i . All axons showed substantial fluorescence changes in response to trains of 50 Hz (n = 25 cells, mean (1F/F) 50 Hz = 15.3 ± 8.1%, corresponding to 34 mM 1[Na + ] i ) and 80 Hz (n = 24, mean ( 1 F/F) 80 Hz = 17.8 ± 8.6%, corresponding to 40 mM 1 [Na + ] i ), at a mean distance from the soma of 34 ± 14 µ m. We chose to image the axon not too close to the MC soma since we observed that more proximal measurements yielded smaller 1F/F measurements (n = 3 MCs).
While peak amplitudes of Na + transients measured at the same
axonal location increased significantly at 80 Hz as compared to
the 50 Hz stimulation (n = 22, mean ratio 80/50 = 1.25 ± 0.33,
P < 0.005, Wilcoxon test, Figure 2B), the transients decayed with
indistinguishable half-durations of τ 1/2_50 Hz = 0.61 ± 0.45 s and
τ 1/2_80 Hz = 0.60 ± 0.51 s (not shown).
FIGURE 2 | Na
+signals in MC axons and dendrites. (A) Two-photon scan of a representative MC filled with 1 mM SBFI. Averaged voltage traces of the three stimulation protocols (1 AP, 20 APs at 50 or 80 Hz, train duration 400 ms or 250 ms) as recorded from the soma are shown in the upper left. Averaged fluorescence transients were imaged at the locations indicated with white arrows. Fluorescence changes in response to single APs could only be detected in the axon.
(B) Cumulative 1 F/F amplitude data for MC axons (n = 26 cells) and (C) lateral dendrites (n = 12 cells). Open symbols: individual data, solid black symbols:
averaged data ± SD. Data recorded from the same location are indicated by gray connecting lines.
∗∗P < 0.01;
∗∗∗P < 0.005.
We also investigated Na + transients in MC lateral dendrites because of their involvement in the reciprocal microcircuits with GCs (Figures 2A,C). The measurement locations were on average 66 ± 34 µ m distal from the soma (n = 12). Single APs did not evoke detectable changes in SBFI fluorescence.
Trains of APs induced small, but reliable fluorescence changes in the majority of cells (50 Hz: n = 10 out of 12 cells, mean ( 1 F/F) 50 Hz = 3.2 ± 1.1% or 7 mM 1 [Na + ] i ; 80 Hz: n = 9 out of 10, mean ( 1 F/F) 80 Hz = 4.4 ± 1.7% or 10 mM 1 [Na + ] i ). Again, peak amplitudes significantly increased between 50 and 80 Hz at the same location (n = 8, mean ratio 80/50 = 1.43 ± 0.35, P < 0.01, Figure 2C). The transients decayed with similar half-durations of τ 1/2_50 Hz = 0.91 ± 0.64 s and τ 1/2_80 Hz = 0.88 ± 0.57 s. Because of the small size of transients we did not explore the propagation of signals along the lateral dendrites.
Finally, in MC proximal apical dendrites (n = 8 cells, mean distance from the soma 58 ± 44 µ m) fluorescence changes in response to trains were barely detectable, on the order of 4 mM 1 [Na + ] i (Figure 2A; 50 Hz: n = 2 out of 8 cells tested, mean ( 1 F/F) 50 Hz = 2.0 ± 0.7%; 80 Hz: n = 4 out of 7, mean ( 1 F/F)
80 Hz = 2.2 ± 0.5%), not warranting further investigation.
Granule Cell Apical Dendrites
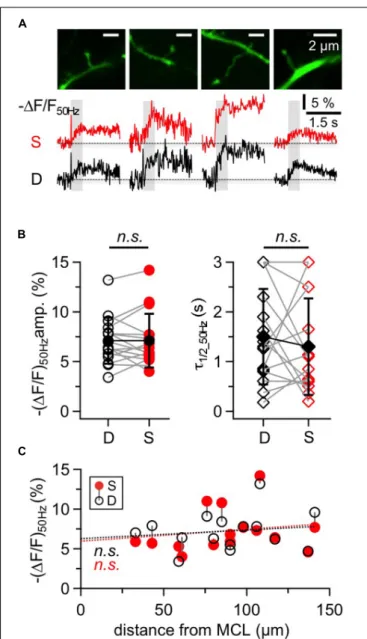
In GC apical dendrites, responses to single APs could not be resolved (tested in five cells), while fluorescence changes upon 50 Hz trains could be detected in almost all locations tested (in 62 out of 65 locations in 37 GCs; mean ( 1 F/F) 50 Hz = 6.9 ± 3.3%, corresponding to 15 mM 1[Na + ] i ; Figure 3), at an average distance from the soma of 75 ± 42 µ m.
Compared to the MCs’ responses to 50 Hz AP trains, dendritic GC Na + transients were significantly smaller and slower than MC axonal transients (( 1 F/F) 50Hz : P < 0.0001, τ 1/2_50Hz : P < 0.0005) and significantly larger than MC lateral dendrite transients (P < 0.001) with no detectable difference in τ 1/2_50Hz .
Since 80 Hz trains did not yield significantly increased transients in GCs compared to 50 Hz trains (Figure 3B, n = 8 tested cells, ( 1 F/F) 50 Hz = 8.0 ± 3.1% vs.
( 1 F/F) 80 Hz = 7.2 ± 2.5%, mean ratio 80/50 = 0.92 ± 0.13, n.s.), we restricted experiments to 50 Hz in order to be able to conduct measurements in several dendritic locations in the same cell.
It has been reported before that GC Ca 2 + signals in response
to single APs increase with distance from soma and show a
plateau within the EPL (Egger et al., 2003). GC Na + signals in response to 50 Hz trains showed similar but less pronounced effects, since (1F/F) 50 Hz amplitudes were weakly positively correlated to the distance of the measurement location from the MCL border (Figure 3C, r = 0.33, P < 0.005; see also below).
Granule cell dendritic Na + transients (1F/F) 50 Hz decayed with a mean half duration of τ 1/2_50 Hz = 1.02 ± 0.59 s (n = 54 locations). Several distal locations showed half durations of ≥ 3 s (n = 12), which could not be properly determined due to the limited scan time and/or noise (Methods) and thus were not included in the above mean value. Overall, a correlation with distance was observed, with a clear trend for slow transients to occur in the distal parts of the dendrites (Figure 3C, r = 0.43, P < 0.001; see also GC in Figure 4B). The average rise time of ( 1 F/F) 50 Hz was t rise = 0.30 ± 0.12 s (n = 61 locations) and uncorrelated with distance from the soma (r = 0.24, P = 0.06), indicating that later APs within 50 Hz trains did not fail to invade distal parts of the dendrite (data not shown).
While the pooled data across all GCs and locations (Figure 3C) suggested a rather weak influence of dendritic location on Na + peak amplitude, analysis of distance versus ( 1 F/F) 50 Hz amplitude within individual GCs revealed a more refined picture (Figure 4). Here, we included all GCs with at least two dendritic measurement locations at a distance of ≥ 50 µ m between the first and last location.
We observed two different behaviors, with a subset of GCs showing a consistent decrease (n = 6 of 12 cells) and the remainder (n = 6 cells) a consistent increase of peak amplitudes, as shown in Figure 4C. The average linear slopes of each subtype’s pattern were similar except for their sign ( − 0.07 ± 0.04% 1 F/F per µm vs. 0.06 ± 0.04% 1F/F per µm). Interestingly, all the GCs with the increasing pattern except for one showed smaller Na + transients within the most proximal apical dendrite measurements (with respect to the MCL; < 5% 1 F/F or 11 mM 1 [Na + ] i ) whereas all GCs with the decreasing pattern showed larger proximal Na + transients ( > 5% 1 F/F; P < 0.025;
Figure 4C).
Since absolute concentration changes are tightly linked to dendritic SVRs and thus to dendritic morphology, we explored possible correlations between morphology and the observed Na + transient patterns. Because the morphologies of individual GCs could not always be fully recovered at the end of experiments, our analysis was restricted to the parameters that were available for all or most GCs. While we could not detect any significant link to branching itself, i.e., a systematic drop or increase in ( 1 F/F) 50Hz for measurement locations in front of versus beyond individual branch points, there were correlations between the slope of 1 F/F per µ m and the distance of the first branchpoint from the MCL and also between the slope and the diameter of the proximal dendrite (Figure 4D, r = 0.60, P < 0.025 and r = 0.89, P < 0.005). The location of the first branchpoint is indicative of the anatomical subtype of GC: small, compact GCs like the one in Figure 4A with early branching preferentially innervate the deep EPL, whereas GCs with dendrites innervating mostly higher levels of the EPL also usually show more distal first branch points (Mori et al., 1983; Orona et al., 1983; see Discussion).
FIGURE 3 | Na
+signals in GC apical dendrites. (A) Representative two-photon scans of apical dendritic segments from two GCs filled with 1 mM SBFI. The averaged fluorescence transients shown below were imaged at the locations indicated with white arrows. Train durations are indicated by the gray boxes. (B) Cumulative 1 F/F amplitude data for GC apical dendrites (n = 62 locations in 36 cells). Open symbols: individual data, solid black symbols:
averaged data ± SD. Data where responses to both 50 and 80 Hz AP trains were recorded from the same location are indicated by gray connecting lines (n = 8 cells). (C) Cumulative data for responses to 50 Hz trains recorded from GC apical dendrites plotted versus the distance of the recording location from the lower border of the MC layer. Top panel: 1 F/F amplitude, bottom panel:
1 F/F half duration τ
1/2. Lines: Linear fits of the data. Weak positive correlations were observed for both the amplitude and the half duration.
∗∗∗