olfactory bulb granule cells:
Thresholds for lateral inhibition and role of active conductances upon 3D multi-site photostimulation of spines
using a holographic projector module
Dissertation
Zur Erlangung des Doktorgrades der Naturwissenschaften (Dr. rer. nat.) der
Fakultät für Biologie und Vorklinische Medizin der Universität Regensburg
Vorgelegt von Max Müller aus Nördlingen
Januar 2020
- II -
- III -
Das Promotionsgesuch wurde eingereicht amDie Arbeit wurde angeleitet von Prof. Dr. Veronica Egger.
Unterschrift:
- IV -
- V -
Die GABAergen inhibitorischen axonlosen Körnerzellen (GCs) bilden über lange Dornfortsätze (Spines) reziproke dendrodendritische Synapsen mit Mitral- und Büschelzellen (MC/TCs), den wichtigsten Projektionsneuronen des Riechkolbens von Säugern (Bulbus Olfactorius, OB), aus.
Diese Synapsen vermitteln die Selbstinhibition von und laterale Inhibition zwischen MC/TCs.
Diese dient der Kontrastverstärkung zwischen ähnlichen Geruchssignalen und der Synchronisation oszillatorischer Aktivität. GCs sind also wesentlich an der Geruchssignalverarbeitung beteiligt. GC-Dendriten sind auf vielfältige Weise hoch erregbar:
Synaptische Inputs an einzelnen Spines können Natrium (Na
+)-vermittelte Zacken im Membranpotential (Spikes) erzeugen, die auf den Kopf des Spines begrenzt sind und zur reziproken Ausschüttung des Neurotransmitters GABA führen. Eine stärkere Aktivierung führt zu einer globalen Ausbreitung dendritischer Signale, die sowohl niederschwellige Kalzium (Ca
2+)- Spikes als auch Na
+-Spikes umfassen.
Da das Erreichen der globalen Schwellenpotentiale gleichzeitig das Erreichen der Schwelle zu lateraler Inhibition bedeutet, war das Ziel meiner Arbeit, den genauen Übergang von der lokalen zur globalen Signalgebung zu untersuchen: Wie viele Spines, in welcher Position und Verteilung auf dem dendritischen Baum, müssen aktiviert werden, um globale Spikes auszulösen und was sind die molekularen Hauptakteure, sprich welche Ionenkanäle sind beteiligt.
Um dies optimal zu untersuchen, haben wir im ersten Teil meiner Arbeit einen holographischen Projektor in das bestehende kommerzielle zwei-Photonen (2P) Galvanometer-basierte 2D-Laser- Scanning-Mikroskop mit einer Uncaging-Einheit (Uncaging: Aktivierung photolabiler biologisch inaktiver Derivate von Neurotransmittern mittels Photolyse) implementiert, der die gleichzeitige Photostimulation mehrerer Spines in drei Dimensionen (3D) in akuten Hirnschnitten ermöglicht.
2P-Uncaging in definierten Mustern mittels holographischer Illumination ist eine leistungsfähige
Methode zur Untersuchung neuronaler Funktion, da sie in der Lage ist, mehrere synaptische
Inputs in verschiedenen Brennebenen gleichzeitig zu emulieren. Wie bei jedem optischen System
haben jedoch auch holographische Projektoren ein begrenztes Produkt aus Raum und
Bandbreite, was den räumlichen Bereich – oder das Sichtfeld (FOV) – definierter Illumination für
eine gewünschte Auflösung einschränkt. Dieser Kompromiss zwischen holographischem FOV und
- VI -
Auflösung schränkt die Reichweite hochauflösender 2P-Uncaging an Spines auf einzelne Teile des dendritischen Baums ein. Wir erweitern das zugängliche FOV, indem wir mit Hilfe der Galvanometer-Scannerspiegel das holographische FOV beliebig über das abbildende FOV positionieren. Das Projektor-System nutzt die im Mikroskop integrierten Bildfunktionen. Die genauen Positionen der Stimulationspunkte können innerhalb eines erfassten 3D-Bildstapels ausgewählt werden (das Volumen von Interesse, VOI). Der holographische Projektor erzeugt dann 3D-Illuminationsmuster mit Hilfe von mehreren Uncaging Fokussen. Das bildgebende FOV unseres Systems ist 800×800 μm
2, innerhalb dessen ein holographisches VOI von 70×70×70 μm
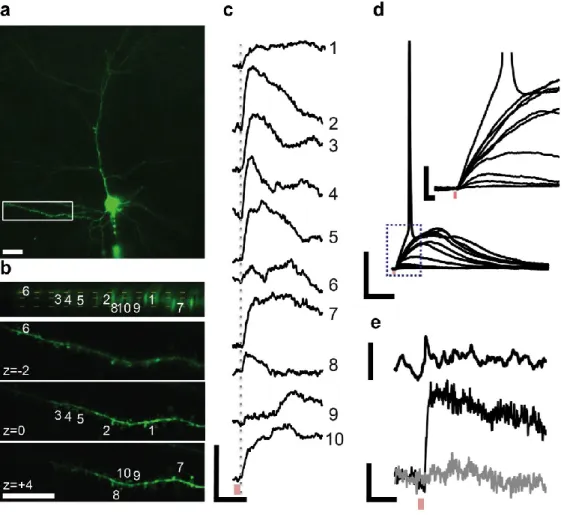
3an beliebigen Positionen ausgewählt und auch während des Experiments bewegt werden kann, ohne die Probe selbst zu bewegen. Wir beschreiben detailliert das Design und das Laserausrichtungsprotokoll sowie das individuell angepasste Software-Plugin, das die 3D- Positionierung von Stimulationspunkten steuert. Um die neurobiologische Anwendung grundsätzlich zu demonstrieren, habe ich die Funktion des holographischen Systems zuerst durch Photolyse von „caged“ Glutamat an den Spines entlang der basalen Dendriten kortikaler Pyramidenzellen (PC) in Hirnschnitten junger Ratten getestet. Über Patchpipetten am Zellkörper (Soma) wurden die Zellen mit kalziumempfindlichem Fluoreszenzfarbstoff (OGB-1) gefüllt und elektrische Potentiale aufgezeichnet. Simultanes Uncaging von Glutamat an mehreren Spines führte zur supralinearen Summation postsynaptischer Potentiale am Soma und schließlich zu Aktionspotentialen. Gleichzeitig zeigte ich die Möglichkeit einer 2P-Ca
2+-Bildgebung in 2D im Dendriten und ausgewählten Spines, um damit synaptischen Ca
2+Einfluss, sowie lokale regenerative Ereignisse wie lokale dendritische Spikes aufzuzeichnen.
Im zweiten Teil meiner Arbeit wendete ich das System zur Untersuchung dendritischer
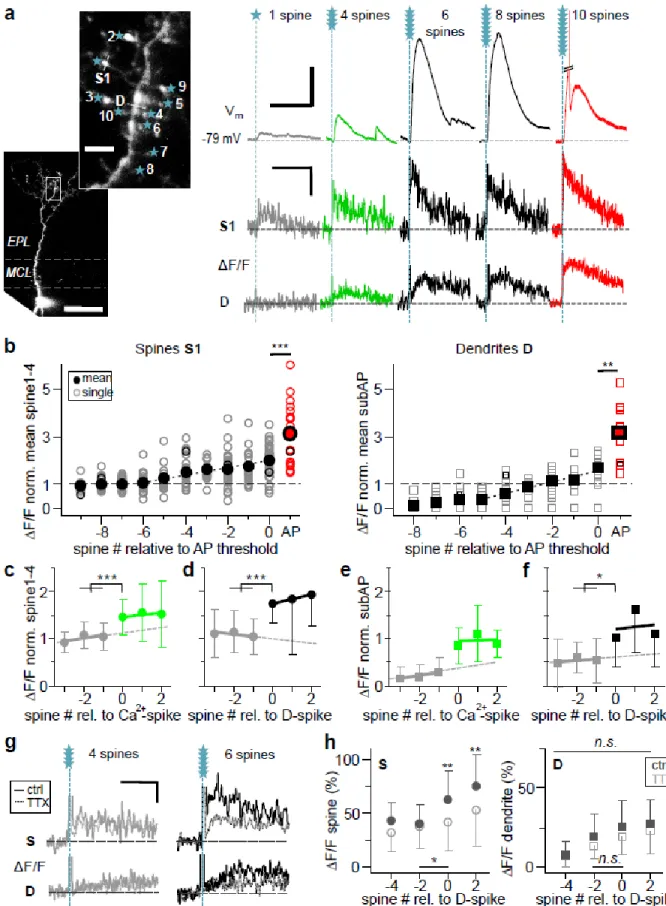
Integration in GCs an. Wir stellten fest, dass weniger als 10 simultan aktivierte
dendrodendritische Spines ausreichen, um lokale und globale dendritische Signale zu erzeugen,
die auch lokale Ca
2+-Spikes und Na
+-Spikes (D-spikes) beinhalten. Obwohl das GC-Ruhepotential
im Vergleich zu PCs um ca. -10 mV hyperpolarisiert ist, benötigt das Erreichen des AP-
Schwellenpotentials eine ähnliche Anzahl von aktivierten Spines (9,0 ± 1,6 in GCs vs 10 ± 1 in PCs),
wobei 5,5 ± 2,1 aktivierte Spines bereits ausreichen, um einen lokalen Ca
2+-Spike auszulösen. Die
dendritische Integration unterhalb der AP-Schwelle ist meist linear. Bei der Stimulation von 6,5 ±
- VII -
auftraten. Einzelne Spines können die Übergänge zwischen den drei Spikes durch schrittweise erhöhten Ca
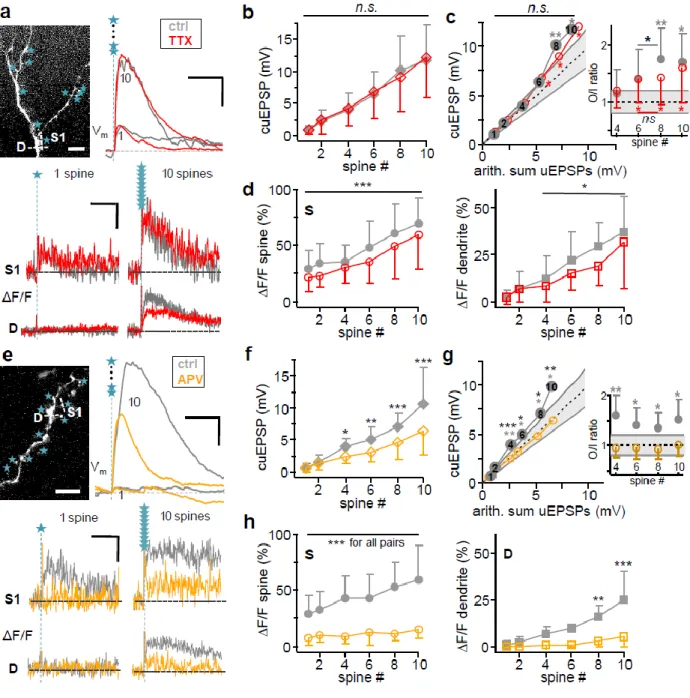
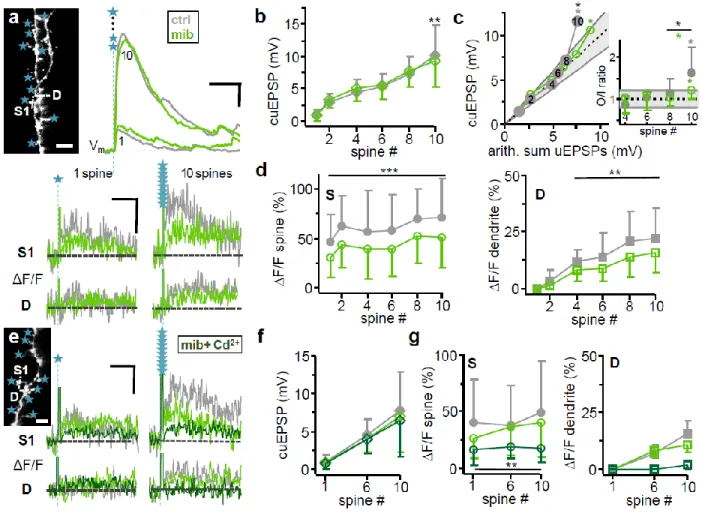
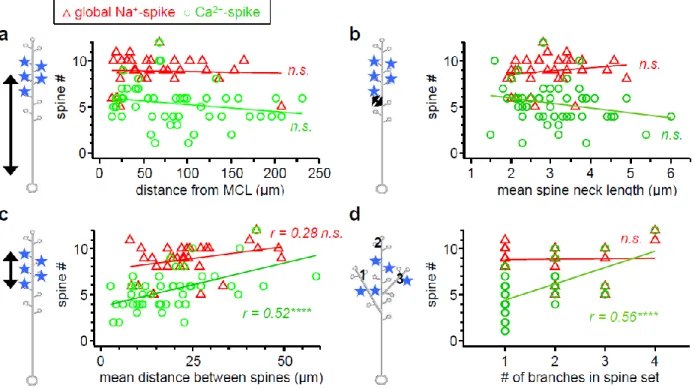
2+-Einfluss erfassen, was vermutlich zur Erhöhung der Freisetzungswahrscheinlichkeit von GABA führt. Außerdem bewirken die einzelnen Spikes eine zunehmend größere Ausbreitung im Dendriten, was zeigt, dass GCs, abhängig vom Input, zu kompartmentalisierter und globaler Signalgebung fähig sind. Durch pharmakologisches Blockieren verschiedener Ionenkanäle zeigten wir, dass NMDA-Rezeptoren stark zur aktiven Integration beitragen. Morphologische Parameter und die Verteilung der aktivierten Spines auf dem Dendriten spielen dagegen kaum eine Rolle.
Zusammenfassend ist festzustellen, dass Dendriten von GCs zu komplexen Rechenleistungen
fähig und Schwellenwerte für die GC-vermittelte laterale Inhibition niedrig sind.
- VIII -
- IX -
This cumulative dissertation is composed of the following published or submitted manuscripts, in which I am either first or shared co-first author:
A. Go, M.A., Mueller, M., Castanares, M.L., Egger, V., and Daria, V.R. (2019). A compact holographic projector module for high-resolution 3D multi-site two-photon photostimulation. PLoS One 14, e0210564.
B.
Mueller, M., Egger, V. (2020). Dendritic integration in olfactory bulb granule cells:Thresholds for lateral inhibition and role of active conductances upon simultaneous activation. In submission for publication, preprint on BioRxiv.
In the course of this work, I contributed to a further publication, which is not part of the dissertation:
C. Aghvami, S.S., Mueller, M., Araabi, B.N., and Egger, V. (2019). Coincidence Detection
within the Excitable Rat Olfactory Bulb Granule Cell Spines. J Neurosci 39, 584-595.
- X -
- XI -
Publication AThe research was designed by myself, Mary Ann Go, Veronica Egger and Vincent R. Daria.
Incorporation of the holographic projector module was done by myself, Mary Ann Go and Michael L. Castañares. Development of the custom software was done by Mary Ann Go.
Experimental work was done by myself. The work was supervised by Veronica Egger and Vincent R. Daria, and the publication was written by myself, Mary Ann Go, Michael L. Castañares, Veronica Egger and Vincent R. Daria.
Publication B
The research was designed and the experimental work was performed by myself. The work was supervised by Veronica Egger. The publication was written by myself and Veronica Egger.
Publication C
The research was designed by Veronica Egger and Sara S. Aghvami. The experimental work was
designed and performed by myself. Simulations were done by Sara S. Aghvami. The work was
supervised by Veronica Egger. The publication was written by Sara S. Aghvami and Veronica
Egger.
- XII -
- XIII -
KURZFASSUNG DER ARBEIT ... V LIST OF PUBLICATIONS ... IX PERSONAL CONTRIBUTIONS ... XI TABLE OF CONTENTS ...XIII
1 GENERAL INTRODUCTION ... 1
1.1 Olfaction ... 1
1.1.1 From the nasal cavity to the cortex: an overview ... 2
1.1.2 The main olfactory bulb ... 4
1.1.2.1 Mitral and tufted cells ... 7
1.1.2.2 Excitation, inhibition and modulation in the OB ... 8
1.1.3 Olfactory bulb granule cells ... 10
1.1.3.1 Granule cell- types ... 12
1.1.3.2 Functions of granule cells: recurrent and lateral inhibition ... 13
1.1.3.3 Behavioral functions of granule cells ... 15
1.1.4 Oscillations in the olfactory bulb ... 16
1.2 Excitability of dendrites ... 17
1.2.1 Passive electrical properties of dendrites ... 17
1.2.2 Neurotransmitter-gated ion channels ... 18
1.2.3 Voltage-gated ion channels ... 20
1.2.4 Dendritic integration ... 22
1.2.5 Dendritic integration in olfactory bulb granule cells ... 25
1.3 Two-photon photostimulation ... 27
1.3.1 Ca2+ imaging ... 28
1.3.2 Holographic glutamate uncaging ... 29
1.4 Aims of this study ... 30
2 A COMPACT HOLOGRAPHIC PROJECTOR MODULE FOR HIGH-RESOLUTION 3D MULTI-SITE TWO-PHOTON PHOTOSTIMULATION ... 32
- XIV -
2.1 Abstract ... 32
2.2 Introduction ... 32
2.3 Materials and methods ... 35
2.3.1 Design of holographic projector attachment ... 35
2.3.2 Software control of holographic attachment ... 37
2.3.3 Alignment and calibration of excitation spots ... 39
2.3.4 Acute brain slice preparation and electrophysiology ... 39
2.3.5 Two-photon imaging and glutamate uncaging ... 40
2.4 Results ... 41
2.5 Discussion ... 46
2.5.1 Characteristics of the holographic projector module ... 46
2.5.2 Application of the holographic module: investigation of synaptic integration in 3D ... 48
2.5.3 Comparison with other systems for holographic photostimulation ... 49
2.5.4 Conclusion ... 51
2.6 Supporting information ... 52
3 DENDRITIC INTEGRATION IN OLFACTORY BULB GRANULE CELLS: THRESHOLDS FOR LATERAL INHIBITION AND ROLE OF ACTIVE CONDUCTANCES UPON SIMULTANEOUS ACTIVATION ... 55
3.1 Abstract ... 55
3.2 Introduction ... 55
3.3 Material and methods ... 58
3.3.1 Animal handling, slice preparation and electrophysiology ... 58
3.3.2 Combined two-photon imaging and multi-site uncaging in 3D ... 58
3.3.3 Data analysis ... 60
3.3.4 Data sampling, normalization and alignment ... 61
3.3.5 Morphological analysis ... 62
3.3.6 Statistics ... 62
3.3.7 Tests of parameter changes at threshold ... 63
3.4 Results ... 64
3.4.1 Subthreshold dendritic integration ... 64
3.4.2 Transition from local spine spikes to non-local signals (Ca2+- and Na+-spikes) ... 66
3.4.3 Transition to supralinear behavior due to dendritic Na+-spikes (D-spikes) ... 69
- XV -
3.4.5 Molecular mechanisms of integration: Navs ... 74
3.4.6 Molecular mechanisms of non-local spikes: key role of NMDARs ... 77
3.4.7 Molecular mechanisms of non-local spikes: contribution of both low and high-voltage-activated Cavs to dendritic Ca2+ entry ... 78
3.4.8 Morphology influences non-local spike generation only subtly ... 80
3.5 Discussion ... 81
3.5.1 High excitability of GC apical dendrites ... 81
3.5.2 Dendritic spiking: D-spike and localized Ca2+-spike ... 83
3.5.3 NMDA-spikes and role of NMDARs in GC synaptic processing ... 84
3.5.4 Functional implications ... 85
3.6 Supporting information ... 87
4 GENERAL DISCUSSION ... 90
4.1 Holographic projector ... 90
4.2 High excitability of granule cell distal apical dendrites ... 91
4.3 Dendritic spiking: D-spike and localized Ca2+-spike ... 93
4.4 Morphology and input location influence non-local spike generation only subtly ... 97
4.5 NMDA-spikes and role of NMDARs in granule cell synaptic processing ... 97
4.6 Functional Implications... 100
5 ABBREVIATIONS ... 102
6 REFERENCES ... 106
7 ACKNOWLEDGEMENTS ... 119
- XVI -
- 1 -
1 General Introduction
This section is intended to convey the biological principles and functions of the methods used in my thesis. It forms the basis for the introductions in 2.2 and 3.2.
1.1 Olfaction
In most animals, olfaction plays a central role from the first seconds in life. A rat with anosmia, the loss of the sense of smell, will die as a pup as it is unable to find the mother’s nipple (Galizia and Lledo, 2013). Later in life, olfaction is necessary for finding food, avoiding predators, or selecting a mate making it crucial for the survival and fitness of an individual. The human sense of smell is also better and more important than we consciously perceive. In contrast to statements of famous neuroanatomist Paul Broca or neurologist Sigmund Freud that humans are
“nonsmellers” or have a “tiny smell”, olfaction in humans is generally similar to other mammals in its neurobiology and sensory capabilities. Humans have fewer functional olfactory receptor genes, but our brains have more complex olfactory bulbs and orbitofrontal cortices to interpret the odor information (McGann, 2017). Recent studies suggest that humans can discriminate more than one trillion olfactory stimuli (Bushdid et al., 2014). We rely on our sense of smell to detect dangers, such as fire, poisonous fumes or spoiled food but also, not less important, to enjoy pleasant smells of our environment like food or our fellow human beings. Indeed, most odorants are organic substances, i.e. produced by other living species and anosmia or hyposmia (the reduction of the sense of smell) is associated with emotional diseases like depression (Croy and Hummel, 2017). Additionally, smell dysfunction serves as marker for, or might, through respiratory infections or pollution, even be the earliest stages of neurodegenerative diseases like Alzheimer’s or Parkinson’s disease (Doty, 2017).
What is the stimulus of olfaction? Odorants are small chemicals released by various substrates
and can be perceived by an animal. They range from small molecules such as gases (CO
2or H
2S),
simple aldehydes, esters or nucleotides, to complex molecules or even peptides. Odorants are
produced for communication to benefit both, the emitter and the recipient (pheromones), only
the emitter (allomone) or only the recipient (kairomone). Odors can have innate meaning or be
learnt. They can be single substances or complex mixtures of hundreds of substances distributed
- 2 -
as plumes in a turbulent environment (Galizia and Lledo, 2013). The following chapters deal with how odorants, the stimuli, are picked up from the environment and become a perceived odor in the brain.
1.1.1 From the nasal cavity to the cortex: an overview
This section should give a rough understanding of the olfactory pathway and is not intended to be exhaustive. The sections of more importance for this thesis will be subsequently described in more detail.
Odorants get inhaled into the nasal cavity and dissolved in the olfactory mucosa of the main olfactory epithelium (OE). In mammals, inhaling or sniffing, is an active sensing mechanism that profoundly shapes nearly all aspects of the olfactory system (Wachowiak, 2011). Olfactory sensory neurons (OSNs, also olfactory receptor neuron), whose somata are located in the OE, extend a single dendrite into the nasal cavity. This dendrite carries 20-30 cilia that contain odorant receptors (ORs) (Imai and Sakano, 2008). ORs were first discovered in rodents in 1991 (Buck and Axel, 1991). Since then, ∼ 400 different ORs have been identified in the human genome (Malnic et al., 2004). The olfactory receptor repertoire of rats is estimated to contain 1700 to 2000 genes (Gibbs et al., 2004; Quignon et al., 2005). The mammalian ORs are seven- transmembrane G protein-coupled receptors. (Imai and Sakano, 2008). They are tuned to molecules or more common to specific submolecular features, odotopes, on the surface of odorants (Wilson and Sullivan, 2011; Araneda et al., 2000; Galizia and Lledo, 2013). Each OSN expresses only a single OR but odorants can bind to and activate different subsets of receptors (one neuron-one receptor rule, Serizawa et al., 2004). Each OR sends a single axon out of the OE through the cribriform plate into the forebrain, namely the main olfactory bulb (OB, see 1.1.2).
The entirety of OR axons form the olfactory nerve (cranial nerve one, ON). In the OB, OSNs
expressing the same OR converge their axons into the same few (in rodents 1-2) glomeruli in each
hemisphere of the OB (one glomerulus-one receptor rule, Imai and Sakano, 2007). Hence, an
odorant activates a specific subset of ORs that in turn activate a specific subset of glomeruli with
varying magnitudes. In consequence, odorant identity is represented by a unique pattern of
activated glomeruli in the OB (Mori et al., 2006). Glomeruli are structures of neuropil where the
axons of ORs synapse onto the apical dendrites of the main projection neurons of the OB: mitral
- 3 -
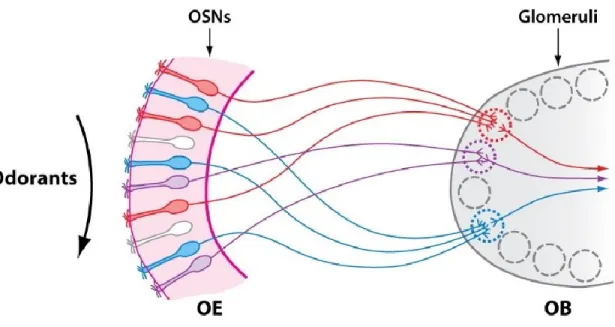
Fig 1. One glomerulus-one receptor rule. Olfactory sensory neurons (OSNs) are located in the olfactory epithelium (OE) and express a single olfactory receptor. OSNs expressing the same olfactory receptor converge their axons into the same few glomeruli in the olfactory bulb (OB), and therefore each glomerulus represents a single odorant receptor (represented as red, blue or violet). Modified from Mori and Sakano (2011).
and tufted cells (MCs and TCs, see 1.1.2.1). The odor signal is shaped and processed by numerous
excitatory and inhibitory interneurons located in different layers of the OB (see 1.1.2.2) before it
is transmitted to the olfactory cortex (OC) by the axons of MCs and TCs, forming the lateral
olfactory tract (LOT). The OC is a three-layered paleocortical structure defined by input of OB
projection neurons. It includes the anterior olfactory nucleus (AON), tenia tecta, olfactory
tubercle, cortical nuclei of the amygdala, anterior and posterior piriform cortex (APC, PPC) and
the lateral entorhinal cortex. Each region is differently involved in recognition, separation, and
completion of odor-evoked patterns sent from the OB, enabling odor perception. A key feature
of the OC is the sparse and distributed encoding of odor quality, standing in contrast to the spatial
pattern of OB glomeruli described above (reviewed in Wilson and Sullivan, 2011). The cells of the
OC also project axons back to the OB. These cortical feedback projections excite diverse
populations of OB interneurons including GCs and are thought to contribute to oscillatory
dynamics and olfactory learning in the OB and cortex (Boyd et al., 2012). The main OE and the
- 4 -
main OB are not the only chemosensory and olfactory processing systems. In addition, most mammals have multiple chemosensory systems mediating pheromonal effects. The vomeronasal organ, located in the nasal septum, consists predominantly of ciliated olfactory sensory neurons that project to the accessory olfactory bulb, located in the dorsal-posterior region of the OB. The vomeronasal organ can detect both volatile and non-volatile pheromones (Brennan and Zufall, 2006). The Grueneberg ganglion is located at the anterior end of the nasal cavity and is specialized in detection of danger signals and alarm pheromones (Moine et al., 2018). Additional distinct receptor organs are the septal organ of Masera and the guanylyl cyclase type-D system.
The latter system projects to so-called “necklace” glomeruli encircling the main OB (Cockerham et al., 2009). The trigeminal nerve also innervates the nasal cavity, where it is stimulated by many odorants and triggers protective respiratory, secretory, and cardiovascular reflexes (Doty et al., 1978; Meredith, 1988). Another chemosensory system is obviously the gustatory system to evaluate food quality. Taste buds in the cavity sense taste in direct contact with the source of the stimulus. However, as food always liberates volatile compounds, the sense of smell has a decisive role in our taste experience (Galizia and Lledo, 2013).
The vertebrate mammalian olfactory system shows striking resemblance to the invertebrate insect olfactory system, testifying consistency over million years of evolution. In the periphery, sensory receptors are tuned to specific submolecular features to bind a specific group of odorants. Insect ORs are heteromeric ligand gated ion channels (counterpart to mammalian G protein-coupled ORs, Sato et al., 2008). Sensory neurons expressing the same insect OR converge into glomeruli in the antennal lobe (counterpart to the OB), producing odor-specific signals in second order projection neurons (counterpart to MC/TCs) sending their axons to higher brain areas (mushroom body, counterpart of the OC, Wilson and Sullivan, 2011; Grabe and Sachse, 2018).
1.1.2 The main olfactory bulb
OSNs extend their axons solely to the OB, the first site of odor information processing in
mammals (Nagayama et al., 2014). It is part of the forebrain and divided into 6 layers: olfactory
nerve layer (ONL), glomerular layer (GL), external plexiform layer (EPL), mitral cell layer (MCL),
internal plexiform layer (IPL) and granule cell layer (GCL, Fig 2). The neurons of the OB are
- 5 -
conventionally categorized by the layers their somata are located in: juxtaglomerular cells (periglomerular cells (PGs), external tufted cells (ETs), and superficial short axon cells (sSACs)), MCs, and GCs (Nagayama et al., 2014). While TCs and MCs are projection neurons, meaning they innervate brain regions outside the OB, most other neurons in the OB are interneurons that only have projections inside the bulb. OSNs send their axons from the OE in the nasal cavity into the glomeruli where they synapse on primary dendrites of MCs and TCs. The signal propagates through the primary dendrites to the cell body of MCs (in the MCL) and TCs (in the EPL), where it is not only transmitted to other brain areas via the axon, but also back-propagates through the horizontal secondary dendrites in the EPL. Of note, back-propagating action potentials (bpAPs) are not decremental in the apical, but are decremental in lateral dendrites (Margrie et al., 2001).
On the lateral dendrites, reciprocal dendrodendritic synapses with granule cells are formed (see 1.1.3). As described above, each OSN expresses only a single OR and all OSNs expressing the same type of OR converge their axons into the same few glomeruli. As each MC/ TC just ramifies into one glomerulus, each glomerulus and its associated projection neurons form an OR module (also glomerular column, Mori and Sakano, 2011). The number of MCs and TCs synapsing into a single glomeruli varies greatly between studies but most report a maximum of ∼10 in mice and ∼20 in rats (Panhuber et al., 1985; Liu et al., 2016a). This neuronal arrangement gives rise to a certain topographic representation of odorants on the level of glomeruli in the OB. To what extend the olfactory map is truly topographical like other sensory systems, e.g. the visual system, is highly under debate. Topographic maps were proposed to be formed by OSNs located in distinct parts of the OE projecting to distinct parts of the OB or by clustered projections of different classes of ORs (fish- and terrestrial-type). Furthermore, odorant selectivity (molecular receptive range) of individual glomeruli was proposed for map formation: odorants with common molecular features, e.g. fatty acids or aliphatic alcohols, activate subsets of glomeruli that form clusters in the OB. Another approach is to organize the olfactory map in terms of functions and behavior:
clusters responding to innate vs. learned responses, clusters for fear, social behaviors, aggression
or aversion against spoiled food (reviewed in Mori and Sakano, 2011).
- 6 -
Fig 2. Basic model of the olfactory bulb network.Sensory input via the axons of olfactory sensory neurons reaches the olfactory bulb in the olfactory nerve layer (ONL) and converges into glomeruli in the glomerular layer (GL). Here, synapses with the apical dendrites of mitral and tufted cells (MC, TC) are built. Juxtaglomerular cells are represented by periglomerular cells (PGC) and superficial short-axon cells (sSAC). PGs make reciprocal synapses with the dendrites of MC/TCs. Somata of TCs are located in the external plexiform layer (EPL), while MC somata are located in the Mitral cell layer (MCL). Both have axonal projections to the olfactory cortex (OC) and elongated secondary dendrites in the EPL, where they form reciprocal dendrodendritic synapses with granule cells (GCs). In the EPL various types of EPL interneurons (EPL-IN) are located. The somata of GCs are located in the granule cell layer (GCL) and subtypes are determined based on the depth of their somata in the GCL and the sublayer to which their dendrites extend: superficial GCs (sGC, type-III), intermediate GCs (iGC, type-I), deep GCs (dGC, type-III). Various types of deep short-axon cells (dSAC) are located in the IPL and GCL and form inhibitory synapses with GCs. One GC is represented as filled with green fluorescent dye OGB-1 via a patch pipette.
- 7 -
Finally, axonal projections of MCs and TCs target several higher brain areas, which compose the OC (see 1.1.1). However, this extremely simplified OB circuit does not reflect the complexity and number of neuronal cell types present in the OB. There are various other cell types present in the OB, albeit in smaller numbers and the ones described above comprise heterogeneous populations of morphologically, molecularly and functionally distinct subtypes (Nagayama et al., 2014). Due to their vast amount, I will not describe each subtype’s function in its entirety but only the neurons, which were of special interest for this thesis, in more detail below.
1.1.2.1 Mitral and tufted cells
The names MC and TC are often used interchangeably, but there are morphological, projection and functional differences. Both have a single apical and multiple lateral dendrites, but TC’s lateral dendrites ramify preferentially in the superficial half of the EPL, while those of MCs are primarily located in the deeper half of the EPL. The total dendritic length of TCs is also significantly shorter (Igarashi et al., 2012). The dendrites are smooth, meaning that they do not bear spines.
The axons of MCs and TCs fasciculate and form the LOT together, but while TCs project mainly to
the anterior areas of the OC and individual TCs densely target specific regions, MCs show
dispersed projections to all OC areas (Takahashi et al., 2018). In detail, MCs project to the piriform
cortex, lateral entorhinal cortex, cortical amygdala, AON, tenia tecta and the cortical region of
the olfactory tubercle. TCs project to the AON pars externa, posteroventral part of the AON,
ventrorostral part of the APC and the cap region of the olfactory tubercle (Imai, 2014). Another
unique feature of TCs are axon collaterals to the other hemisphere that connect glomeruli with
the same identity (Mori and Sakano, 2011). TCs are classified into three subtypes: internal tufted
cells (somata deep in the EPL), middle tufted cells (somata in superficial EPL), and the
interneuronal external tufted cells (somata at border of EPL and GL or in GL) (Macrides and
Schneider, 1982). TCs show short-latency firing (∼110 ms) in response to a wide range of odor
concentrations, whereas MCs only respond to strong finer tuned signals with a latency of above
200 ms (Igarashi et al., 2012). This phase shift between MCs and TCs is most likely mediated by
ON-driven feedforward inhibition by periglomerular cells (see 1.1.2.2). Rodents reportedly
discriminate simple odors with high accuracy in 150 -250 ms but require
∼100 ms more todiscriminate difficult and highly similar odors (Abraham et al., 2010; Abraham et al., 2004;
- 8 -
Rinberg et al., 2006). This indicates a critical role of TCs in fast responses in olfactory behavior, whereas MCs are recruited for more difficult odor discrimination (Igarashi et al., 2012). MCs and TCs are laterally inhibited by GCs at different firing rates and MCs receive stronger inhibition from juxtaglomerular cells (Geramita and Urban, 2017; Geramita et al., 2016).
To conclude, like in other sensory systems, e.g. the visual system where motion and color are segregated (Callaway, 2005), MCs and TCs might give rise to segregated parallel processing of different odor features.
1.1.2.2 Excitation, inhibition and modulation in the OB
The sensory input to the OB is processed by a wide range of intra-bulbar connections and input from other brain regions. Synaptic inhibition critically influences sensory processing throughout the mammalian and insect brain (Burton, 2017; Ai et al., 2018) and in the OB the vast amount of interneurons is of inhibitory nature, as well. Here, I describe a selection of cell types, which shows the complexity of intra-bulbar signaling, necessary for the functional context of GCs.
In the GL, juxtaglomerular cells include glutamatergic ETCs, GABAergic PGCs, and combined GABAergic and dopaminergic sSACs, that directly modulate the input from the OSN to the MCs and TCs (Burton, 2017). ETCs excite the principal neurons via robust feedforward excitation. Gire et al. (2012) even show that MCs are typically not activated by direct OSN input but require a multistep mechanism via ETCs. sSACs receive excitatory input directly via OSNs or secondarily via ETCs. Their name is misleading, as these cells can extend multiple axonal branches up to ∼1 mm into tens of glomeruli. This predestines them for lateral inhibition (see 1.1.3.2) and indeed, several studies found them to be involved in interglomerular lateral inhibition independent from GCs (Liu et al., 2016b; Banerjee et al., 2015; Whitesell et al., 2013). sSACs have been shown to provide excitatory dopaminergic and gap junctional output to various cell types in vitro but optogenetic activation in vivo drove pure suppression of principal neuron activity (Burton, 2017;
Liu et al., 2016b; Banerjee et al., 2015). A subtype of sSACs, dopaminergic clasping SACs, have been shown to densely innervate the somata of other, putatively glutamatergic juxtaglomerular cells (Bywalez et al., 2016). In contrast to most sSACs, PGCs innervate just a single glomerulus.
They receive, depending on the subtype, excitatory input from ETCs or directly from OSNs. PGCs’
GABAergic release drives self-signaling or mixed excitation/ inhibition of other PGCs and ETCs
- 9 -
(Burton, 2017). Najac et al. (2015) identified an interesting axonless subtype that is both excited by and inhibits MC/TCs. It participates in intraglomerular lateral inhibition, a mechanism to reduce similarity of principal cells activated by the same glomerular input. Furthermore, ON- driven PGs have been shown to provide sniff-coupled feedforward inhibition onto MCs, setting the phase shift between MCs and TCs (see 1.1.4, Fukunaga et al., 2014).
In the EPL, besides GCs, principal neurons synapse onto a morphologically diverse array of axonless and axonbearing EPL interneurons (EPL-IN) like so-called Van Gehuchten, multipolar, satellite, horizontal, and short-axon cells. They form both reciprocal and nonreciprocal synapses exclusively with MCs and TCs. EPL-IN get similar input like GCs but, in contrast to GCs (see 1.1.3) this excitatory input evokes short-latency, rapid firing (Burton, 2017). One class of EPL-INs is characterized by their expression of the calcium (Ca
2+) binding protein parvalbumin (PV-cells).
These cells are densely connected to neighboring MCs and have been proposed to mediate classical center-surround lateral inhibition (Kato et al., 2013).
Deep short-axon cells (dSACs) are located in the IPL and GCL and can be divided into subtypes based on their axonal projections: GCL-, EPL-, and GL-projecting dSACs (Eyre et al., 2008). One single dSAC forms hundreds of inhibitory synapses with GCs regulating their activity by rapid feedforward inhibition (Burton and Urban, 2015; Eyre et al., 2009). Together with sensory input from ETCs, dSACs are heavily innervated by centrifugal piriform projections and could therefore act as hubs for centrifugal modulation of OB activity (Burton, 2017; Burton et al., 2017; Boyd et al., 2012). Burton et al. (2017) showed that dSACs also innervate the apical dendrites of TCs, mediating widespread inhibition. This makes dSACs a candidate for TC specific lateral inhibition.
Additionally, classical neuromodulatory inputs including noradrenergic inputs from locus coeruleus, serotonergic inputs from raphe nuclei and cholinergic inputs from the basal forebrain modulate sensory processing in the OB dependent on the organism’s behavioral state and experience (Rothermel and Wachowiak, 2014). At the medial border of the GL, somata of glutamatergic vasopressin cells, an example for intrabulbar neuromodulation, are located.
Vasopressin in the OB is associated with social discrimination via individual odor signatures (Lukas
et al., 2019).
- 10 -
1.1.3 Olfactory bulb granule cells
GCs are the most common cell type in the OB and play a central role in odor information processing. They are axonless GABAergic inhibitory interneurons with a small cell body of 6-8 µm in diameter, localized in the GCL, IPL and MCL (Price and Powell, 1970b). They usually have a single apical dendrite that extends towards the surface of the OB and branches in the EPL where they form reciprocal dendrodendritic synapses with MCs and TCs via 200-300 large spines (Fig 3).
Spines are cell membrane protrusions of varying, activity-dependent morphology. They increase the cell membrane, electrically and biochemically compartmentalize synapses and reportedly influence learning and plasticity (Scheuss and Bonhoeffer, 2014; Harvey and Svoboda, 2007;
Matsuzaki et al., 2004; Bywalez et al., 2015). Of note, a single MC/TC-GC pair forms only one or a few synaptic contacts, which conversely means that each GC reciprocally connects with hundreds of MCs or TCs (Woolf et al., 1991b; Burton, 2017). The spines function as both post- and presynapse. Glutamatergic MC/TCs excite the electrically compartmentalized dendritic GC spine, locally activating voltage-gated Na
+channels (Na
vs, see 1.2.3) that activate classic presynaptic N/P/Q voltage-gated Ca
2+channels (Ca
vs, see 1.2.3), which in turn release GABA back onto the MC/TC dendrites (Bywalez et al., 2015). Recent results of our working group also demonstrate high NMDAR-dependence of fast reciprocal GABA release. Pharmacology and ultrastructural analysis using electron microscopy, proving proximity of NMDARs to the SNARE release machinery, provide evidence that GABA release from GCs is mediated by classical axonal release mechanisms with an additional NMDAR-dependence (Lage-Rupprecht et al., 2019).
These studies reinforce the notion of the reciprocal spine as a mini-neuron. However, whether pure local activation can indeed trigger release of GABA back onto the exciting MC/TC remains to be elucidated.
A peculiarity of GCs is that they are generated and replaced permanently throughout life. The
only other brain region where new cells are integrated into the neuronal circuit throughout life
is the hippocampus that is strongly associated with learning and memory. In fact, new-born
neurons in the hippocampus are, like GCs, associated with pattern separation and the generation
of gamma oscillations (Sahay et al., 2011). The neural progenitor cells are generated in the
ventricular-subventricular zone of the lateral ventricle (V-SVZ) and moved to the OB through the
- 11 -
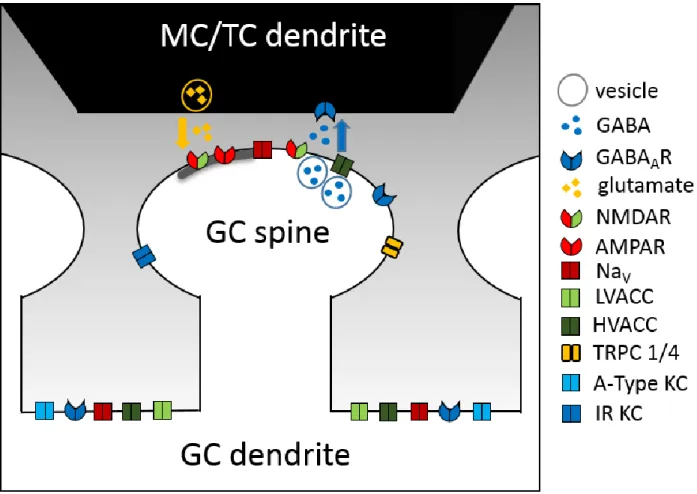
Fig 3. Basic model and ion channel localization of the reciprocal dendrodendritic MC/TC – GC synapse and GC dendrite. This model is not intended to be exhaustive and only channels of interest for this thesis are displayed. Subcellular localization of the channels is based on the literature referred to in 1.1.3, 1.2.2 and 1.2.3, but exact localization has not been demonstrated for all channels. Excitatory glutamatergic input from the MC dendrite binds to NMDAR and AMPAR on the GC spine. Locally activated Navs activate classic presynaptic HVACC channels. Ca2+ influx via HVACC and NMDAR triggers GABA release back onto MC/TC dendrites. Coactivation of several spines can lead to dendritic spikes mediated by opening of NAvs, HVACC, LVACC and NMDA-R. GC: granule cell, MC: mitral cell, GABAA-R: ionotropic gamma-aminobutyric acid receptor, NMDAR: n-methyl-D-aspartate receptor, AMPAR: alpha-amino-3-hydroxy-5-methyl-4- isoazole propionic acid receptor, Nav: voltage-gated sodium channel, LVACC: low-voltage-activated calcium channel, HVACC: hight-voltage-activated calcium channel, TRPC 1/4: canonical transient receptor potential channel 1/4, a-type KC: a-type potassium channel, IR KC: inward rectifier potassium channel.
rostral migratory stream (RMS), where they differentiate into GCs or PGs (Takahashi et al., 2018).
The V-SVZ is divided into finely patterned microdomains producing the numerous subtypes of GCs (see below, Merkle et al., 2014). In this way, ∼10.000 new neurons enter the OB every day of which half are integrated into the existing neuronal circuit (Yamaguchi and Mori, 2005).
Interestingly, several studies showed that adult-born GCs are preferentially integrated into the
- 12 -
deep GCL, while most prenatally-born GCs are located in the superficial GCL (Nagayama et al., 2014).
1.1.3.1 Granule cell- types
Morphologically, GCs can be divided into 3 groups based on their ramification in the whole EPL (Type-I), only the deep (Type-II), or only the superficial EPL (Type-III). Together with the location of the lateral dendrites of MCs and TCs (see 1.1.2.1), this indicates Type-II and Type-III GCs to preferentially innervate MCs and TCs, respectively. Interestingly, their ramification pattern relative to the surface of the OB seems to be reflected, at least to some extent, in the position of their somata. Meaning that superficial GC (sGC) somata located in the IPL or MCL will mainly ramify in the superficial EPL (Geramita et al., 2016; Burton and Urban, 2015). Interestingly, sGCs are reportedly more excitable than deep GCs (dGCs, Geramita et al., 2016; Wellis and Scott, 1990)). Additionally, Merkle et al. (2014) reported four more GC types of which two (Type-IV and –V) only branch in GCL and MCL. While some molecular markers confirm the classical subtypes (e.g. calretinin is only expressed in superficial GCs), others are specifically expressed in subgroups of GCs that could not be described solely by their morphology. Ca
2+/calmodulin-dependent protein kinase IIα
+is expressed in only half of GCs in the mouse OB and these GCs are preferentially activated by olfactory stimulation due to weaker inhibitory inputs. cFOS expression showed that both populations were also functionally distinct and activated during different behavioral tasks (Malvaut et al., 2017). Type-S GCs express nestin, usually expressed during development, in the adult state and synapse on the perisomatic region of MCs, putatively regulating the generation of action potentials (APs, Naritsuka et al., 2009). Another obvious feature to divide GCs into groups is to distinguish between prenatally-born, postnatally-born and adult-born neurons. Despite, both morphologically and molecularly, almost all types of GCs have been shown to be generated in the adult OB (Nagayama et al., 2014), various studies show differing roles in olfactory processing and behavior (reviewed inTakahashi et al., 2018).
To cover all subtypes described in the literature would go beyond the scope of this work.
Nonetheless, the common features of all GCs, being GABAergic, axonless, located in GCL/MCL
and spine bearing, defines them as a very distinct group and makes intrinsic functional findings
translatable to other subtypes in most cases.
- 13 -
1.1.3.2 Functions of granule cells: recurrent and lateral inhibition
MC/TC – GC synapses are the most numerous in the OB and together with their different excitation modes (see 1.2.5), this enables both recurrent and lateral inhibition of/between MCs and TCs. As described above, different populations of GCs preferentially synapse onto MCs or TCs or they ramify throughout the EPL (see 1.1.3.1). Thus, GCs form both segregated and overlapping microcircuits of MCs and TCs (Takahashi et al., 2018). Together with the functional differences of the two main projection neurons (see 1.1.2.1) this gives rise to different functions of GC subpopulations. However, for simplification I will not consequently differentiate between functions of subtypes in the following.
Recurrent inhibition and thus indirect self-inhibition of MC/TCs via GCs, has been shown to mediate a shunting effect, thereby regulating AP propagation within MC/TC lateral dendrites, and short-term depression (Halabisky and Strowbridge, 2003; Dietz and Murthy, 2005; Burton, 2017). Abraham et al. (2010) demonstrate increased recurrent inhibition in vitro and in vivo by enhancing synaptic Ca
2+influx in GCs using a viral strategy in mice and Nunes and Kuner (2015) showed a similar effect by genetic disinhibition of GCs. Both studies demonstrate that this accelerates odor discrimination (see 1.1.3.3).
Lateral inhibition is a circuit motif found throughout the whole nervous system. By decorrelation of the degree to which neurons respond to the same or overlapping stimuli, it can generate contrast enhancement or center-surround receptive fields to facilitate discrimination (Arevian et al., 2008; Geramita et al., 2016). In the rodent OB, a single MC’s dendritic tree is connecting, indirectly via GCs, with hundreds of other mitral cells in the bulb (Arevian et al., 2008; Orona et al., 1984). Together with the discontinuous topography of the OB (see 1.1.2) and the input of several other surrounding interneurons in all layers (see 1.1.2.2), this makes the principle of recurrent and lateral inhibition in the OB highly complex.
In in vitro paired recordings, lateral inhibitory currents have been observed between 10 - 20% of
MC pairs (Isaacson and Strowbridge, 1998; Urban and Sakmann, 2002), while, when MCs were
additionally activated, decreases in firing rate could be observed in ∼50% of pairs (Arevian et al.,
2008). Arevian et al. (2008) proposes activity-dependent (in contrast to subtractive or divisive)
lateral inhibition independent from the spatial structure of conventional center-surround
- 14 -
mechanisms. They showed that “postsynaptic MCs” are mainly inhibited by strongly firing
“presynaptic MCs” via overlapping populations of GCs if they are firing at intermediate rates themselves. Thus, the “postsynaptic” MC influences the effectiveness of the lateral inhibition that it receives via the recurrent dendrodendritic synapse with shared GCs. This fits to the recent findings of our working group, that GC GABA release is highly NMDAR dependent, i.e. dependent on presynaptic activity. This would achieve useful competitive interaction between only active MCs and increase contrast. Cells firing above an upper bound would be “immune” to lateral inhibition as they recruit the maximum amount of recurrent inhibition, such that additional inputs to GCs cannot trigger additional GABA release (Urban and Arevian, 2009; Arevian et al., 2008). A very similar model of net inhibition of low-responding MCs but not highly excited MCs is also proposed by Alonso et al. (2012) and Geramita et al. (2016) expand this model by demonstrating different lower and upper bounds for the effective activity range for lateral inhibition in MCs and TCs. Notably, both the lower and upper bound are significantly lower in TCs. This is, at least to some extent, mediated by different excitability of the GC subtypes they are synapsing on (see 1.1.3.1). Other recent studies support this model of randomly scattered lateral inhibition over the OB surface (Kim et al., 2012a; Economo et al., 2016). As sensory stimuli are encoded by altering rates and temporal patterns of spiking in projection neurons, decorrelation of spike trains of different MC/TCs via lateral inhibition causes contrast enhancement (Arevian et al., 2008; Giridhar et al., 2011). Tan et al. (2010) elegantly demonstrate odor-evoked GABA-mediated contrast enhancement in the OB in vivo: Recordings from OSNs, MC/TCs, PGs and GCs show that interneurons are more broadly tuned to odors than projection neurons. Upon suppressing of odor-evoked MC/TC inhibition by application of a GABA
AR antagonist, the projection neurons’ odor tuning became equally broadened.
Lateral inhibition between MC/TCs has been shown to be strongly NMDAR-dependent,
independent of APs fired by GCs and still persistent if the apical dendrite was truncated (Isaacson
and Strowbridge, 1998; Arevian et al., 2008). Nevertheless, as described above, GCs are not the
only OB interneurons mediating inhibition in the OB. Classical center-surround lateral inhibition
has been shown in Parvalbumin-cells (see 1.1.2.2, Kato et al., 2013) and EPL-IN and PGCs have
been shown to mediate recurrent inhibition of MC/TCs (Burton, 2017).
- 15 -
1.1.3.3 Behavioral functions of granule cellsHow recurrent and lateral inhibition translate into behavior output is highly under debate.
Nevertheless, numerous studies associated GCs with a wide range of functions. Sakamoto et al.
(2014) showed that inhibition of postnatal-born OB interneurons in mice did not affect simple discrimination of a rewarded from a non-rewarded odor. Whereas, following the reward-reversal paradigm, where the previously non-rewarded odor becomes the rewarded odor, the mice showed defects, demonstrating that postnatal-born GCs are important for flexible olfactory associative learning and memory. Selective activation of adult-born GCs using optogenetics accelerated learning to discriminate difficult odor pairs while it did not affect discrimination of easy odor pairs (Alonso et al., 2012). Similarly, Gschwend et al. (2015) showed that enhanced inhibition of MCs and TCs by optogenetic activation of GCs improved discrimination of similar odors while pharmacogenetic silencing of GCs resulted in a deterioration of odor discrimination learning. On the other hand, disinhibition of both pre- and postnatally-born GCs in mice did shorten the time required to discriminate dissimilar and highly similar odors, while discrimination learning remained unaffected (Nunes and Kuner, 2015). Fittingly, inhibition of GABA release by GCs after deletion of Na
v1.2 did increase the discrimination time of highly similar odorant mixtures and, again, discrimination learning remained unaffected (Nunes and Kuner, 2018). This confirmed the results of Abraham et al. (2010) that increased inhibition mediated by GCs accelerated discrimination and weaker inhibition decelerated discrimination of similar odor mixtures, while leaving learning and memory unaffected. Taken together, the role of GCs in rapid differentiation of highly similar odors and odor mixtures seems to be rather clear. Despite continuous progress, the role of GCs in discrimination learning and memory remains to be elucidated.
GC-mediated recurrent and lateral inhibition of/between MC/TCs is also involved in the
generation of gamma oscillations that synchronize the firing of the projection neurons, which is
necessary for effective transmission of odor information from the OB to higher brain areas (Mori
et al., 2013).
- 16 -
1.1.4 Oscillations in the olfactory bulb
Oscillations and temporal structure of activity is an essential aspect of communication in the brain. Already in the 1950s, OB interactions between inhibitory and excitatory neurons have been shown to underlie synchronous activities at slow, sniff cycle-coupled theta frequencies (1 – 12 Hz) as well as faster beta (15 – 30 Hz) and gamma frequencies (40 – 100 Hz) (Wachowiak, 2011;
Fukunaga et al., 2014; Adrian, 1950). Theta oscillation coupled spike latencies, sharpened by lateral inhibition, have been proposed to code for odor information faster and with more resolution than actual firing rates (Margrie and Schaefer, 2003). Odor-evoked gamma oscillations have been associated with successful discrimination of closely related odorants and both beta and gamma frequencies with odor learning. Theta and gamma oscillations are also present in the OC (Kay et al., 2009). Both MCs and TCs are locked to different respiration phases, whereby MCs are delayed relative to TCs (Fukunaga et al., 2012). Until recently, GCs were suggested to be mainly involved in shaping this respiration coupling of projection neurons, but Fukunaga et al.
(2014) provide evidence that it is driven by feedforward inhibition from glomerular interneurons.
By specific activation and silencing of GL and GCL interneurons using optogenetics and pharmacology, they show that GL interneurons drive sniff coupled theta oscillations whereas GCs drive fast gamma oscillations, nested in the sniff rhythm. Fast gamma oscillations are associated with higher task demands (Kay et al., 2009). The gamma oscillation band in the OB can be further divided into two types. Fast gamma oscillations carried by TCs and slow gamma oscillations carried by MCs (Manabe and Mori, 2013). Thus, MC/TC output is highly temporally regulated on two levels mediated by two distinct inhibitory circuits: theta, sniff coupled frequencies governed by PGCs and embedded two-type gamma frequencies governed by GCs (Fukunaga et al., 2014).
These results, together with doubts about specificity in activating /inhibiting GCs in many studies
described above (reviewed in Burton, 2017), give rise to a change in the common belief about
GCs being responsible for sniff coupled and odor evoked slow lateral inhibition. Evidence
suggests that GCs are more involved at the second level generation and synchronization of
gamma oscillations. Whether these recent hypotheses, the classical role of GCs or a combination
is more plausible remains to be elucidated.
- 17 -
1.2 Excitability of dendrites
Dendrites have long been seen as simple antennas, conducting input signals to the soma, where the inputs are integrated and can trigger AP generation at the axon hillock. However, research in the past decades revealed manifold dendritic nonlinear biophysical phenomena actively participating in sophisticated computations (Payeur et al., 2019). Furthermore, circuits like the OB where most synapses are dendrodendritic (Crespo et al., 2013) and in particular axonless neurons like GCs demonstrate that dendrites can perform all basic tasks of a neuron: input reception, input integration and output generation.
1.2.1 Passive electrical properties of dendrites
The basis of the excitability of dendrites is the lipid bilayer forming the cell membrane. It insulates the inside from the outside of the cell and, together with the embedded ion channels and transporter proteins, enables the generation of potentials. Excitatory synaptic input leads to the depolarization of the postsynaptic membrane potential (V
m) from the resting membrane potential (V
rest), a so-called excitatory postsynaptic potential (EPSP). Synaptic input integration is affected by the morphology of the cell, location of the synapse and the time course of the synaptic current. The passive, or electrotonic, properties of the dendritic tree depend on the specific membrane resistance (R
m), the specific membrane capacitance (C
m), and the intracellular resistance (R
i). These three passive membrane properties, together with the neurite diameter (d), form the constants describing a dendrite’s passive cable properties:
time constant: 𝜏 = 𝐶
𝑚∗ 𝑅𝑚τ is the time for the potential to reach 1-
1𝑒or 63 % of its final maximum or to decrease to 37 % from its maximum. Therefore τ defines the time window over which multiple synaptic potentials can sum. τ ranges from below 1 ms in octopus cells to 50-70 ms in hippocampal CA3 pyramidal cells (PCs, Stuart et al., 2016; Rall, 1969).
length constant: 𝜆 = √
𝑑𝑅𝑅𝑚𝑖
- 18 -
λ is the distance a potential will travel along the dendrite before it decays to 37 % of its maximum.
Therefore λ defines the distance along the dendrite over which multiple synaptic potentials can sum (Rall, 1969; Stuart et al., 2016).
High values of R
iand low values of R
mincrease the attenuation of an EPSP as it propagates along the dendrite. C
mattenuates especially short potentials as the charging of the membrane capacitance uses up most of the initial charge of potentials. The further a potential travels along the dendrite, the more charge deposited onto the dendrite capacitance is lost through the membrane resistance resulting in a smaller, slower EPSP. This spatiotemporal filtering enables e.g. low-pass filtering or, in combination with high-pass filtering of an active current (see below), membrane resonance crucial for network oscillations (Payeur et al., 2019; Fox et al., 2017).
Additional attenuation is mediated by channels open at the resting membrane potential causing the membrane to be “leaky”. Electrotonic attenuation can be curbed by dendritic morphology alone. Otopalik et al. (2019) show that strong tapering of dendrites leads to electrotonic compactness and almost linear voltage integration. Notably, the term “passive properties” is misleading as the generation and propagation of EPSPs is dependent on voltage-dependent channels open at V
restthat are involved in maintenance of the membrane potential, e.g. inward- rectifier potassium (K
+) channels (Stuart et al., 2016; Spruston and Johnston, 1992).
EPSPs are generated by the opening of ion channels. The ion channel composition of not only different neuronal types but of each subcellular compartment such as the soma, proximal, distal dendrites, and dendritic spines, is unique and is a key determinant of their individual input-output transformation. Ion channels can be ionotropic or metabotropic (second messenger e.g. G- protein coupled, Stuart et al., 2016). Here, I focus on ionotropic ion channels.
1.2.2 Neurotransmitter-gated ion channels
Chemical synapses are the most common connections between neurons. Upon AP arrival, the
presynapse releases neurotransmitters into the synaptic cleft where they bind to the receiving
elements of the postsynapse: neurotransmitter-gated ion channels. Upon binding of several
molecules of their agonist they rapidly open their ion permeable pore leading to, depending on
- 19 -
charge and direction of ion flow, membrane depolarization or hyperpolarization (Hille, 2001). The numbers of channels and receptors, the maximum number of open channels, their kinetics, ion permeability, and conductance varies from synapse to synapse and determine the effectiveness of the excitatory or inhibitory signal (Stuart et al., 2016). The selection of channels described here, have the common feature that they can be assembled from a variety of subunits greatly influencing these properties.
Alpha-amino-3-hydroxy-5-methyl-4-isoazole propionic acid receptors (AMPARs) form as homo-
or heterotetramers from either GluA1-GluA4 subunits or GluK1-GluK5 subunits (kainate-type glutamate receptors) (Stuart et al., 2016). They are excitatory ionotropic cation-selective glutamate receptors and are permeable for Na
+, Ca
2+, K
+, and zinc ions (Jonas et al., 1994; Stuart et al., 2016). AMPARs expressing specific edited forms of the GluA2, K1, or K2 subunit are impermeable to Ca
2+(Burnashev et al., 1992; Stuart et al., 2016). AMPARs are concentrated in the PSD (postsynaptic density) of glutamatergic synapses, have a fast onset and rise time and a fast deactivation within 0.5 – 1 ms (Traynelis et al., 2010; Stuart et al., 2016). As OB GCs express the specific edited form GluA2 subunit, they are impermeable to Ca
2+(Abraham et al., 2010).
Schoppa (2006a) show that distal input to GCs is mediated by the kainate-type while proximal input is mediated by AMPARs.
N-methyl-D-aspartate receptors (NMDARs) are ionotropic glutamate receptors and nonspecific
cation channels that are permeable for Na
+, K
+, and Ca
2+. 6-12% of total cation current are Ca
2+ions (Grienberger and Konnerth, 2012). They assemble as di- or triheterometric receptors from
GluN1-3 subunits. NMDARs have key roles in neuronal development, sensory perception,
learning and memory formation (Stuart et al., 2016). Besides their slower activation time and a
deactivation time from 40 ms – 2 s (Vicini et al., 1998), the biggest difference to AMPARs is the
voltage-dependent block of NMDARs by extracellular magnesium (Mayer et al., 1984; Nowak et
al., 1984). Substantial current flow through NMDARs requires coincident pre- and postsynaptic
activity or, in other words, simultaneous presynaptic glutamate release and postsynaptic
membrane depolarization (Stuart et al., 2016). The release of the magnesium block by membrane
depolarization can counteract the reduction of driving force due to large depolarizations (Cash
- 20 -
and Yuste, 1999). With enough glutamate release, NMDARs can even generate a regenerative
“NMDA spike” (Schiller et al., 2000; Antic et al., 2010) but, unlike a Na
+-spike, they are restricted to those sections of the dendrite that receive synaptic input (see 1.2.4, Larkum et al., 2009).
Of note, metabotropic glutamate receptors are also present in the GC spine and have been shown to play powerful neuromodulatory roles (Dong et al., 2009).
Gamma-aminobutyric acid receptors (GABAARs) are the most common ionotropic inhibitory ion
channel and are permeable to small anions like SCN
-, I
-, Br
-and NO
3-and most prominently Cl
-. Binding of their agonist GABA leads to an influx of Cl
-and thus to membrane hyperpolarization from V
rest(Hille, 2001). In mammals they are formed from pentameric assemblies of 19 different subunit genes, allowing thousands of possible combinations in different brain regions and neuronal populations (Stuart et al., 2016).
1.2.3 Voltage-gated ion channels
Na
vs and Ca
vs possess four similar subunits with an ion conducting pore. Each subunit consists of a lipophilic part (s1-4) and an aqueous part (s5-6), wherein s4 is the voltage-sensing region. This region is positively charged and mobile, therefore it can be pushed by the electric field. Thus, hyper- or depolarization leads to a conformation change and thereby closing or opening of the ion channel (Ahern et al., 2016). Besides the opened and closed state, Na
+and Ca
2+channels are in an inactive state for a defined time after activation. Hyperpolarization of the cell leads to reactivation of the ion channel.
Voltage-gated Na+ channels (Navs), opened by a depolarization from Vrest