Reorganization energy and polaronic effects of pentacene on NaCl films
Daniel Hernangómez-Pérez ,1,2,*Jakob Schlör ,1David A. Egger,1,3Laerte L. Patera ,4 Jascha Repp,4and Ferdinand Evers1,†
1Institute of Theoretical Physics, University of Regensburg, 93040 Regensburg, Germany
2Department of Materials and Interfaces, Weizmann Institute of Science, Rehovot 7610001, Israel
3Department of Physics, Technical University of Munich, 85748 Garching, Germany
4Institute of Experimental and Applied Physics, University of Regensburg, 93040 Regensburg, Germany
(Received 10 May 2020; revised 4 August 2020; accepted 8 September 2020; published 17 September 2020) Due to recent advances in scanning-probe technology, the electronic structure of individual molecules can now also be investigated if they are immobilized by adsorption on nonconductive substrates. As a consequence, different molecular charge states are now experimentally accessible. Thus motivated, we investigate as an experimentally relevant example the electronic and structural properties of a NaCl(001) surface with and without pentacene adsorbed (neutral and charged) by employing density-functional theory. We estimate the polaronic reorganization energy to beEreorg0.8−1.0 eV, consistent with experimental results obtained for molecules of similar size. To account for environmental effects on this estimate, different models for charge screening are compared. Finally, we calculate the density profile of one of the frontier orbitals for different occupations and confirm the experimentally observed localization of the charge density upon charging and relaxation of molecule-insulator interface fromab initiocalculations.
DOI:10.1103/PhysRevB.102.115419
I. INTRODUCTION
The interaction of individual molecules with surfaces and interfaces constitutes one of the central topics of surface science since this field was launched. In the past, most of the interest focused on metallic surfaces, partially because of the relevance to catalysis, but also because experimen- tal techniques such as the scanning tunneling microscope (STM) could not operate on nonconductive substrates. It was only relatively recently that this situation changed and STM-related techniques also became available for individ- ual molecules adsorbed on insulating films, which in turn are deposited on a metallic substrate [1]; for an illustration, see Fig. 1. Since then, scanning-probe studies of individ- ual molecules on insulating films, such as sodium chloride (NaCl), have received a growing amount of attention (see,e.g., Refs. [2–8] and references therein). The main reason is that molecules tend to hybridize much more weakly with insu- lators than with metals and therefore new physical regimes become available. If sufficiently thick insulating substrates are used, the electron transfer from the adsorbed atoms or molecules is quenched and they can exhibit different metastable (long-lived) charge-states [9]. Combining STM techniques with atomic force microscopy has allowed us to experimentally obtain the energy gain of the system after charging a single-molecule [10], analyze the differences in the orbital shape with angstrom resolution [11] or measure geometrical changes of single-molecules induced by electron
*daniel.hernangomez@weizmann.ac.il
†ferdinand.evers@ur.de
transfer [12]. Partially motivated by these experimental de- velopments, calculations of the physical properties of atomic and molecular adsorbates on insulating substrates have been attempted [13–17]. These calculations are very challenging due to the large number of electrons (especially from the substrate layers) involved. Most notably, only approximate density-functional theory (DFT) calculations [15–17] have been performed for single molecules adsorbed on insulating films. The additional simplification in these calculations is achieved by not explicitly including the metallic layer, which is replaced by a perfectly conducting ideal plane. The electro- static interaction between the localized charge in the molecule and its image charge is self-consistently included by consid- ering the energy of two charge distributions separated by an homogeneous insulating film.
In this paper, we present an extensive computational study of a single pentacene molecule adsorbed on a NaCl surface.
We focus on the understanding of the interplay between charg- ing the molecule and the structural relaxation of the substrate.
To address this issue, we first comprehensively characterize the free surface (NaCl slab). Already, this arrangement, as it turns out, is nontrivial because, as we show, the crystal structure of the bulk lattice is reached only very slowly with increasing the slab thickness.
Depositing a single neutral pentacene molecule alters the alternating free surface by shifting away the nearby Cl−ions toward the inside of the film by ∼8.5% of the bulk lattice spacing. Upon adding an electron to the molecule, the main structural effect on the surface is that nearby Na+ions are at- tracted and bulge out toward the molecule at the expense of the Cl−ions that go deeper inside. Importantly, the charge state of the molecule is experimentally found to be metastable if the NaCl-film with sufficient thickness is deposited on a copper
FIG. 1. Schematic representation of a scanning-probe setup for single-electron transfer between a metallic tip and a pentacene molecule adsorbed on a NaCl film (violet: Na+, green: Cl−). Single- electron transfer between the tip and the molecule are indicated with black arrows.
substrate. We estimate 0.8−1 eV for the corresponding reor- ganization energy. To illustrate the effects of screening at the underlying metallic substrate, different screening models have been compared.
To connect to previous experimental work, scanning tunneling profiles along the charged molecule have been sim- ulated. We find that the charge-induced molecule-insulator interface relaxation enhances the tunneling probability around the center of the molecule. Our computational results are consistent with published experimental data [11].
II. MODEL AND METHODS A. General computational details
Our computational study focuses on NaCl films. We per- form slab calculations with periodic supercells with (001) surface orientation employing DFT. Our DFT calculations are performed with the FHI-AIMSpackage [18] that implements the Kohn-Sham formulation of DFT using a localized basis set. We use a standard generalized-gradient approximation (the Perdew Burke-Ernzerhof [PBE] functional [19]) for the exchange-correlation functional and incorporate scalar rela- tivistic corrections to the kinetic energy at the level of the zeroth-order regular approximation. As a basis set, we have routinely employed the optimized “light” settings (approxi- mately equivalent to “double zeta” quality). We have checked the robustness of our most prominent observations against
“tight” settings (“double zeta+polarization” quality).
Our standard convergence criteria are 10−5 electrons/Å3 for the density, 10−3 eV for the sum of the Kohn-Sham eigenvalues and 10−6 eV for the total energy. The geometry optimization of the atomic structures start from an initial state in which the atoms and ions are located relatively to their bulk (for the NaCl slabs) or slab (for pentacene on NaCl) positions. They are performed using the energy-based Broyden-Fletcher-Shanno-Goldfarb optimization algorithm [18,20] and atomic structures are relaxed until every com- ponent of the residual force per atom or ion drops below the threshold 10−2 eV/Å. For organic-inorganic interfaces, the account of dispersive forces in DFT is known to be very important [21–23]. We treat dispersive forces [van der Waals
(vdW) interactions] using the Tkatchenko-Scheffler (TS) ap- proach [24] and the Clausius-Mosotti correction for solids [25] (TS-CM). Unless stated otherwise, we ignore dispersive forces inside the NaCl slabs, i.e., between Na+-Na+, Cl−-Cl−, and Na+-Cl−, but allow vdW interactions between all the other atomic species.
B. Models for metal substrate
As mentioned in Sec.I, including in addition to the NaCl film a metallic layer inab initiocalculations is computation- ally prohibitive. We note that the main physical effects of these metal layers is to ensure, via screening, charge neu- trality when charged atoms or molecules are adsorbed on the substrate. This behavior can be conveniently included in simplified models. We compared here some of those models for the NaCl slab with a charged pentacene adsorbed.
1. Jellium model
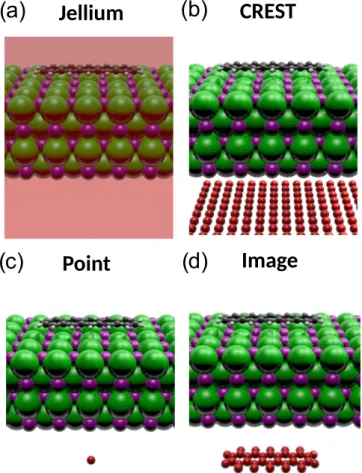
The simplest approach employs the jellium model, which ensures charge neutrality by adding a uniformly charged com- pensating background to the supercell [26], see Fig. 2(a).
FIG. 2. Schematic illustration of the four different charge com- pensation methods for periodic surfaces with excess charge used in this work. (a) Jellium model, here the transparent box represents the homogeneously charged background. From (b) and (d), the supercell cell countercharges are depicted by red spheres arranged as used (b) for CREST, (c) for the point charge, and (d) for the shaped image charge.
In band-structure codes, the model is often implemented by omitting the zero-wave-number component of the Coulomb interaction [27,28]. For slab calculations, the background ex- tends also into the vacuum layer.
As a consequence, the unit cell carries an electric dipole, while the shape of the associated field is a modeling artifact. In the literature, two methods have been proposed to compensate for this: (i) extrapolation to the dilute limit by finite-size scal- ing [29] and (ii)a posterioricorrections based on dielectric models [30–32].
2. Shaped countercharge distribution
The artifact of the jellium model results from distributing the compensating background charge (countercharge) homo- geneously over the unit cell. More realistic arrangements are easily possible, though not standard in every band-structure code.
Alternative choices are to arrange the countercharges as a two-dimensional sheet, Fig.2(b), to contract them into a point, Fig.2(c)or any intermediate geometry, Fig.2(d), which can mimic the form of the image charge. On the technical level, the countercharges can be modeled as an ensemble ofNcounter ion cores, with an individual fractional chargeqcounter each, and with a total charge matching the charge of the surface layerQ, i.e.,Q=qcounterNcounter.
We mention that the sheet geometry, Fig.2(b), was adopted by Sinai et al.[33] to describe surfaces of doped semicon- ductors, where the transfer of free charge carriers between the doped material and the surfaces leads to a space-charge region. In modeling, this region was contracted to a thin sheet that produces the associated electric field—hence the name charge-reservoir electrostatic sheet technique (CREST).
III. DIMERIZATION EFFECTS ON PRISTINE NaCl FILMS The reference geometry for our investigation on the ef- fect of adsorbates on insulating substrates will be a clean NaCl(001) film. We therefore first extensively characterize the atomic geometry of this system.
A. Atomic geometry and relaxation
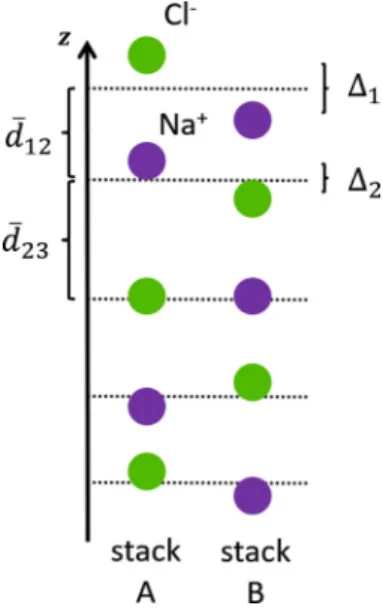
The NaCl slab consists of two types of ionic slabs, denoted AandB, showing an alternation of Na+ and Cl− ions along the ˆzdirection (see Fig.3). The “surface relaxation” describes the structural change of the crystal lattice that occurs due to the existence of a vacuum interface. This change is character- ized by the displacement of neighboring ions from each other measured relative to the bulk position [34,35]; specifically, we consider themean-layer separation,
d¯i j=12 ziA−zAj
+
ziB−zBj
, (1)
whereziA/Bis thezcoordinate of ioniin the stackA/Band the intralayer buckling:
i:=zAi −ziB. (2) In our calculations, only the relaxation normal to the surface has been accounted for, while the transverse coordinates are bulklike and not relaxed. Lateral relaxations are not expected from symmetry considerations.
FIG. 3. Characterization of the surface relaxation in a NaCl(001) film. The mean layer separation and intralayer buckling of the first two layers of a NaCl supercell are shown.
1. Computational details and models
Our initial geometries for the NaCl(001) slabs are con- structed from converged bulk geometries (see AppendixA).
For NaCl(001) slabs, our DFT calculations and geometry op- timizations follow the convergence criteria for the SCF cycle detailed above with slightly tighter force convergence param- eter (0.005 eV/Å). We consider a vacuum spacing layer of 20 Å (for which total energies are converged with a precision of 0.8 meV per layer). We have verified that the structures are converged with a precision of 0.1 pm and also performed nu- merous checks of the convergence with respect to the vacuum spacing andk-grid discretization (see AppendixB).
Depending on the physical situation at hand, thin films—
freely suspended or on substrates—or thick films, different boundary conditions are appropriate for modeling. For exam- ple, with freely suspended films, the upper and the lower sides of the film can relax freely (symmetric slabs); in contrast, when modeling the surface of a thicker film, the ions of one side of the slab can be fixed to the bulk values (asymmetric slabs). We have ensured in detailed separate calculations that our conclusions do not change for this asymmetric situation (not shown).
2. Mean layer separation
Our main results are summarized in Fig. 4. We compare two slabs with even (L=24) and odd (L=25) numbers of layers to investigate even-odd effects. For comparison, in TableIwe also reproduce results forL=12. The data allows for the following conclusions:
Qualitatively, we observe that the interlayer distances oscillate when going from the surface into the bulk, see blue traces in Figs. 4(a) and 4(b). We attribute the effect to the reduced coordination number of the surface atoms, which tends to strengthen the remaining bonds to the second layer. The second layer in turn coordinates more strongly
(a)
(b)
(c)
FIG. 4. (a) Relative mean-layer separation (left, blue crosses) and intralayer buckling (right, red circles) measured with respect to the bulk interlayer separation for a freestanding relaxed NaCl slab of 24 layers. Horizontal solid lines correspond to the reference value of the mean-layer separation and buckling for the bulk crystal. (b) Same as in (a) but for a 25-layered slab. (c) Displacement of the ions from their bulk position upon structural relaxation. Dimerization of NaCl ions in a given stack is indicated by the red boxes.
with the first layer and so binding to the third is less pro- nounced. This mechanism—well-known from closed-packed metal surfaces—results in an oscillating interlayer spacing, with the amplitude of these oscillations decaying within few layers into the bulk.
To illustrate this, we compare in Table Ithe mean layer separation of first-second and second-third layers for two different thicknesses,L=12,24. Quantitatively, the impact of surface relaxation on the mean layer separation is of the order of 0.5% in terms of the bulk interlayer distance,dbulk, for the first and second layers and a factor of 2 smaller for the second and third.
3. Intralayer buckling
Qualitatively, Cl−ions of the first layer relax outwards of the surface compared to the Na+ ions. There, the buckling is
stronger, up to almost 4% in units ofdbulkand has a negative sign, indicating that the Cl−ions always relax outward while the Na+ions inwards Together with the alternating stacking of ions in NaCl this behavior is a manifestation ofdimerization in NaCl where Na+ and Cl−ions come closer in alternating way along ˆz. We show a sketch of the dimerization occurring in the central region of the slab in Fig.4(c). The NaCl dimers originated by surface creation are marked with red rectangles.
As compared to the mean layer separation, the buckling and the associated dimerization decay much slower:/dbulkkeeps a value of∼0.1% even 10 layers deep into the bulk of the slab.
Indeed, we have checked (not shown here) that slabs of up to 50 layers still present dimerization between Na+and Cl−ions along a stack.
4. Relation to experiments and earlier DFT studies.
Finally, as inferred from Table I, our results are in good qualitative agreement with experimental measurements, with quantitative deviations that can reach a factor of 2–3. Compar- ing to earlier computational work [35], we report a relatively large discrepancy of around 24% difference (roughly 0.3 pm) forδd¯12and 94% difference (roughly 0.6 pm) forδd¯23. We at- tribute these deviations to methodological differences in DFT implementations of FHI-aims (all electron, localized basis set) versus CASTEP (pseudopotentials, plane waves).
5. Discussion of functional dependencies
One infers from the data given in TableIthat theab-initio -obtained geometries have a residual dependency on the DFT functional. Specifically, we have tested the effect of dispersive interactions; our numerical data in TableIshows they can have a significant quantitative but no qualitative effect [36].
B. Surface energy
We turn to the investigation of the surface energy per area, γ. It derives from the scaling of the total energy of a slab with Llayers:
Eslab(L)
L −Ebulk :=γA1
L+. (3)
Here,Adenotes the surface area of the slab unit cell andEbulk is obtained from a separate bulk calculation (see AppendixA for technical details). The value forγ can be obtained fitting
TABLE I. Mean layer separation in percentage of the bulk lattice spacing,δd¯i j =(di j−dbulk)/dbulk, and intralayer buckling,i/dbulk, for the three topmost layers of a free-standing relaxed NaCl(001) slab. For the NaCl(001) lattice,dbulk=a0/2, wherea0 is the bulk lattice constant (see bulk structural details in AppendixA). The subscripts 1,2,3 designate the top surface, second layer, and third layer, respectively.
We compare our results for the PBE functional (L=12,24) and PBE with TS-CM corrections (L=12) to previousab initiocalculations and experimental results obtained using low-energy electron diffractionI−Vanalysis. The experimental valuedbulkexp =2.8025 Å is estimated from the average value of the experimental lattice constants, see Table S1.
δd¯12[%] δd¯23[%] 1/dbulk[%] 2/dbulk[%] 3/dbulk[%]
PBE(12 lay.) −0.786 0.334 −3.472 −1.297 −0.210
PBE(24 lay.) −0.793 0.337 −3.437 −1.333 −0.175
PBE-TS-CM (12 lay.) −0.255 0.362 −3.924 −1.490 −0.327
PBE [35] −0.600 0.020 −3.860 −1.053 0.000
Experiment [34] −1.430 0.100 −5.0±0.1 −0.7±0.1 0.0±0.1
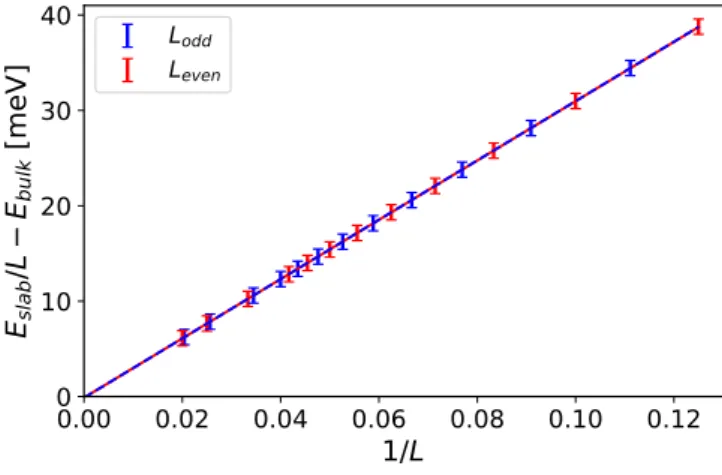
FIG. 5. Slab energy per layer,Eslab(L)/L, as a function of the inverse number of layers, 1/L for odd-numbered (blue) and even- numbered (red) free-standing NaCl films. The bulk energy offset is equal toEbulk= −17006033.751 meV.
the numerical data as a function of 1/L. The parameteris kept as a sanity check; correct fitting must result in an estimate forconsistent with zero.
We show the numerical results for odd- (red line) and even-layered (blue line) slabs in Fig.5. Fitting to Eq. (3) yields parameters reproduced in TableII. As one would expect, in the limit of thick slabs, both yield identical results within the error bars (given by the accuracy of the total energy with respect to the vacuum spacing). Our results for γ are in excellent agreement with previous DFT calculations [35], which give a substantially broader interval 9−10 meV/Å2.
IV. MOLECULE-INDUCED SURFACE REORGANIZATION We turn to the investigation of the NaCl surface reorgani- zation after physisorption of a single pentacene molecule.
A. Adsorption energy and binding geometry
We first report on the adsorption properties of neutral pen- tacene on NaCl. From a DFT-relaxed structure, we extract the optimal adsorption distance,dopt, and the adsorption energy, Eads, computed from the total energy as
Eads=EP-NaCl(dopt)−ENaCl−EP. (4) Here,EPc-NaCl is the energy of pentacene adsorbed on NaCl, ENaCl the energy of the NaCl slab, and EP the energy of isolated pentacene. The binding potential, Fig.6, is obtained from the total energy by varying the distance between the molecule and the surface of the NaCl slab without relaxation
TABLE II. Surface energy,γ, and offset parameter,, obtained for even and odd number of layered slabs. As the surface area of the slab supercell, we used the DFT-optimized value,A=16.256 Å2.
γ[meV/Å2] [meV]
odd 9.6±0.2 −0.1±0.4
even 9.6±0.2 −0.1±0.4
FIG. 6. Binding potential of pentacene adsorbed on a NaCl(001) surface as a function of the distance between the molecule and the surface. DFT calculations employ PBE without (blue circles) and with vdW correction (PBE-TS, orange triangles; PBE-TS-CM, green squares). Energies,Etot, are given relative to the energy of the fully relaxed system,Emin.
of the ionic coordinates. We monitor directly the atomic ge- ometry (nuclear coordinates) of relaxed pentacene on NaCl after geometry optimization.
1. Additional computational details
The geometry optimizations for pentacene on NaCl slabs are performed in rectangular supercells of sizes n×m Cl− ions in the x−y plane. We ensure that the distance of the adsorbed molecule to the boundaries of the supercell is the same in both directions. Geometry optimizations start from an initial geometry in which the gas-phase molecule and a four-layered NaCl slab are structurally relaxed independently.
The two bottommost layers are kept frozen (asymmetric slab).
Next, we place the molecule at a distance of 3.1 Å from the top layer of the slab and perform the minimization of the forces using DFT [18] following the criteria detailed above.
Dispersion forces are described within the PBE-TS scheme.
For charged pentacene/NaCl systems, the countercharge dis- tribution in the supercell is located at a fixed distance of 8 Å from the bottom layer of the NaCl film.
2. Results for the binding properties
After geometry optimization, we find the central benzene ring of pentacene located on top of a Cl−ion and the molec- ular long symmetry axis oriented along the polar direction of the surface (i.e., along a string of Cl− ions). Our compu- tational results are consistent with experimental adsorption geometry [1]. The optimal geometry results from a compe- tition of several forces including electrostatic, e.g., Hartree type, the vdW attraction, and the Pauli repulsion.
We rationalize our result in the following way: An impor- tant contribution from electrostatics stems from the interaction between the surface ions and the charge distribution on the molecule. Since most of the electronic charge lies on the benzene rings, the electrostatic repulsion can be minimized by having a string of Cl−ions located along the long symmetry axis of the molecule and thus further apart from the C atoms.
This way, also a larger number of Na+ions are allowed to be
TABLE III. Adsorption energies,Eads, and distances,dopt, esti- mated experimentally and calculated with different functionals and vdW dispersion schemes. For computational details, in particular, with respect to geometry optimization, see main text.
Functional Eads[eV] dopt[Å]
PBE −0.25 3.56
PBE-TS −2.71 3.12
PBE-TS-CM −1.55 2.95
optB86b-vdW [17] −1.65 3.05
Experiment [1] 3.0
closer to the molecular charge on the C atoms. The collinear geometry is also favorable for reducing the Pauli repulsion.
Here, the reason is that the ionic radii of Cl−ions are larger than Na+and therefore the Pauli repulsion occurs for Cl− at larger distances. This then also favors Cl−to be located further away from the C atoms.
The quantitative estimates for the binding potential and optimal adsorption distance are summarized in Table III and Fig. 6. Without vdW corrections, we find an unrealistically flat binding curve with a small adsorption energy,−0.25 eV, and a binding distancedopt approximately 20% bigger than the experimental estimations. Including vdW dispersion increases the curvature of the binding both for PBE-TS and PBE-TS-CM. The binding distance agrees with experiment and previous DFT calculations using the optimized nonlocal exchange correlation functional optB86b-vdW [17].
B. Detailed response of pentacene/NaCl adsorption geometry While adsorption energies in TableIIIare seen to exhibit a rather strong functional dependency (by almost a factor of 2), the binding geometries of the vdW-corrected calculations are rather close. In the following, we therefore use the computa- tionally inexpensive PBE-TS treatment for pentacene/NaCl structure optimization and subsequently check our calcula- tions with PBE-TS-CM.
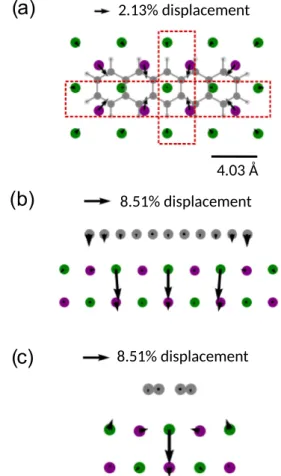
We turn now to the investigation of the response of the NaCl film geometry upon adsorption of neutral and charged pentacene. In Fig.7, we show the atomic displacements for a 7×5 supercell cell size in the x−yplane. As one would expect, most of the substrate reaction to the adsorption of the neutral molecule occurs in the topmost layer of the NaCl film;
the second layer shows a similar pattern with significantly smaller displacements. The Na+ ions are attracted by the molecule and relax—predominantly laterally—by an amount of∼6 pm, i.e., roughly 2% of the NaCl layer spacing,dbulk. The Cl−ions that are located along the molecular long axis are pushed deeper into the substrate by 8.51% (roughly 24.2 pm) [see Figs. 7(b) and 7(c), respectively]. Note that this trend is opposite to the trend given by the buckling of the clean NaCl surface, as seen in Fig. 4, thus partly ironing out the uppermost layer. We also observe a small bending of outer rings in the molecule upon adsorption by 2% ofdbulk(roughly corresponding to 10◦).
Upon charging, the pentacene molecule dives deeper into the NaCl surface by 2%dbulk (∼6 pm) due to electrostatic
FIG. 7. Displacements of Na+, Cl− ions, and C atoms upon adsorption of pentacene; only the first two top layers out of four are displayed. Atomic displacements are shown for (a) the molecular and top surface layer in thex−yplane, and red-boxed areas across (b)x−zplane and (c)y−zplane. The displacement is given as a percentage with respect to the bulk interlayer distance,dbulk, of the NaCl crystal. The displacement arrows are scaled by a factor of 50 in panel (a) and a factor of 100 in panels (b) and (c).
interaction. The carbon-carbon bonds of outermost benzene rings parallel to the long symmetry axis of the pentacene molecule increase their length by roughly 1%. Simultane- ously, the carbon-carbon bonds of the central ring shorten by
∼0.4% (∼0.5 pm). This results in an increase in the length of the molecule of∼8 pm. In addition, the trends observed in the substrate after adsorption of neutral pentacene are enhanced, see Fig.8: The excess charge attracts the Na+ions even more and now bulge out of the surface toward the molecule. The Cl−ions are pushed further downward, inverting the sign of the buckling near the molecule.
Methodological discussion
For charged pentacene/NaCl systems, we have checked that different models for the metal substrate yield the same qualitative response of the pentacene/NaCl surface after charging. The quantitative difference found is small: We find a maximum displacement of the ions of 5.42% for CREST, 5.73% for point-shaped charge distribution and 4.92% for the jellium-model in units of dbulk. For comparison, we get a maximum displacement of 5.61% for the image-shaped
FIG. 8. Schematics analogous to Fig.7after charging pentacene with one electron; also the countercharges (red discs) are indicated.
Atomic displacements are obtained from the difference between the charged geometry, geo−1to the neutral geometry, geo0and given as a percentage of the interlayer distance,dbulk, of the NaCl bulk crystal.
The displacements are shown for (a) the molecular and top surface layer in thex−yplane, and red-boxed areas across (b)x−zplane and (c)y−zplane. The displacement arrows are scaled by a factor of 120 in panel (a) and a factor of 60 in panels (b) and (c).
charge distribution (shift of∼16 pm), see Fig. 8. Maximal deviations in each layer parallel to the molecular plane are small (0.1%). Ionic displacements between the metal models with explicit charge compensation that create a realistic dipole inside the supercell agree better with each other compared to the uniform background model. Small quantitative differences between them can be readily understood from different spatial distribution of the dipole fields.
We also have investigated the effect of including CM cor- rections to the vdW dispersion at the PBE level (not shown).
We report, both for neutral and charged pentacene/NaCl systems, a residual dependency on the vdW scheme. The displacements out of the molecular plane are larger by∼1%
(neutral) and ∼4 % (charged pentacene). Parallel to the molecular plane, the atomic displacements are very similar compared to PBE-TS. We also observe a stronger bending of the molecule at both ends by 4.87%—roughly 13 pm for neutral adsorption. Stronger finite-size effects and surface
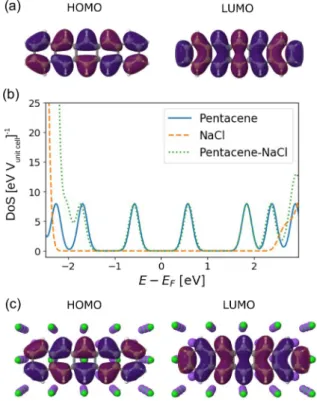
FIG. 9. (a) Highest occupied (HOMO, −4.50 eV) and lowest unoccupied (LUMO, −3.35 eV) molecular orbital of the isolated pentacene molecule and (b) corresponding density of states (DoS, blue solid curve). Also shown is the DoS of the 4-layer NaCl slab (or- ange dashed curve) and of pentacene adsorbed on NaCl (green dotted curve) in the NaCl band gap region. For each DoS curve, the energy is referred to the Fermi energy defined as (ELUMO+EHOMO)/2 (and equal to−3.92 eV for neutral pentacene,−4.51 eV for NaCl and
−4.70 eV for pentacene-NaCl). The DoS peaks were broadened using Gaussians with broadening of 0.1 eV. (c) HOMO (−5.29 eV) and LUMO (−4.11 eV) of adsorbed pentacene molecule on NaCl.
reaction are expected from the larger CM corrections to the polarizability of the NaCl surface.
C. Electronic structure of pentacene adsorbed on NaCl The molecular density of states (DoS) and relevant molecular orbitals of neutral free pentacene and neutral pentacene/NaCl are displayed in Fig.9. The frontier orbitals highest occupied molecular orbital (HOMO) and lowest un- occupied molecular orbital (LUMO) in free and adsorbed pentacene exhibit the same nodal structure and similar spa- tial distribution. Furthermore, the Kohn-Sham gap is almost insensitive to adsorption, 1.15 eV for gas-phase pentacene versus 1.18 eV for pentacene/NaCl. While these values are in very good agreement with previous DFT calculations [17]
(±0.01 eV), note that they strongly disagree with the exper- imental transport gap (which is measured close to 4.4 eV for three-layered NaCl films[1].) This is due to the missing derivative discontinuity [37,38] and absence of substrate- induced renormalization [39] in the exchange-correlation functionals employed here.
Finally, we observe that the frontier orbitals lie within the large band gap of NaCl far from the conduction and band edges, as seen in the DoS, Fig.9(b). Therefore, as one would
FIG. 10. Sketch representing the calculation of the reorganiza- tion energy using the total energy obtained from DFT. Here, N denotes the total number of electrons,λ0 andλ− represent the re- laxation energies from the neutral (0) and charged (−) system. The 0→1−and 1−→0 many-body transitions which can be accessed experimentally [10] are shown by the blue and green vertical arrows, respectively.
expect for an insulating substrate any excess charge is ex- pected to remain localized on the molecule.
D. Reorganization energy
The reorganization energy (also polaronic shift) quanti- fies the energy gain that results from the reaction of the pentacene/NaCl geometry upon charging. Experimentally, it can be accessed, e.g., by means of the scanning probe setup shown schematically in Fig.1. Formally, the reorganization energy can be defined as
Ereorg:=[E−(N)−E0(N)]−[E0(N+1)−E−(N+1)], (5) whereNdenotes the number of electrons in the neutral system and the suffix indicate whether the total energy corresponds to the structurally relaxed charged (−) or uncharged (0) geometry. The bracketed terms in Eq. (5) are identified as re- laxation energies from the neutral,λ0:=E−(N)−E0(N), and charged, λ−:=E0(N+1)−E−(N+1), system. A sketch representing the calculation procedure is given in Fig.10.
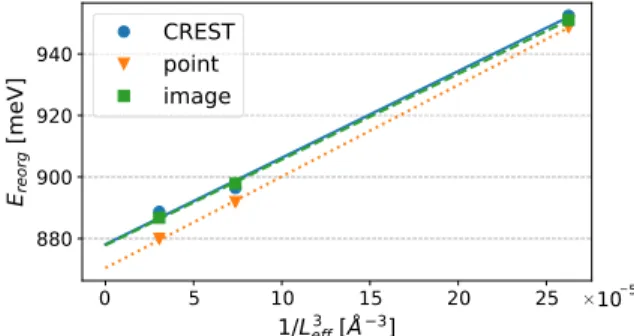
The polaronic shifts obtained for the different models of metal substrate with explicit countercharges (CREST, point, shaped) are summarized in Fig.11. We showEreorgas a func- tion ofL−3eff, where Leff=
Lx,Ly is an effective lateral size (hereLx/yis the length of the supercell in thex/ydirection).
We compare these results to the polaronic shift computed with the jellium model in AppendixC.
We note that our calculations operate with periodic repli- cas of the system and thus do not represent a single molecule but instead a molecular lattice with the supercell size as a lattice constant. Due to its long-range nature, the Coulomb interaction introduces interactions—roughly of a dipolar nature—between the charged molecule and its pe- riodic replicas. Dipolar interactions manifest in Ereorg as finite-size corrections that converge slowly with increasing the effective supercell lateral size. To explore the single-molecule limit, we extrapolate the reorganization energy using a form
FIG. 11. Reorganization energies as a function of 1/L3eff for CREST (blue), point (orange), and image (green) charge compen- sation methods. The straight lines correspond to the linear fit used to extrapolate the reorganization energy in the infinite-size cell limit, Leff→ +∞.
Ereorg(Leff)=a/Leff3 +Ereorg(∞), which is motivated by as- suming parallel dipole-dipole interaction [40]. We extract a polaronic shift, Ereorg(∞), for CREST of 878±9 meV; for point charge, 877.8±0.3 meV and for the shaped image charge distribution, 870.4±0.4 meV.
Similar to the situation of the atomistic structure, we have checked the importance of including CM corrections into the vdW dispersion forces for the reorganization energy. We find that the scaling with the lateral dipole correction yields a pola- ronic shift increased by∼7%, which amounts toEreorg(∞)= 928.6±0.1 meV for the shaped image charge distribution.
The increase in this value is simply a manifestation of the larger ionic displacements after charging due to larger polar- izability of the NaCl surface.
So far, we have not considered the dependence of the reor- ganization energy on the number of NaCl layers,Nl, which was four in our simulations and ∼20 in experiments [11].
From simple electrostatic considerations and taking into ac- count that for large Nl the interaction between the charged molecule and its image charge becomes pointlike, we expect Ereorgto slowly decay with a dominant 1/Nlfunctional depen- dency. We observe, nevertheless, that the impact of different models for the electrostatic interaction between the charged molecule and its image charge is small, as seen in Fig.11and, therefore, the impact on the reorganization energy is predicted to be quantitatively also small. Note that as a difference to the lateral dipole correction to the reorganization energy, the dependency on the number of layers is not a consequence of periodicity of the present single-molecule calculations if the number of NaCl layers would be modified.
V. COMPARISON TO EXPERIMENT A. Experimental measurement of orbital line shapes We turn to the interpretation of the experimental results reported in Pateraet al.[11]. In this experiment, an individ- ual pentacene molecule adsorbed on thick (>20 monolayers) NaCl film was repeatedly charged and discharged by tun- neling from and to the conductive tip of an atomic force microscope. The Coulomb forces from the charged pentacene act on the oscillating tip and thereby lead to a measurable additional dissipation of the cantilever. By measuring this
quantity, the spatially resolved probability to induce different charge transitions by tunneling can be mapped out. With this method, dubbed alternating-charging STM (AC-STM), the electronic transitions 0→1−and 1−→0 have been mapped, which can be associated to tunneling into the LUMO and out of the former LUMO. Here, former LUMO refers to the singly occupied orbital of the pentacene anion which derives from the LUMO of neutral pentacene. As the tunneling process occurs much faster than ionic relaxations, the former and latter transitions proceed in the relaxed geometry of neutral (for 0→1−) and charged (for 1−→0) pentacene/NaCl, respec- tively. In the following, these geometries we denote as geo0 and geo−1, respectively. The slow response to the charge in geo−1 then manifests as an increase of the amplitude in the central lobe of the signal at the expense of a simultaneous decrease in the outer lobes (orbital confinement) as compared to geo0. These differences were attributed to substrate-ion relaxation after electron transfer (polaron formation).
B. Computational results
To simulate the experimental results for polaron formation, we first obtain the former LUMO orbital, (x,y,z), for a charged pentacene/NaCl system before (neutral geometry) and after charge-induced geometry relaxation (charged ge- ometry). We use the same computational settings as in the previous section. For simplicity, we consider line cuts along the main molecular axis (here by convention the ˆxaxis) ob- tained from the 3D wave function,(x)≡(x,y0,z0).
FIG. 12. DFT-calculated probability density for the former LUMO (orbital designation refers to the neutral molecule) of charged pentacene/NaCl using (a) neutral geometry and (b) charged geome- try. The isosurface of the orbitals is cut through a plane located at z=2.4 Å above the molecular plane. (c) One-dimensional densi- ties,|(x)|2≡ |(x,y0,z0)|2, along the molecular long symmetry axis indicated in (a) and (b). The position of the carbon atoms projected onto this axis is denoted by black spheres.
We show in Fig.12the probability density of the former LUMO (orbital designation refers to the neutral molecule) for charged pentacene/NaCl with (a) neutral geometry (geo0) and (b) charged geometry (geo−1) along the main molecular axis.
They are both characterized by seven lobes and are qualita- tively similar to the LUMO of uncharged pentacene/NaCl, as expected. In Fig.12(c), we also show the line cuts,|(x)|2, for the geometries in (a) and (b). We note that taking into account the relaxation of the NaCl film leads to a decrease of the density in the outer lobes together with a small increase for the central lobe only.
The increase in the amplitude of the central lobe at the expense of the outer ones (confinement) as a consequence of relaxation has a twofold origin. The first has been discussed in Sec.IV: The geometry of the molecule changes after charging.
The second is the substrate reorganization shown in Fig.8that effectively leads to a reshaping of the single-particle potential seen by the molecular charge density.
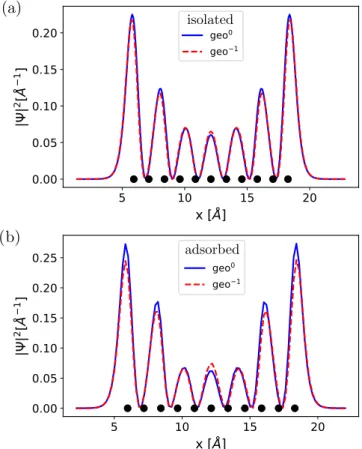
To estimate the relative contributions to confinement, we show in Fig.13the line cuts|(x)|2for (a) the isolated and (b) NaCl-adsorbed pentacene molecule. These cuts have been obtained at a distancez=1.0 Å from the molecular plane.
Although the general trend (orbital confinement) is already
FIG. 13. One-dimensional probability densities, |(x)|2≡
|(x,y0,z0)|2, of the former LUMO orbital obtained along the lines defined in Fig. 12. The lines are contained in a plane located at z=1.0 Å above the molecular plane. Here (a) corresponds to the isolated molecule and (b) to the adsorbed molecule; the continuous blue line refers to the neutral geometry while the red dashed line corresponds to the charged geometry. The position of the carbon atoms projected onto this axis is denoted by black spheres.
present in (a) due to the geometry relaxation of pentacene after charging, we see that this only accounts for approximately 25% of the change in the relative heights of the maxima in (b).
The rest we attribute to substrate reorganization of the NaCl lattice, which also produces the large work-function shifts discussed in Sec.IV.
C. Simulation of tip effects
To simulate effects of the STM tip, we adopt a conventional procedure [41,42] and convolve the molecular orbital (x) with a model wave function for the STM tip:
[∗s](x)= +∞
−∞ (y)s(x−y)dy. (6) We here adopt the approximation
s(x)=exp
−x2
σ2 , (7)
which should be appropriate fors-type tip orbitals. Equation (6) describes the overlap between the tip and molecular or- bitals as the tip slides along the ˆxaxis. In principle, there could be more than one channel (i.e., s wave,p wave, etc.) with additive contribution to the total STM signal [43]. We have verified that possiblep-wave contributions have a negligible contribution to the simulated spatial tunneling amplitude. This is consistent with the fact that the AC-STM signal acquired with a nonfunctionalized copper tip comes mostly froms-type tip orbitals.
Using Eqs. (6) and (7), with a Gaussian broadening of σ =2.5 Å, we obtain the simulated AC-STM spatial tunnel- ing amplitude shown in Fig.14. As a result of the convolution with the tip orbital, the AC-STM signal shows only three lobes. Before structural relaxation, the central lobe has smaller amplitude compared to the two outer lobes (geo0). After re- laxation (geo−1), the situation is reversed: The inner lobe increases the amplitude while the amplitude for the outer lobes diminishes, in very good agreement with the experiment (cf.
Fig.14).
D. Reorganization energy
The reorganization energy for charge transfer is not just a property of the substance under study but strongly de- pends on the environment. Whereas reorganization energies are routinely measured for ensembles, measuring the reorga- nization energy of a single molecule has only recently become experimentally accessible [10]. By means of atomic force microscopy with single-charge sensitivity the hole reorgani- zation energy of an isolated naphthalocyanine molecule has been determined to be 0.8±0.2 eV. These experiments have been conducted for isolated molecules on thick NaCl layers and hence in the same environment as the one considered here. While both molecules are planar and feature delocalized frontier orbitals of theπ-system, naphthalocyanine is slightly larger than pentacene. We therefore estimate the electron reor- ganization energy of pentacene to lie in the same range as for naphthalocyanine, namely, to be on the order of 0.8–1.0 eV.
FIG. 14. DFT-simulated (a) and experimental (b) alternating- charging STM signal profile of charged pentacene adsorbed on a NaCl film. The vertical scale is normalized to one. Blue solid curves correspond to the neutral geometry, geo0, and red dashed curve corresponds to the relaxed geometry, geo−1. The experimental signal reflects the spatially resolved possibility to charge (blue) or discharge (red) pentacene/NaCl, measured as an additional dissipation signal in alternating-charging STM [11].
VI. CONCLUSION
To recapitulate, we have investigated structural and en- ergetic properties of NaCl(001) slabs as well as neutral and charged individual pentacene molecules adsorbed on NaCl(001) films. We have analyzed the geometry (mean layer separation and buckling) both for thin and thick NaCl slabs and found pronounced odd-even effects. We find a strong dimerization between Na+ and Cl− ions of neighboring lay- ers, possessing long-range order that goes deep into the NaCl slab. We provide a precise calculation of the surface energy per area from finite-size scaling of the energy per layer to the bulk limit and obtain the valueγ =9.6±0.2 meV/Å2.
We have also investigated the adsorption properties of isolated pentacene/NaCl. We find that the electrostatic inter- action between the charge density of charged pentacene and the NaCl surface produces a reversal of the buckling pattern on the first layers of the NaCl film. We have checked the con- sistency of our results for different models of screening at the metal substrate that have explicit countercharges and investi- gated the impact of dispersion forces on the pentacene/NaCl atomistic structure. We have calculated the reorganization energy associated to relaxation of the surface upon charging and found it to beEreorg870−930 meV, depending on the
functional used. This observable has so far not been measured for pentacene/NaCl surfaces but the value is consistent with the known reorganization energy of other molecules of similar size adsorbed on NaCl [10]. Finally, we have studied the spa- tial changes of the STM signal associated to the LUMO. We have confirmed fromab initiocalculations and simple model- ing of the tip-sample interaction the localization of the charge density upon relaxation of the molecule-insulator interface as observed in a recent experiment [11]. The experimental results are thus interpreted as being of polaroniclike nature.
ACKNOWLEDGMENTS
The authors acknowledge E. Wruss and O. Hofmann for insightful suggestions. Support from the German Research Foundation (DFG) through the Collaborative Research Cen- ter, Project ID No. 314695032 SFB 1277 (Projects No. A03 and No. B01) is gratefully acknowledged. D.A.E. addition- ally acknowledges funding from the Alexander von Humboldt Foundation within the framework of the Sofja Kovalevskaja Award, endowed by the German Federal Ministry of Educa- tion and Research.
APPENDIX A: BULK NaCl
In this Appendix, we study the bulk properties of NaCl as reference for our investigation of NaCl films. NaCl is an ionic solid formed by the arrangement of two face-centered cubic lattices; one formed by negatively charged Cl−ions and another by smaller positively charged Na+ ions. The Na/Cl lattices are shifted against each other by (1,1,1)a0/2 where a0is the lattice constant.
1. Results
Our computed lattice constants are summarized in TableIV. The lattice constant from our PBE calculations are in good agreement to previous theoretical studies [25,35,44].
Compared to experimental measurements, the lattice constant is overestimated at least 0.06 Å (1%a0). Due to the impact of long-range screening on the polarizability of atoms in solids, we also checked the effect of including vdW dispersion within the TS [24] and TS-CM [25] approaches. The calculated lat- tice constants underestimate the experimental one by at least 0.18 Å (for PBE-TS) and 0.065 Å (for PBE-TS-CM). This
TABLE IV. Lattice constants,a0, and band-gap energies,EG, of bulk NaCl obtained using PBE, and van der Waals-corrected PBE-TS and PBE-TS-CM functionals. The accuracy in the determination of the lattice constant is 0.1 pm and the band gap is 0.01 eV. For comparison, DFT results from Ref. [35] and experimental values from Refs. [46,47] are shown.
a0[Å] EG[eV]
PBE 5.700 5.03
PBE-TS 5.389 5.66
PBE-TS-CM 5.505 5.39
PBE [35] 5.70 5.0
Exp. 5.57 [46]−5.64 [47] 8.5 (optical) [47]
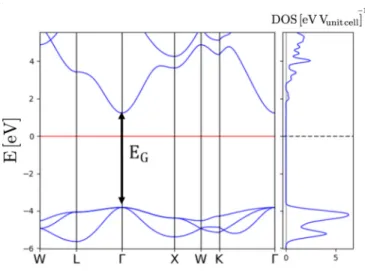
FIG. 15. Band structure and DoS of bulk NaCl obtained using the PBE functional. The band gap at thepoint is denoted byEG. The red horizontal line corresponds to the reference energy within the band gap.
results from overestimation of the dispersion forces for a bulk solid [45].
We show in Fig. 15the band structure of NaCl obtained using the PBE functional (similar band structures are obtained for PBE-TS and PBE-TS-CM here not shown). The band-gap energy for different functionals obtained at thepoint is sum- marized in TableIV. This band gap strongly underestimates the experimental optical gap∼8.5 eV [48] due to well-known artifacts of local and semilocal functionals [49]. For further details on the NaCl band structure, we refer the reader to Ref. [35].
2. Computational details
For bulk NaCl structural optimizations, we have used the FHI-aims “tight” settings [18] (roughly equivalent to double- zeta plus polarization quality) and relaxed the unit cell until the residual value for every component of the force acting in
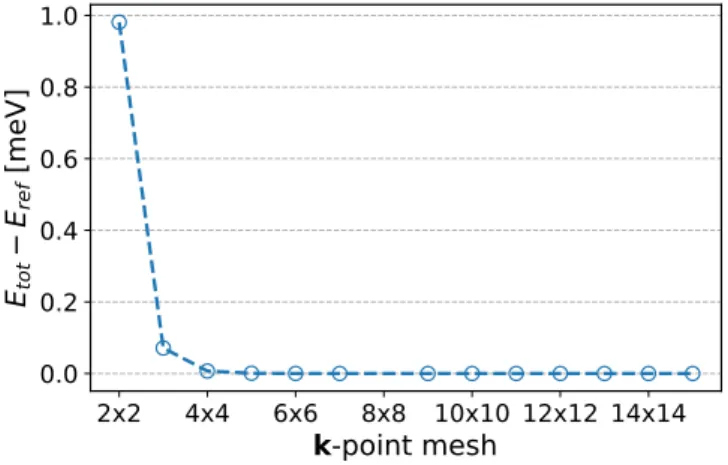
FIG. 16. Variation of the total energy of a 12-layer NaCl(001) slab with respect to vacuum layer thickness. The energies are nor- malized to the reference energy, Eref= −204072.096449004 eV, corresponding to the total energy for 30 Å vacuum.
FIG. 17. Variation of the total energy of a 12-layer NaCl(001) slab with respect to k-point discretization. The energies are nor- malized to the reference energy, Eref= −203227.951979871 eV, corresponding to the total energy fork-mesh of 15×15.
each ion was smaller than 0.005 eV/Å. We considered a dense k-point mesh of at least 8×8×8 sampling in each direction of the Brillouin zone.
APPENDIX B: CONVERGENCE CHECKS
We report some of the checks used to determine the con- vergence of our computational setup for the slab calculations.
Specifically, we show the dependence of the total energy on the width of the vacuum layer in Fig.16and the andk-grid discretization in Fig.17for a slab of widthL=12. Similar convergence tests were carried over for slabs of different widths.
FIG. 18. Reorganization energies as a function of the effective lateral size of the supercell,Leff=
LxLy. The four models for the screening due to the metal surface from Fig.2in the main paper are shown.
APPENDIX C: POLARONIC SHIFT: JELLIUM VERSUS EXPLICIT CHARGE-COMPENSATION
In Fig. 18, we compare the reorganization energy com- puted using the jellium model and different shaped coun- tercharge distributions in the supercell (see main paper). As reported in the main text, the explicit countercharge models for the metallic surface show a convergence with the lateral supercell size. However, no convergence is obtained for the jellium model for which we also report reorganization ener- gies 200−300 meV smaller. The lack of convergence with Leffis a consequence of the failures of the jellium model to de- scribe properly electrostatic long-range Coulomb interactions in charged supercells with vacuum.
[1] J. Repp, G. Meyer, S. M. Stojkovi´c, A. Gourdon, and C.
Joachim,Phys. Rev. Lett.94, 026803 (2005).
[2] J. Repp, G. Meyer, S. Paavilainen, F. E. Olsson, and M. Persson, Science312, 1196 (2006).
[3] N. Pavliˇcek, I. Swart, J. Niedenführ, G. Meyer, and J. Repp, Phys. Rev. Lett.110, 136101 (2013).
[4] L. Gross, B. Schuler, F. Mohn, N. Moll, N. Pavliˇcek, W. Steurer, I. Scivetti, K. Kotsis, M. Persson, and G. Meyer,Phys. Rev. B 90, 155455 (2014).
[5] N. Pavliˇcek, B. Schuler, S. Collazos, N. Moll, D. Pérez, E.
Guitián, G. Meyer, D. Peña, and L. Gross,Nat. Chem.7, 623 (2015).
[6] Z. Majzik, A. B. Cuenca, N. Pavliˇcek, N. Miralles, G. Meyer, L. Gross, and E. Fernández,ACS Nano10, 5340 (2016).
[7] M. Hollerer, D. Lüftner, P. Hurdax, T. Ules, S. Soubatch, F. S.
Tautz, G. Koller, P. Puschnig, M. Sterrer, and M. G. Ramsey, ACS Nano11, 6252 (2017).
[8] P. Hurdax, M. Hollerer, P. Puschnig, D. Lüftner, L. Egger, M. G.
Ramsey, and M. Sterrer, Adv. Mater. Interfaces 7, 2000592 (2020).
[9] W. Steurer, S. Fatayer, L. Gross, and G. Meyer,Nat. Commun.
6, 8353 (2015).
[10] S. Fatayer, B. Schuler, W. Steurer, I. Scivetti, J. Repp, L.
Gross, M. Persson, and G. Meyer,Nat. Nanotechnol.13, 376 (2018).
[11] L. L. Patera, F. Queck, P. Scheuerer, and J. Repp, Nature (London)566, 245 (2019).
[12] S. Fatayer, F. Albrecht, Y. Zhang, D. Urbonas, D. Peña, N. Moll, and L. Gross,Science365, 142 (2019).
[13] F. E. Olsson, S. Paavilainen, M. Persson, J. Repp, and G. Meyer, Phys. Rev. Lett.98, 176803 (2007).
[14] A. S. Martins, A. T. da Costa, P. Venezuela, and R. B. Muniz, Eur. Phys. J. B78, 543 (2010).
[15] I. Scivetti and M. Persson,J. Phys. Condens. Matter25, 355006 (2013).
[16] I. Scivetti and M. Persson,J. Phys. Condens. Matter26, 135003 (2014).
[17] I. Scivetti and M. Persson,J. Phys. Condens. Matter29, 355002 (2017).
[18] V. Blum, R. Gehrke, F. Hanke, P. Havu, V. Havu, X. Ren, K.
Reuter, and M. Scheffler,Comput. Phys. Commun.180, 2175 (2009).
[19] J. P. Perdew, K. Burke, and M. Ernzerhof,Phys. Rev. Lett.77, 3865 (1996).
[20] W. H. Press, S. A. Teukolsky, W. T. Vetterling, and B. P.
Flannery, Numerical Recipes, 3rd ed. (Cambridge University Press, New York, 2007).
[21] A. Tkatchenko, L. Romaner, O. T. Hofmann, E. Zojer, C.
Ambrosch-Draxl, and M. Scheffler,MRS Bull.35, 435 (2010).
[22] R. J. Maurer, V. G. Ruiz, J. Camarillo-Cisneros, W. Liu, N.
Ferri, K. Reuter, and A. Tkatchenko, Prog. Surf. Sci. 91, 72 (2016).
[23] R. J. Maurer, C. Freysoldt, A. M. Reilly, J. G. Brandenburg, O. T. Hofmann, T. Björkman, S. Lebègue, and A. Tkatchenko, Annu. Rev. Mater. Res.49, 1 (2019).
[24] A. Tkatchenko and M. Scheffler,Phys. Rev. Lett.102, 073005 (2009).
[25] G. X. Zhang, A. Tkatchenko, J. Paier, H. Appel, and M.
Scheffler,Phys. Rev. Lett.107, 245501 (2011).
[26] O. T. Hofmann and E. Zojer, World Scientific Reference of Hybrid Materials, World Scientific Series in Nanoscience and Nanotechnology Vol. 2 (World Scientific, Singapore, 2019), pp. 3–40.
[27] M. Deserno and C. Holm,J. Chem. Phys.109, 7678 (1998).
[28] B. Delley,J. Phys. Chem.100, 6107 (1996).
[29] G. Makov and M. C. Payne,Phys. Rev. B51, 4014 (1995).
[30] C. Freysoldt, J. Neugebauer, and C. G. Van de Walle,Phys. Rev.
Lett.102, 016402 (2009).
[31] H.-P. Komsa, T. T. Rantala, and A. Pasquarello,Phys. Rev. B 86, 045112 (2012).
[32] T. Cao and A. Bongiorno,Sci. Rep.7, 2834 (2017).
[33] O. Sinai, O. T. Hofmann, P. Rinke, M. Scheffler, G. Heimel, and L. Kronik,Phys. Rev. B91, 075311 (2015).
[34] J. Vogt and H. Weiss,Surf. Sci.491, 155 (2001).
[35] B. Li, A. Michaelides, and M. Scheffler, Phys. Rev. B 76, 075401 (2007).
[36] For PBE, the interlayer distance |δd¯12| is larger than |δd¯23|.
Surprisingly, this is not the case when including the TS-CM dispersion.
[37] J. P. Perdew and M. Levy,Phys. Rev. Lett.51, 1884 (1983).
[38] L. J. Sham and M. Schlüter, Phys. Rev. Lett. 51, 1888 (1983).
[39] J. B. Neaton, M. S. Hybertsen, and S. G. Louie,Phys. Rev. Lett.
97, 216405 (2006).
[40] J. D. Jackson,Classical Electrodynamics, 3rd ed. (Wiley, New York, 1998).
[41] J. Tersoff and D. R. Hamann,Phys. Rev. B31, 805 (1985).
[42] J. C. Chen, Introduction to Scanning Tunneling Microscopy (Oxford University Press, Oxford, 2007).
[43] L. Gross, N. Moll, F. Mohn, A. Curioni, G. Meyer, F. Hanke, and M. Persson,Phys. Rev. Lett.107, 086101 (2011).
[44] T. Buˇcko, J. Hafner, S. Lebègue, and J. G. Ángyán, J. Phys.
Chem. A114, 11814 (2010).
[45] T. Buˇcko, S. Lebègue, J. Hafner, and J. G. Ángyán,Phys. Rev.
B87, 064110 (2013).
[46] K. Wang and R. R. Reeber,Mater. Sci. Eng. R Rep.23, 101 (1998).
[47] D. R. Lide (Ed.),CRC Handbook of Chemistry and Physics, 76th ed. (CRC Press, Boca Raton, 1996).
[48] N. O. Lipari and A. B. Kunz, Phys. Rev. B 3, 491 (1971).
[49] J. P. Perdew,Int. J. Quantum Chem.28, 497 (1985).
