Supporting Information for
East Atlantic Pattern Drives Multidecadal Atlantic Meridional Overturning Circulation Variability during the Last Glacial Maximum
Zhaoyang Song
1, Mojib Latif
1,2, Wonsun Park
11
GEOMAR Helmholtz Centre for Ocean Research Kiel, Kiel, Germany
2
Excellence Cluster “The Future Ocean” at Kiel University, Kiel, Germany Corresponding author: Zhaoyang Song (zsong@geomar.de)
Contents of this file Figures S1-S8 Table S1
Figures
1 2 3 4 5 6 7 8 9 10 11 12 13 14 15
16
run of (a) the KCM, (c), CCSM4, (e) CNRM-CM5, (g) FGOALS-g2, (i) MPI-ESM-P and (k) MRI-CGCM3. (b), (d), (f), (h) and (j) as in (a), (c), (e), (g) and (i), but for the LGM run.
Figure S2. Spectra of annual AMOC index (defined as maximum stream function) at 30 °N. The
red dashed and solid lines indicate the 95% confidence limit of the Markov Red Noise model in PI and GLAC, respectively.
18 19 20 21
22 23 24 25 26
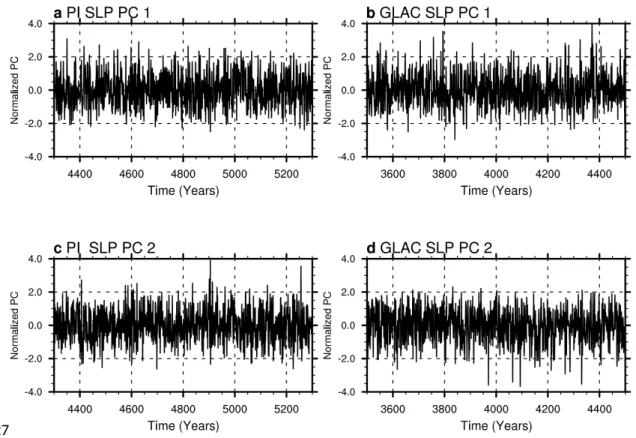
Figure S3. The normalized principal components (PC1) of the leading EOF of JFM SLP calculated from (a) PI and (b) GLAC. (c,d) as (a,b), but for PC2.
27 28 29 30
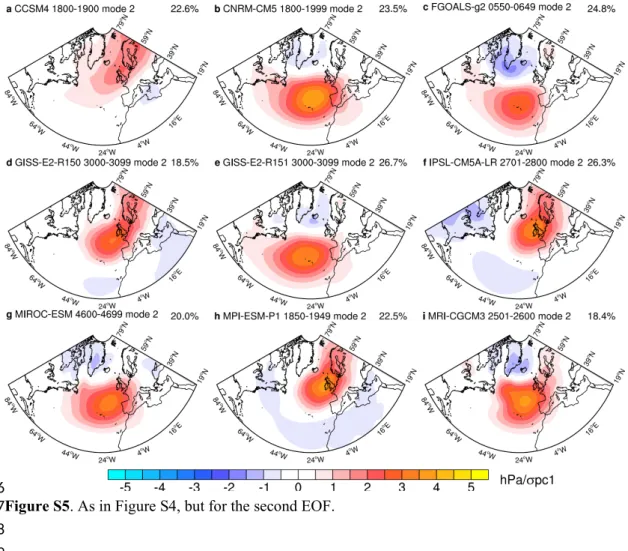
Figure S4. The leading empirical orthogonal functions (EOF1) of JFM sea level pressure
calculated from the LGM runs of the Paleoclimate Modelling Intercomparison Project Phase III (PMIP3). The numbers on the upper right show the variance accounted for by each pattern.
32 33 34 35
Figure S5. As in Figure S4, but for the second EOF.
36 37 38 39 40
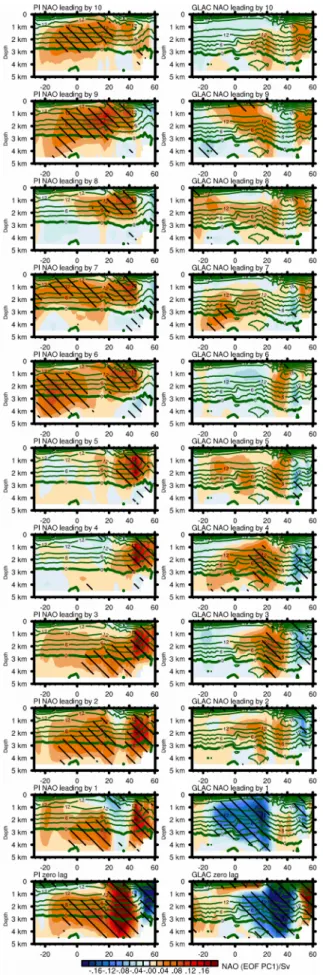
Figure S6. Lag-regressions (from 0 to 10 years) of the overturning stream function on the normalized PC1 (NAO) for PI and GLAC.
42 43
44
45
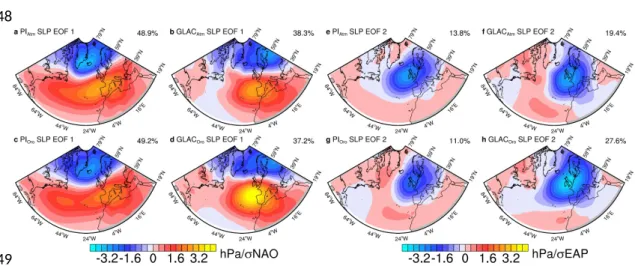
Figure S8. The leading and second most energetic EOFs of JFM sea level pressure calculated
from (a, e) PIAtm, (b, f) GLACAtm, (c, g) PIOro, and (d, h) GLACOro. See Table S1 for details. The numbers on the upper right show the variance accounted for by each pattern.
Tables
Table S1. Experiments with the atmosphere model run in stand-alone mode.
PIAtm PIOro GLACAtm GLACOro
SST & Sea Ice PI GLAC GLAC PI
Orography&Ice Sheet
PI PI GLAC GLAC
Each experiment is integrated for 650 years, with the last 600 years used in the analyses.
48
49 50 51 52 53 54 55 56 57 58 59
60 61