J. Physiol. (I952) II7, 500-544
A QUANTITATIVE DESCRIPTION OF MEMBRANE
CURRENT AND ITS APPLICATION TO CONDUCTION
AND EXCITATION IN NERVE
BY A. L. HODGKIN AND A. F. HUXLEY From thePhysiological Laboratory, University ofCambridge
(Received 10March 1952)
Thisarticle concludes a series of papers concerned with the flow of electric current through the surface membrane of a
giant
nerve fibre(Hodgkin,
Huxley&Katz, 1952; Hodgkin&Huxley,
1952a-c).
Itsgeneral
objectisto discu the results of the preceding papers (PartI), to put them into mathematical form (Part II) and to show thatthey
will account for con-duction and excitation in quantitative terms (PartIII).
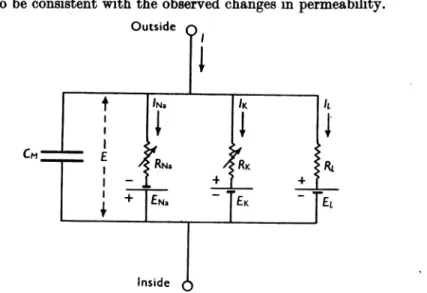
PART I. DISCUSSION OF EXPERIMENTAL RESULTS The results described in the preceding papers suggest that the electrical behaviour of the membrane may be represented by the network shown in Fig. 1. Current canbe carried through the membrane eitherby chargingthe membranecapacityorbymovementof ion-sthroughthe resistances inparallel with the capacity. The ionic current is divided into components carriedby sodium andpotassium ions (INa and
IK),
and a small 'leakage current'(I,)
madeup by chlorideand other ions. Eachcomponent of the ionic currentis determined by a driving force which may conveniently be measured as an electrical potential difference and a permeability coefficient which has the dimensions ofa conductance. Thus the sodiumcurrent (INa) is equalto the sodiumconductance
(9Na)
multipliedby the difference between themembrane potential (E) and theequilibrium potentialforthesodiumion(ENa). Similar equationsapply to'K
andI,
andarecollected onp. 505.Our experiments suggest that
gNa
and9E
are functions of time and membrane potential, but that ENa,EK, El,
CM andg,
may be taken as constant. The influence of membrane potential onpermeabilitycan be sum- marized by stating: first, that depolarization causes a transient increase in sodiumconductance and aslowerbutmaintained increase in potassium con- ductance; secondly, that these changes are graded and that they can be reversed by repolarizing the membrane. In order to decide whether these effectsaresufficienttoaccount for complicatedphenomenasuch as theaction potential and refractory period, it is necessary to obtain expressions relatingMEMBRANE CURRENT IN NERVE
the sodium and potassium conductances to time and membrane potential.
Beforeattemptingthisweshallconsider
briefly
whattypesofphysical
system arelikelyto beconsistent with theobservedchanges
in permeability.Outside
T T IN TK ItE
CM~~~~~~+ +
Inside )
Fig. 1. Electrical circuitrepresenting membrane. RB =l/gNa; RK=l/9K; RI=1/#1. RNw and RKvary withtimeandmembranepotential;the other componentsareconstant.
Thenatureofthepermewablitychange8
At present the thickness and composition of the excitable membrane are
unknown. Ourexperimentsaretherefore
unlikely
togiveanycertain informa- tion about the nature of the molecular events underlying changes in perme- ability. The object of this section isto show that certaintypes oftheory are excluded byourexperiments and that others areconsistentwiththem.The firstpoint which emerges is that the changesinpermeabilityappearto depend on membrane potential and not on membrane current. At a fixed depolarization the sodium current follows a time course whoseform is inde- pendent ofthe current through the membrane. Ifthesodium concentration is such that ENaB<E, the sodium current is inward; if it is reduced until ENa>Ethe current changes in signbut stillappearstofollow the same time course. Furthersupportfor theviewthatmembrane potential isthevariable controllingpermeabilityisprovidedby theobservationthatrestorationofthe normal membrane potential causes thesodium orpotassium conductance to declineto alow valueat anystage oftheresponse.
The dependence of9Na and g9 on membrane potential suggests that the permeability changesarise from theeffect of theelectric fieldon thedistribu- tion ororientation ofmolecules with a chargeor dipolemoment. By this we do not mean to exclude chemical reactions, for the rate atwhich these occur might depend on theposition of a charged substrate or catalyst.
All
that is intendedisthat small changesinmembrane potentialWouldbe mostunlikely 501A. L. HODGKIN AND A. F. HUXLEY
to cause large alterations in the state of a membrane which was composed entirely ofelectrically neutral molecules.
Thenextquestiontoconsider is howchangesin the distribution ofacharged particle might affect the ease with which sodium ions cross the membrane.
Here we cando little morethanrejectasuggestionwhich formed theoriginal basis of ourexperiments (Hodgkin, Huxley &Katz,1949).
According
tothis view, sodiumionsdonot crossthemembranein ionicform but in combination with alipoidsolublecarrier whichbearsalarge negativechargeand whichcan combine with one sodium ion but no more. Since both combined and un- combined carrier molecules beara negative chargethey are attracted to the outside of the membraneintherestingstate. Depolarizationallows the carrier moleculestomove,sothat sodiumcurrentincreasesasthe membranepotential is reduced. The steady state relation between sodium current and voltage couldbecalculatedforthis systemandwasfoundtoagreereasonablywith the observed curve at 0-2msec after the onset of a sudden depolarization. This was encouraging,but theanalogy breaks downif it is pursuedfurther. In the model the first effect ofdepolarization is a movement ofnegatively charged moleculesfrom the outside tothe insideofthe membrane. Thisgivesaninitial outward current, andaninwardcurrentdoesnot occuruntil combinedcarriers lose sodiumtotheinternal solution andreturn totheoutside of themembrane.Inouroriginaltreatmenttheinitialoutward current wasreducedtovanishingly small proportions by assuming a low density of carriers and a high rate of movement and combination. Since we now know that the sodium current takes an appreciable time to reach its maximum, it is necessary to suppose that there are more carriers and that they react or move more slowly. This meansthatanyinwardcurrentshould be preceded byalargeoutward current.
Our experiments show no sign of a component largeenough to be consistent with the model. This invalidates the detailed mechanism assumed for the permeability change but it doesnot exclude the more general possibility that sodium ions cross the membraneincombinationwith alipoid soluble carrier.
Adifferentform ofhypothesisis tosuppose that sodiummovement depends on the distribution of charged particles which do not act as carriers in the usualsense,but whichallowsodium to pass through themembrane when they occupyparticular sitesin themembrane. On this view the rate of movement of the activating particles determines the rate at which the sodium con- ductance approaches its maximum but has little effect on the magnitude of the conductance. It is therefore reasonable to find that temperature has alargeeffect onthe rate of rise ofsodium conductance but arelatively small effect onitsmaximum value. Interms of thishypothesis one might explain the transientnature of the rise in sodiumconductancebysupposingthat the activatingparticlesundergoachemical change after moving from the position whichtheyoccupy when themembranepotential is high. An alternative is to
502
attributethe decline of sodium conductancetotherelatively slow movement of another particle which blocks the how of sodium ions when it reaches a certainpositionin the membrane.
Much of what has been said about the changes in sodium permeability applies equallytothe mechanismunderlying thechangeinpotassiumperme- ability. In this case one might suppose that there is a completely separate systemwhichdiffers from thesodiumsystemin thefollowingrespects:(1)the activating molecules have an affinity for potassium but not for sodium, (2) they move more- slowly; (3) they are not blocked or inactivated. An alternativehypothesisis thatonlyonesystemis presentbut that itsselectivity changessoonafterthe membrane isdepolarized. A situation ofthis kind would arise ifinactivation oftheparticles selective for sodium converted them into particles selective forpotassium. However, thishypothesiscannotbeapplied in a simpleform sincethe potassiumconductance risestoo slowlyfor adirect conversion from a state of sodium permeability to one of potassium permeability.
Oneofthe moststriking properties ofthe membrane istheextremesteepness oftherelationbetween ionicconductance andmembrane potential. Thus
gNa
maybeincreasede-fold byareductionofonly4mV, whilethecorresponding figure for gE is 5-6 mV(Hodgkin & Huxley, 1952a, figs. 9, 10). In order to illustrate thepossible meaning ofthis result weshall suppose thata charged molecule which has some special affinity for sodium may rest either on the inside or the outside ofthemembrane butis present innegligibleconcentra- tions elsewhere. We shall also suppose that the sodium conductance is pro- portionaltothenumber of suchmoleculesontheinside of themembranebut isindependent ofthenumberonthe outside. FromBoltzmann'sprinciple the proportion
Pi
ofthemoleculesonthe insideof themembraneisrelatedto the proportion onthe outside, PO, by=exp[(w +zeE)/kT],
where E isthepotential difference betweenthe outside and the inside of the membrane,wisthe workrequiredtomovethe molecule from the inside to the outside ofthe membranewhen E=0, eis the absolute value of the electronic charge, zisthe valencyofthe molecule (i.e. the number of positive electronic charges onit), kis Boltzmann's constant and T is theabsolute temperature.
Sincewe have assumed that
Pi
+PO
=1 the expression for Pi isPi
=1/[1
+exp- kT )For negative values ofzandwith E sufficiently large and positive this gives
Pi
=constant xexp[zeE/kT].
Inordertoexplainourresultsz mustbe about -6since
k( =R)
is25mV at roomtemperature andg9.oc
exp-E/4 for Blarge. Thissuggests that the particle whose distributionchanges mustbear sixnegative electronic charges, or, if a similar theory is developed in terms of the orientation of a long molecule witha dipolemoment, it musthave atleast three negativecharges on one end and three positive charges onthe other. Adifferent but related approach is tosupposethatsodiummovementdependsonthepresenceof six singlycharged moleculesataparticular sitenearthe inside of the membrane.The proportion of the time that each of thechargedmolecules spends atthe inside is determined byexp-E/25 sothat theproportion of sitesatwhichall sixare atthe insideis exp-
E/4.17.
Thissuggestionmaybegivenplausibility
butnot mathematicalsimplicity by imaginingthatanlumber ofchargesform a bridge or chain which allows sodium ions to flow through the membrane when itis depolarized. Details of the mechanism willprobably notbesettled for some time, but it seemsdifficulttoescapethe conclusion that thechanges in ionic permeability depend on the movement of some component of the membranewhich behaves asthough ithad alarge charge or dipolemoment.If such components exist it is necessary to suppose that their density is relativelylowand thatanumber ofsodium ionscrossthe membraneat asingle active patch. Unless thisweretrue one wouldexpect theincrease in sodium permeability to be accompanied by an outward current comparable in magnitude to the current carried by sodium ions. For movement of any charged particlein the membrane should contribute tothetotal current and theeffectwould beparticularly markedwith amolecule,oraggregate, bearing a large charge. As was mentioned earlier, there is no evidence from our experiments of any current associated with the change in sodium perme- ability, apart from the contribution of the sodium ion itself. We cannot set a definite upper limit to this hypothetical current, but it could hardly have been more thana few per centof themaximumsodium current without pro- ducing aconspicuous effect atthe sodiumpotential.
PART II. MATHEMATICAL DESCRIPTION OF MEMBRANE CURRENT DURING A VOLTAGE CLAMP
Totalmembrane current
The first step in our analysis is to divide the total membrane current into acapacity current and anionic current. Thus
I=CM d+ i,
(1)
5,.4
where
I is thetotal membrane current density (inward currentpositive);
Ii
isthe ionic current density (inward currentpositive);V isthedisplacementof themembranepotentialfrom its
resting
value (depolarization negative);CMis the membrane capacity per unit area (assumed constant);
t istime.
The justification for thisequation is that it is thesimplestwhichcan be used andthat it gives values for the membranecapacitywhichare
independent
of themagnitudeorsignofV andarelittleaffectedbythe timecourseofV(see, for example, table 1 of Hodgkin et al. 1952). Evidence that the capacity current and ionic currentareinparallel (as suggestedbyeqn. (1)) isprovidedby
thesimilarity
between ionic currents measured withdV=
0 and thosedV~~~~~~~~~d
calculated
from-CM dt
with I=0(Hodgkin
etal.1952).
The only major reservation which must be made about eqn. (1) is that it takesnoaccountof dielectriclossinthemembrane. There is no simple way of estimatingtheerrorintroduced by this approximation, but it isnotthought to belarge since the time course of the capacitative surge was reasonably close tothat calculated fora perfect condenser (Hodgkin et al. 1952).
The ioniccurrent
Afurthersubdivision of themembrane current can be made bysplittingthe ionic current into components carried by sodium ions
(INa),
potassium ions(IK)
and other ions(I):
i=INa
+IK
+I (2)The individual ionic currents
Inthethird paper of this series(Hodgkin &Huxley, 1952 b), weshowed that the ionic permeability of the membrane could be satisfactorily expressed in termsofionicconductances
(9Na,
I andgl).
Theindividual ionic currents are obtained from these by the relations'Na=gNa (E ENa),
IK=gK (E-EK),
II= lg= (E-.El),
whereENaand
EK
are theequilibrium potentials for the sodium and potassium ions. El is thepotential at which the 'leakage current' due to chloride and other ions is zero. For practical application it is convenient to write theseequationsin the form
INa=gNa
(V-VNa) (3)IK
9EK(V -VK),
4It
l91(V V-Vl), (5)
where
V=E-Er,
VNa=ENa-Er,
VK= EK-Er,
VI=Ei-Er,
and Er is theabsolute value of theresting potential. V
VgN, VK
andVI
can then be measureddirectly as displacementsfrom theresting
potential.The ionic conductances
The discussion in Part I shows that there is littlehope ofcalculating the time course ofthe sodium andpotassium conductances fromfirst principles.
Our object here is to find equations which describe the conductances with reasonable accuracy and aresufficiently simple fortheoretical calculation of the action potential and
refractory
period. For the sake of illustration we shall try to provide a physical basis for the equations, but must emphasize that the interpretation given is unlikely to provide a correct picture of the membrane.8
,,E5 A
004
EE 3 -
0
I I I I I I .1 I I I I
0 1 2 3 4 5 0 1 2 3 4 5
msec msec
Fig. 2. A, rise ofpotassium conductance associated with depolarization of25mV; B, fall of potassium conductance associated with repolarization to the resting potential. Circles:
experimental pointsreplotted fromHodgkin& Huxley (1952b, Fig. 13). The lastpointof Ais thesameasthefirst point in B. Axon 18,210 Cincholineseawater.The smooth curve isdrawnaccordingtoeqn. (11) withthefollowingparameters:
CurveA CurveB
(V= -25 mV) (V=0)
9qKo 009m.mho/cm2 7.0 m.mho/Cm2 9gOo 7-06m.mho/cm2 009m.mho/cm'
n075 msec 11msec
At the outsetthere is the difficulty that both sodium and potassium con- ductancesincrease withadelay when theaxonisdepolarized butfallwithno appreciableinfiexionwhen it is repolarized. Thisisillustratedbythecircles in Fig. 2, which shows the change in potassium conductance associated with adepolarizationof 25mVlasting4-9msec. Ifg9 is used as avariablethe end ofthe recordcanbefittedbyafirst-orderequation but a third- orfourth-order equation is needed to describe the beginning. A useful simplification is
MEMBRANE CURRENT IN NERVE
achievedbysupposingthatg9 isproportionaltothefourth power ofavariable which obeys a first-order equation. In this case the rise of potassium con- ductancefrom zero to a finite value isdescribed by (1-exp(-t))4, while the fallis given by exp(-4t). The riseinconductancetherefore showsa marked inflexion, while the fall is a simple exponential. A similar assumption using a cube instead of a fourth power describes the initial rise of sodium con- ductance, but a termrepresenting inactivation mustbeincludedto coverthe behaviour at long times.
Thepotassium conductance
The formal assumptions used to describe the potassium conductance are:
- n4 (6)
dnddn =n
(1-n)-
Bnn, (7)
where g is a constant with the dimensions of conductance/cm2, cx and
/n
are rate constants which vary with voltage but not with time and have dimensions of
[time]-',
n is a dimensionless variable which can varybetween 0and 1.Theseequationsmay begivenaphysicalbasis ifweassumethatpotassium ionscanonly cross the membrane whenfoursimilarparticlesoccupy acertain regionofthemembrane. n represents theproportion oftheparticlesin a certain position (for example at the inside of the membrane) and 1-n represents the proportion that are somewhere else (for example at the outside of the membrane). an determines the rate of transfer from outside to inside, while
fln
determines the transfer in the opposite direction. If the particle has a negativechargeanshould increaseandfin
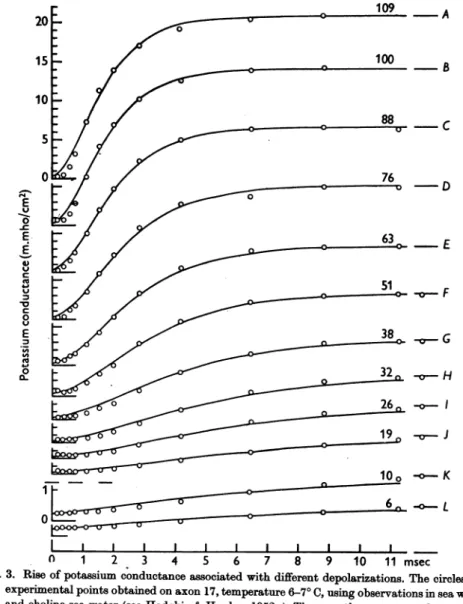
should decreasewhen themembrane isdepolarized.Application of these equations will be discussed in terms of the family of curvesin Fig. 3. Here the circles are experimentalobservations of the rise of potassium conductance associated with depolarization, while the smooth curves aretheoretical solutions of eqns. (6) and (7).
Intheresting state, defined by V=0, nhas a resting value givenby anO
no
-n
+finO'
If V ischangedsuddenly can and n instantly take up values appropriate to the new voltage. The solution of (7) which satisfies the boundary condition that
n=no
when t=O isn=na,,-(nn-no)
exp(-t/rn),
(8)where
no,
=an/(Xn+fAn)
(9)and
rTn
=l/(An
+n).
(10)507
508 A. L. HODGKIN AND A. F.
HUXLEY
From eqn. (6) thismay be transformed into a form suitable for
comparison
withthe
experimental results,
i.e.9
={(gK)
-[(9K1) -(gKo)*]
exp(-t/T)}',
(11) wheregt-
is the valuewhich the conductance finaly attains andgEo
is the conductance at t=O. The smooth curves in Fig. 3 were calculated from20 20
_ _9L. ~~~~~~~~~~~~~109
- A15 100
-B
10
8 E
4,J
_ ~ ~~~~~~~
c'5
-V~~ ~ ~ ~ ~ ~ ~ ~ ~ ~ ~~~o
10
-C
0~~~~~~~~~~~~~~
1
_1
FE
E~~~~~~~~~~~~~~ L
co
0 3
n 1 2 3 4 s 6 7 8 9 10 11msec60
0~
Fig. 3. Rise of potassium conductance associated with different depolarizations. The circles are experimental points obtained onaxon17, temperature6-70C, using observations in sea water andcholine sea water (seeHodgkin &Huxley,1952a). The smoothcurveswere drawn from eqn. (11) with9KO==024m.mho/cm2 and other parameters as shown in Table 1. The time scale applies to all records. The ordinate scaleisthe same in the upper ten curves (A to J) and isincreased fourfold in the lower two curves (K andL).The number on each curve gives thedepolarization in mV.
eqn. (11) with a value of Zr chosen to
give
the best fit. It will beseen that there is reasonable agreement between theoretical andexperimental
curves, except that thelatter showmore initialdelay.
Betteragreementmight
have been obtained withafifthorsixth power, but theimprovement
wasnot con- sidered tobe worththeadditional complication.The rate constants an andf,n. Atlargedepolarizations
gK.
seems toapproach an asymptote about 20-50% greater than the conductance at -100mV.TABLE 1. Analysisof curves inFig.3
v 9KO n,x, Tnpnfn
(mV) (m.mho/cm') (msec) (msec-1) (msec'L)
Curve (1) (2) (3) (4) (5) (6)
- (-0c) (24.31) (1-000) -
A -109 20*70 0*961 1.05 0.915 0 037
B - 100 20-00 0.953 1-10 0*866 0*043
C - 88 18-60 0*935 1*25 0*748 0-052
D - 76 17-00 0*915 1.50 0*610 0057
E - 63 15-30 0-891 1-70 0*524 0064
F - 51 13*27
0.859
2-050*419
0-069G - 38 10*29 0*806 2;60 0.310 0*075
H - 32 8-62 0*772 320 0-241 0-071
I - 26 6*84 0-728 3-80 0*192 0-072
J - 19 5*00 0*674 450 0.150 0*072
K - 10 1*47 0*496 5-25 0095 0*096
L - 6 0*98 0.448 5-25 0*085 0*105
(0) (0.24) (0-315) - -
Col. 1showsdepolarizationinmV; col. 2,finalpotassiumconductance;col.3,n00=(9K0/§F);
col. 4, time constantused tocompute curve;col. 5, n,.=n0v/r;col. 6,fin=(1 -n0)/v,,.Thefigure of24-31waschosen for,Kbecauseitmade theasymptotic value ofn005% greater thanthevalue at -100mV.
For the purpose of calculation we assume that n=1 at the asymptote which istaken as about 20
%
greater than thevalue Of9gK0
at V=-100
mV. These assumptions are somewhat arbitrary, but should introduce little error since wearenotconcerned with the behaviourof9g
atdepolarizations greater than about 110 mV. In theexperiment illustrated by Fig. 3,gK.=20m.mho/cm2
at V= -100 mV.
9E
was therefore chosen to be near 24m.mho/cm2. This valuewasused tocalculaten0 atvariousvoltages by means of eqn. (6). anand fncouldthenbeobtained from thefollowing
relationswhichare derived from eqns.(9)
and(10):
aBn=
(l-o)1r'W
The results of analysing the curves in Fig. 3 by this method are shown in Table 1.
An estimate of the resting values of
an
andfin
could be obtained from the decline in potassium conductance associated with repolarization. The pro- cedure was essentially the same but the results were approximate because therestingvalueof thepotassium conductancewas notknown withany accuracy when the membrane potential was high. Fig. 2 illustrates an experimentin which the membrane potential was restored to itsresting value after a de- polarization of 25 mV. It will be seen that both the rise and fall of the potassium conductance agree reasonably with theoretical curves calculated fromeqn. (11) after an appropriatechoiceof parameters. The rateconstants derived from these parameters were (in msec-1): o=021,
f,n-
=070 whenV=0 andocn= 090, fin=043 when V= -25mV.
Inordertofind functionsconnectingOcn and
fiP
with membranepotentialwe collected all our measurements and plotted them against V, as in Fig. 4.Differences in temperature were allowed for by adopting a temperature coefficient of3(Hodgkinetal. 1952) andscalingto60C. The effect ofreplacing sodium by choline on the resting potential was taken into account by dis- placingtheoriginfor values in choline seawaterby + 4mV. The continuous curves, which areclearlyagoodfitto theexperimental data, werecalculated fromthefollowingexpressions:
0X=001
(V +10)exp
0 -(12)
n
~
O/L 10 ~,(2Pn=0
125 exp(V/80), (13)
where
an
andfinaregiveninreciprocalmsecand V is thedisplacementofthe membranepotential from itsresting value in mV.These expressions should also give a satisfactory formula for the steady potassium conductance
(gK-)
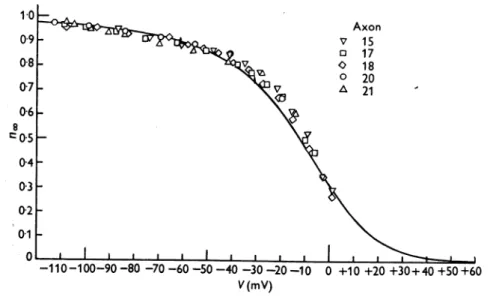
atanymembranepotential (V),forthis relation is implicit in themeasurement of xn andfin. This is illustrated by Fig. 5, in which theabscissa is the membrane potential and the ordinate is(g9/9,K)1.
The smooth curve was calculated from eqn. (9) with an and fn substituted from eqns. (12) and (13).
Fig. 4 shows that
fin
is small compared to an over most of the range; we therefore do not attach much weight tothe curve relatingfin
to V andhave usedthe simplest expression whichgave areasonable fit. The function for on was chosen for two reasons. First, it is one of the simplest which fits the experimental results and, secondly, it bears a close resemblance to the equation derived byGoldman(1943)for the movements of a charged particle inaconstantfield. Ourequations can therefore be given a qualitative physical basis if itis supposed that the variation of oc and fi with membrane potential arises from the effect of the;; electric field on the movement of a negatively chargedparticle which rests onthe outside of themembrane when V is large and positive, and on the inside when it is large and negative. The analogy cannot be pressed since ac and f are not symmetrical about B =0, as they shouldbe ifGoldman'stheory held in a simple form. Better agreement mightetn
/8,
Axonv v 15
o * 17
o~* 18
o * 20
A A 21
x 23
+ 24
" 26
-110-100-90-80-70--60-50-40-30-20-10 0 10 20 30 40 50 V(mV)
Fig. 4. Abscissa: membrane potential minus resting potentialin seawater. Ordinate:rate constantsdetermining rise (a")orfall(Bn) ofpotassium conductance at6° 0. The resting potentialwasassumed to be 4mVhigherincholineseawaterthan inordinaryseawate:
Temperature differenceswereallowedforby assumingaQloof 3. All values for V<0were
obtainedby the methodillustratedby Fig. 3 and Table 1;those for V> 0 wereobtained from the decline of potassium conductanceassociatedwithanincrease of membranepotential
orfrom repolarizationtotheresting potentialincholineseawater(e.g. Fig. 2). Axons 17-21 at6-11'C, the remainder atabout 200 C. The smoothcurves were drawnfrom eqns.(12) and(13).
Axon
1
01~~~~ ~ ~~~~~~~~~~~0 2
0t Fe
A21
-036-
0-5~- ~ ~ ~ ~
0-4 - 0-3 -
0-1 _
-110-100-90 -80 -70 -60 -50 -40-30-2o0-10 0 +10 +20 +30+40 +50 +60 V(mV)
Fig. 5. Abscissa: membranepotential minusresting potential inseawater. Ordinate:experi- mental measurements ofn, calculated from the steady potassium conductance by the relation n.=$gK./190),where9Kisthe'maximum' potassiumconductance. The smooth
curveisdrawnaccordingtoeqn. (9).
1.0 0*9 _ 08 N4 0-7 E
c 06
0
2' 04
0V
a-v 0,4
0
0-3 0-2 01 0
ccn
be obtainedbypostulatingsomeasymmetry in thestructureof themembrane, but thisassumptionwas regarded as too speculative for
profitable
considera- tion.Thesodium conductance
There are at least twogeneral methods ofdescribing the transientchanges insodium conductance. First,wemightassumethat the sodium conductance isdetermined by a variable which obeysasecond-order differentialequation.
Secondly, we might suppose thatit is determined by two
variables,
each of which obeys a first-orderequation. Thesetwoalternativescorrespondroughly
to the two general types of mechanism mentioned in connexion with the natureof inactivation (pp. 502-503). The second alternativewaschosen since it was simpler toapply to theexperimental results.
Theformal assumptionsmade are:
gNa=--
n0hgNa,
(14)diJm (1-m)-Pmm, (15)
dt =
(1-h)-#,%hi
(16)where9Na is a constant andthe oc's and
P's
arefunctionsof V butnotoft.These equations may be given a physical basis if sodium conductance i's assumedtobeproportionaltothenumber ofsitesonthe inside of themembrane which are occupied simultaneouslyby three activatingmolecules butarenot blocked by an inactivating molecule. m then represents the proportion of activating molecules onthe inside and
1-rn
the proportion on the outside;h is the proportion of inactivating molecules on the outside and 1-h the proportion onthe inside.
a,m
or#
andPm
orOh represent the transfer rate constantsin the twodirections.Applicationof theseequations will be discussed first intermsof thefamily of curvesinFig. 6. Here the circles are experimental estimates of the rise and fall of sodiumconductance during a voltage clamp, while the smooth curves werecalculated from eqns. (14)-(16).
The solutions of eqns. (15) and (16) which
satisfy
theboundary
conditionsm=mo
andh=ho
att=0 areM=
m,0-(mo- mo) exrp (tm)(17)
h=
h.-(h. -ho)
exp(-t/lrh),
(18) where mor/(oc,
+fl)
andTmm=l/(am+fPm)9
h> =
(I/(Ch
+Ph)
and Th=I/(h
+Ph)-
Intheresting statethe sodiumconductanceis very smallcomparedwiththe value attained during a large
depolarization.
We therefore neglectrn
if theMEMBRANE CURRENT IN NERVE
depolarization is greater than 30mV.
Further,
inactivation is very nearly complete if V< -30mVsothath.,
mayalsobeneglected.Theexpression
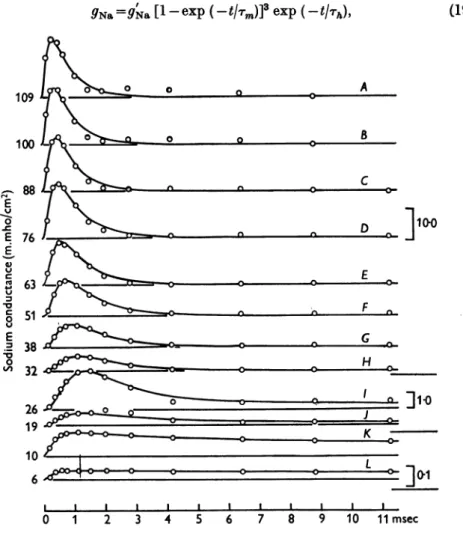
for the sodium conductancethenbecomes9Na=gNa[1-exp (-rtI)]3 exp(-
tI'T),
(19)109 o o o A
100L
,88
_E
0 1-
E 76
E~~~~~~~~~~~~~~~
63 0
u
0 51 i
E
38G
°l 32 < ~
19
10 E I L
6 ]0 0.
0 1 2 3 4 5 6 7 8 9 10 11msec
Fig.6. Changesof sodiumconductanceassociated with differentdepolarizations.Thecirclesare experimental estimatesof sodium conductance obtained on axon 17, temperature 6-70C (of. Fig. 3). The smoothcurves aretheoreticalcurves with parameters shown in Table 2;
AtoHdrawn fromeqn.19,ItoLfrom 14, 17, 18 withgN,=70*7m.mho/cm2. The ordinate scalesontherightaregiven inm.mho/cm2.The numbers on the left show thedepolarization inmV.The time scale applies to all curves.
where
g.=9N.m3. ho
and is the value which the sodium conductance would attain if h remained at its resting level(ho).
Eqn. (19) was fitted to an experi- mental curvebyplottingthelatter on double log paper andcomparing it with a similar plotof afamily oftheoretical curves drawn with different ratios of.m
to rh. Curves A toHinFig.
6wereobtainedby
this method andgave thePH. CXVII. 33
A. L. HODGKIN AND A. F. HUXLEY
0000~~~Mmm 00
_~~ ~ ~~~a to=08 -
_~~ ~ ~ ~~~o m CaC_
0
_ xo
0~ ~ ~ 0
cq ~ ~ 00c
Ca El~~~~~~~~~~~~~~~~C
~8
10 o os'4a 0
< o o Lo_ oto _o o oo _o C
Q Co r ce oo
rs cS $ on e e
eDo~~~~~~~~~~~~~~~~~~(
C-a
___ 00 C K
o w
000 00ca
2 <>ee0000 .#
co
Hs _
r M00-0000000000 9
_ d~~~~~0
~~ 0rI)~O
OQ :c t>o 5;: >u>c
514
values of
g9,
Tmand -rhshowninTable 2. Curves I to L were obtained from eqns.(17)and(18)assumingthath.
andThhad values calculated from experi- ments describedin apreviouspaper (Hodgkin& Huxley, 1952c).The rate constants aCm and
Pm.
Havingfitted theoretical curves to theexperi- mentalpoints, 0wmandPm
werefoundbyaproceduresimilartothat used withan
andfln,
i.e.amm=m,oom,/mT=(P -m)ITm.
the value of m0O being obtained from -/gN onthebasis that
m.
approaches unity atlarge depolarizations.°tm fm Axon
10 _ a 17
9 VVv 0v 20
8 Ak* 21
8-110-0-08-0-05-03-01 0 0
v v 21
0 v
.~~~~~~~~41
E c
-6 m
C
0~~~~
40
2 1
e
-1 10-100 -90 -80 -70 -60 -50 -40 -30 -20 -10 0 +10 V(rr)Fig. 7. Abscissa: membrane potential minus resting potential in sea water. Ordinate: rate constanta (a. andf,m)determininginitialchangesin sodium conductance at 60C. Allvalues forV<0were obtainedby the methodillustratedby Fig. 6 and Table 2;the value at V=0 was obtained from thedecline in sodiumconductanceassociated withrepolarization to the resting potential. Thetemperature varied between 3 and 1100 andwas allowed for by assumingaQloof3.The smooth curves were drawn from eqns. (20) and (21).
Values ofomand
Pm
werecollected fromdifferentexperiments,reduced to atemperature of60 C by adopting aQlo
of 3 and plotted in themanner shown inFig. 7. The pointfor V=0 was obtained from what we regard as the most reliable estimate of the rate constantdetermining the decline of sodium con- ductance when the membrane is repolarized (Hodgkin & Huxley, 1952b, table 1, axon 41). The smooth curves in Fig. 7 were drawn according to theequations:
V+25um=to1 (V+ 25)/(exp
10 -1),(20)
Pm=
4exp(V/18), (21)where xmand
Pm
areexpressed in msec-I and V is in mV.33-2
HODGKIN AND A. F. HUXLEY
Fig.8 illustrates the relation between
m.
and V. The symbols are experi- mentalestimatesand the smooth curve was calculated from the equationmoo =ocmI(om +Pm) (22)
wheream and
Pm
have the valuesgiven by eqns. (20) and(21).Therateconstantsowh and
Ph.
Therate constants for theinactivationprocess werecalculated from theexpressionsx,h
=hx./,Ir,
Axon o 17
m.m o 2
1*09 , v 21
08 V
07 06 0,5 04 03 02 01
-110-100 -90-80 -70 -60 -50-40-30-20-10 0 +10 V(mV)
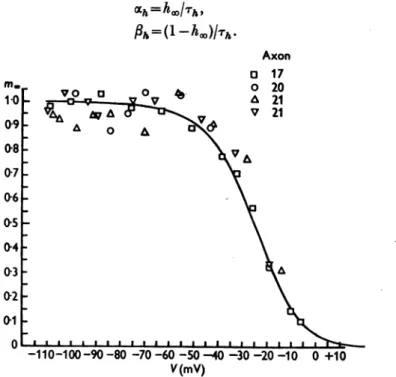
Fig. 8. Abscissa: membrane potential minus resting potential in sa water. Ordinate: mt obtainedbyfittingcurvestoobserved changesinsodiumconductanceatdifferentdepolariza- tions (e.g. Fig. 6 and Table2). The smooth curve isdrawnaccording toeqn. (22). The experimental points are proportionaltothecube root of the sodium conductance which wouldhave been obtainedif there werenoinactivation.
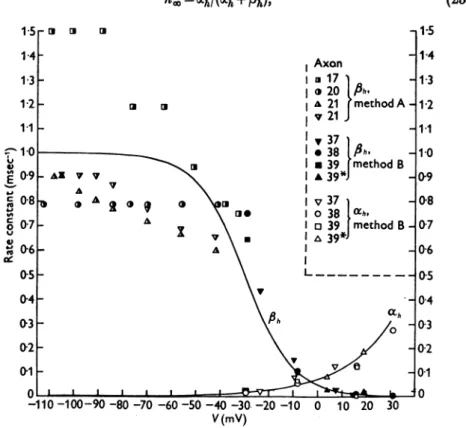
Values obtained by these equations are plotted against membrane potential in Fig. 9. Thepoints for V < -30mV were derived from the analysis described in this paper (e.g. Table 2), while those for V > -30mV were obtained from the results given in a previous paper (Hodgkin & Huxley, 1952 c). A tem- peraturecoefficient of 3 was assumed anddifferencesinrestingpotential were allowed for by taking the origin at a potentialcorrespondingto
h.
=0-6.Thesmoothcurves in this figure were calculated from the expressions
ahX=0-07
exp(V/20), (23)and II V+301)
Ph --Jrx
10+I(24)
516
NERVE
Thesteadystaterelation between
h.0
and V is shown inFig.
10. The smooth curve is calculated from the relationh0=
(ch/(ch
+Ph)' (25)
15- a o 15
14- Axon 1-4
13 - 17 _13
|20
Ah.
131.2 - v I 21 methodA 1-2
1-1
~~~~~~~~~~~~~~V21J
v 37
110 ;v38 1 fih, 1.0
el I*139a method B
0-9-As v v A*39* _ 09
08 ° A 2 ° 8 ° \D | V37 _08
ul A o- I o 38 °xh,
O 0-7 - ^ \I ca 39 method B 0-7
U
J~~~~~~~~
Q x v \ x I
39*0
0,,06 - A 0-6
05 - L_________-- 0-5
0,4 It 0-4
03 -: ah 0-3
0,2 - \ S/ _02
01 _ e 01
0 ~~~~~~~~~~~~~~~0
-110-100-90-80-70-60-50-40-30-20-10 0 10 20 30 V(mV)
Fig.9. Rateconstantsofinactivation (ahandfPh)asfunctions of membrane potential (V). The smooth curves werecalculated fromeqns.(23)and(24). The experimental values ofahandfih wereobtained from datasuch asthoseinTable 2ofthispaper(methodA)orfrom thevaluesof Thandho:>given inTable1ofHodgkin&Huxley(1952c)(method B).Temperature differences wereallowed for by scalingwithaQloof 3. Axon39 was at190C;allothersat3-9°C.The values foraxons 37 and39*weredisplacedby -1-5and -12mVinordertogiveh. =0-6 at V=0.
with ah and
Ph
given by eqns. (23) and (24). If V > -30 mVthis expression approximates to the simple expression used in a previous paper (Hodgkin &Huxley, 1952c), i.e.
h=/(+expVh
-V)
where
Vh
is about -2 and isthe potential at whichh.,
=0-5. Thisequation is the same asthat givingthe effect of a potential difference ontheproportion of negatively charged particles on the outside of a membrane to the total numberof suchparticlesonbothsides of the membrane (see p. 503). It is there- fore consistent with the suggestion that inactivation might be due to theA. L. HODGKIN HUXLEY
movement ofa negatively charged
particle
which blocks the flow of sodium ionswhen itreaches the inside of the membrane. This isencouraging,
but it must be mentioned that a physical theory of this kind does not lead to satisfactory functions foroch and hwithout further ad hoc assumptions.h,x, h.
10 - , 10
0;9 Axon 09
O 38
08 o 39 08
07 & 39* 07
06- 06
05 0_5
04 04
0-3 0-3
02- 02
0*1 0 01
0 0
-100 -90 -80 -70 -60 -50 -40 -30 -20 -10 0 10 20 30 40 50 V(mV)
Fig. 10. Steadystaterelationbetweenhand V.The smooth curve isdrawnaccordingtoeqn.(25).
The experimentalpoints arethosegiven inTable 1 ofHodgkin&Huxley(1952c). Axon38
(50
C)asmeasured. Axon39(190
C) displaced -1-5 mV. Axon39*(30
C,fibre inderelict
state)displaced -12mV. Thecurvegivesthefractionof thesodium-carryingsystemwhich isreadilyavailable,as afunction of membrane potential,in thesteady state.
PART III.
RECONSTRUCTION
OF NERVE BEHAVIOUR The remainder ofthis paper will bedevoted to calculations ofthe electrical behaviour of a model nerve whose properties are defined by the equations which were fitted in Part II to the voltage clamp records described in the earlier papers of this series.Summary of
equations andparameters
Wemay first collect theequations which give the total membrane current I as a functionoftimeand voltage. These are:
I
=CMdt
dV+#Kn (V-VK)
+9Nam3h (V-VNa)
+91(VV-)
(26)where
dnl/dt
=ocn(l-n)-Pn,
(7)dm/dt=
m(1-m)-P.m,
(15)clh/clt
=oc,(l 1-h)
-# h)
(16)
518CURRENT IN NERVE
and
yn=001
(V+10)/(exp1O
-1), (12)/n3=0.125
exp(V/80),
(13)om=O-l (V+25)/(exp
VZ2 -1),
(20)f3m=4
exp (V/18), (21)Xh= 007 exp
(V120), (23)
h=1
/(expV+30+1). (24)Equation(26) isderivedsimply from eqns. (1)-(6)and (14) inPart II. The fourterms ontheright-hand side give respectively the capacity current, the currentcarriedbyKions,thecurrentcarriedbyNaions andthe leakcurrent, for 1 cm2 ofmembrane. Thesefour components areinparallel andadd up to givethetotalcurrentdensity throughthe membrane I. The conductancesto Kand Na are given by theconstants
gK
and 9NaXtogetherwith the dimension- less quantities n, m and h, whose variation with time after a change of membranepotential is determined bythe three subsidiary equations (7), (15) and (16). Thea'sand,B'sintheseequations dependonlyontheinstantaneous value ofthemembranepotential,and aregivenby theremainingsixequations.Potentials are given in mV, current density in
IzA/cm2,
conductances in m.mho/cm2, capacity injuF/cm2,
and time in msec. The expressions for the cc'sandP's
areappropriateto atemperature of6.30 C; for other temperatures theymustbe scaled withaQlo
of 3.The constants in eqn. (26) are taken as independent of temperature. The valueschosenare given inTable 3, column 2, and maybe comparedwith the experimental values incolumns 3and 4.
Membranecurrentsduring avoltage clamp
Before applyingeqn. (26) to the action potential it iswell to check that it predicts correctly the total current during a voltage clamp. At constant voltage dV/dt=0 and the coefficients a and ,B are constant. The solution is thenobtained directly intermsof the expressions alreadygiven for n,mandh (eqns. (8), (17)and (18)). Thetotal ionic current was computed from these for anumber ofdifferent voltages and is compared with a series of experimental curvesinFig. 11. Theonly importantdifferenceisthat the theoretical current has too little delay at the sodium potential; this reflects theinability of our equationstoaccount fully for the delay in the rise ofg9 (p. 509).
'Membrane' andpropagated actionpotentials
By a 'membrane' action potential is meant one in which the membrane potential is uniform, at each instant, over the whole of the length of fibre
A. L. HODGKIN AND A. F. HUXLEY
r _
&
:.
+ aI -+10
'+
m -434
A
0 1+q? -
_0eq P -CB
0
es 0
EH
i'iv
1C)
o >z
._0e C)
'0CBql
-0>
3~°
Ca
00
0 14.
o
eqeoq±
- 0
0
* *1
.-4
520
0 C)
P..
eo-
eqeq
*
P-
coCO0
I--
O d _
V ^4 Cz wX
MEMBRANE CURRENT IN NERVE
a ~ 5 mV
120!LA/cm2
-5mVI20yA/cm2
-10mV
C
-2O~~~mVI1OOpA JCM -18
mVI1 pA/cm2
D
I05uAIcM2
d
f00ouAIcM2
-7m-30 mV
0 10 20msec
I-I
I - . . . _ I _ I I I0 10 20m.ec
N-130mV~
oI * 2I I 4I I 5I * * Im 0 1*2 3 4 5 6 msec | |
0 1 2 3 4 5 6 7msec 0 1 2 3 4 5 6 7msec
Fig. 11. Left-hand column: timecourseof membranecurrent during voltageclamp,calculated for temperatureof40C from eqn.(26) and subsidiaries andplottedonthesamescale asthe experimentalcurves intheright-handcolumn. Right-handcolumn: observed timecourseof membrane currents during voltage clamp. Axon 31 at 40C; compensated feedback. The timescalechangesbetweend,Dand e, E. Thecurrentscalechangesafterb, B;c,C; d, D andf,F.
A. L. HODGKIN AND A. F. HUXLEY
considered. There isno current alongtheaxis
cylinder
andthenetmembrane current must therefore always be zero, exceptduring
the stimulus. If the stimulus is a short shock at t=0, the form of the actionpotential
should be given bysolvingeqn. (26)with I=0and theinitial conditions that V=Vo
and m, n andhhavetheirresting steadystate values,when t=0.The situation ismorecomplicatedinapropagatedactionpotential.The fact that the local circuit currents have to be provided
by
the net membrane currentleads to the well-known relation1
a2V
ax2'
(27)
wherei is themembranecurrentperunitlength, r1 andr2arethe externaland internalresistancesperunit
length,
andxisdistance alongthefibre. Foran axonsurrounded bya largevolume ofconductingfluid, r,
i8 negligible com- pared withr2. Hence 1 a Vr2
ax2
or =2Ra
Va
(28)whereIis the membranecurrentdensity,aisthe radius ofthe fibre andR2is the specific resistance of the
axoplasm. Inserting
this relation in eqn. (26), we haveaa2V av 4V-
2R2 ax2
=CMat+SEn4
(V-VK)
+gNam3h(V-VNa)
+gl (V-VI),
(29)thesubsidiaryequations being unchanged.
Equation (29) isa partialdifferential equation, andit is notpracticable to solve it as it stands. During steady propagation, however, the curve of V against timeatanyonepositionissimilar inshapetothat ofVagainst distance atany onetime, andit follows that
a2v 1 a2v ax2= 2 at2)
where 0 is thevelocityof conduction. Hence
a d2V dV
2R202 dt2 CM
dt +Kn4 (V-VK)+gNm3kh(V-VNa)+g9(V-V).
(30) Thisisanordinary differential equation andcanbesolvednumerically,
but theprocedureisstillcomplicated by the factthat0isnotknown inadvance.It is necessary toguess a value of0, insert it in eqn. (30) and carry out the numerical solution starting from the resting state at the foot of the action potential. It is then found that V goes off towards either + oo or-oo, according as the guessed 0was too small or too large. A new value of0is