Research Collection
Conference Paper
Impact of reservoir heterogeneity on fluid injection-induced fault slip: insights from numerical simulation
Author(s):
Wang, Zineng; Huang, Xin; Huang, Zhaoqin; Wang, Xiaoguang; Lei, Qinghua Publication Date:
2020-11-11 Permanent Link:
https://doi.org/10.3929/ethz-b-000454796
Originally published in:
IOP Conference Series: Earth and Environmental Science 570, http://
doi.org/10.1088/1755-1315/570/2/022043
Rights / License:
Creative Commons Attribution 3.0 Unported
This page was generated automatically upon download from the ETH Zurich Research Collection. For more information please consult the Terms of use.
Content from this work may be used under the terms of theCreative Commons Attribution 3.0 licence. Any further distribution of this work must maintain attribution to the author(s) and the title of the work, journal citation and DOI.
Published under licence by IOP Publishing Ltd
China Rock 2020
IOP Conf. Series: Earth and Environmental Science 570 (2020) 022043
IOP Publishing doi:10.1088/1755-1315/570/2/022043
1
Impact of reservoir heterogeneity on fluid injection-induced fault slip: insights from numerical simulation
Zineng Wang1, Xin Huang1, Zhaoqin Huang2, Xiaoguang Wang3, Qinghua Lei4
1 Department of Geotechnical Engineering, College of Civil Engineering,Tongji University, Shanghai, China
2 Research Centre of Multiphase Flow in Porous Media, China University of Petroleum (East China), Qingdao, China
3 Laboratoire HydroSciences Montpellier, CNRS-UM-IRD, Montpellier, France
4 Chair of Engineering Geology, Department of Earth Sciences, ETH Zürich, Zürich, Switzerland
*Corresponding author:qinghua.lei@erdw.ethz.ch
Abstract. In order to meet the growing energy demand worldwide, the technology of hydraulic fracturing for shale gas extraction has been rapidly developed and applied in recent years.
However, man-made fluid injection has also caused several problems of high societal concern such as induced earthquakes. The focus of this paper is on the process of induced fault activation in shale reservoirs caused by hydraulic stimulation activities. We constructed a two- dimensional numerical model representing the horizontal cross-section of a faulted reservoir and simulated important coupled hydro-mechanical processes during fluid injection. We parameterized our model with the site investigation data of an actual shale gas project including in-situ stress, rock properties and injection protocol, etc. We represented the natural fault zone as a geological composite involving a fault core and a damage zone consisting of a set of subsidiary fractures parallel to the fault strike. We coupled the solid deformation and fault displacement with Darcy-type fluid flow based on poroelasticity principles and hydro-mechanical constitutive relationships. The heterogeneous nature of the permeability of the shale formation is mimicked by a random field model governed by a log-normal probability density function and directional correlation lengths, such that we can explore the impact of reservoir heterogeneity on the fault slip behaviour. In addition, we also studied the effects of fault length, dip angle and injection point-to-fault distance on the fault slip. Specifically, we analysed the link between fault slip and fluid flow field, permitting the capture of fluid movement in the heterogeneous faulted reservoir, the temporal and spatial evolution of preferential flow channels and their consequences on induced fault slip. The results of this research have important implications for understanding the triggering processes and mechanisms of fault slip during shale gas exploitation as well as many other injection- related engineering activities.
China Rock 2020
IOP Conf. Series: Earth and Environmental Science 570 (2020) 022043
IOP Publishing doi:10.1088/1755-1315/570/2/022043
1. Introduction
The development of effective reservoir injection technologies has recently become the focus of many geoengineering disciplines, including petroleum recovery, shale gas production and carbon sequestration[1]. Among these applications, the technology of hydraulic fracturing for shale gas production has been rapidly developed in order to meet the growing energy demand[2]. As an environmentally-friendly type of energy resources, shale gas has been explored and exploited worldwide in the recent years. However, the injection of large-volume water into subsurface has also raised many societal concerns regarding induced earthquakes of large magnitudes that can be felt on the ground surface by the public. In addition, such a fault movement induced by fluid injection may also cause casing deformation and even failure, jeopardising the safety and performance of well production systems
[4]. Thus, it is critically important to predict, control and mitigate the risk of induced fault slip and associated seismicity during hydraulic fracturing [3]. In the past few years, extensive studies have been developed to investigate the relationship between fluid injection, fault reactivation and seismicity.
McClure and Horne[7] developed a single fracture model and studied the effect of injection pressure on the induced seismicity. The result suggested that with a lower injection pressure, the maximum magnitude of the seismicity can be reduced. Rutqvist et al. [8] presented a 2-D numerical model to simulate the potential consequences of fault reactivation during shale gas hydraulic fracturing operations.
Then, a 3-D model was also developed by Rutqvist et al.[9] in 2015. In the two studies, fault reactivation caused by fluid injection may lead to seismicity with moment magnitudes up to 2.0. The research also showed that the fracturing process may give rise to limited fault displacement and (unfelt) microseismicity. Farmahini-Farahani and Ghassemi[10] found that the magnitudes of fluid pressure and injection rate will influence the nucleation of microseismicity, and permanent slip can be produced by increased injection pressure.
Although significant efforts have been devoted to studying the induced fault slip and seismicity, it is still not clear how the injected fluid migrates in the subsurface; the injection point is sometimes quite far away from the seismogenic fault, but is still able to trigger the fault to slip. It is known in the hydrogeology literature that crustal formations are usually highly heterogeneous accommodating channelized fluid flow [13]. We thus expect that the flow field of injected fluid in the subsurface is also associated with some spatially heterogeneous manner, which will strongly affect the triggering process of fault reactivation. However, the correlation between fault slip and reservoir heterogeneity is still poorly understood in the literature.
In this paper, we develop a coupled hydro-mechanical model in the context of the finite element method to analyse how reservoir heterogeneity affects the flow pathways of injected fluids and fault slip behaviour. The remainder of the paper is organised as follows. Section 2 describes the numerical approaches for hydro-mechanical simulation and reservoir heterogeneity representation. Section 3 shows the model setup and boundary conditions for numerical simulations. Section 4 presents the simulation results and detailed analysis. Finally, in section 5, a discussion is given and conclusions are drawn.
2. Numerical methods
2.1. Geomechanics model
The mechanical equilibrium of a faulted porous rock is governed by:
ij,j fi 0
+ = , (1)
where σij is the stress and fi is the body force. And the stress-strain relation of intact rocks follows the linear poroelasticity law:
( )( )
ij ij ij kk ij ij
1 1 2 1
E E
p
= − = +
+ − + , (2)
whereij is the effective stress, εij is the strain, E is the Young’s modulus, ν is the Poisson’s ratio, α is the Biot’s coefficient, p is the fluid pressure and δij is the Kronecker delta. We denote compressive stress and strain to be positive, and tensile stress and strain to be negative.
China Rock 2020
IOP Conf. Series: Earth and Environmental Science 570 (2020) 022043
IOP Publishing doi:10.1088/1755-1315/570/2/022043
3
We conceptualise a fault with a thickness of w as a zone including a series of parallel fractures along the strike direction at a spacing of s. The normal stress-normal displacement relationship of the fault is given by:
n n
n n n
0, 0
, 0
V
K V V
= , (3)
where σ’n is the effective normal compressive stress, Kn is the fault normal stiffness and Vn is the fault normal closure. The shear stress-shear displacement of the fault is governed by Coulomb’s law of friction:
s s n s n f
s
, 0 and tan
0, else
K U U
=
, (4)
where τs is the fault shear stress, Us is the fault shear displacement, Ks is the fault shear stiffness and ϕf
is the friction angle.
The normal deformation of each fracture within the fault zone under compression is based on a hyperbolic relation:
n m n
n0 m n
v v
k v
=
+ , (5)
where vn is the fracture normal closure, kn0 is the fracture initial normal stiffness, and vm is the maximum allowable closure of the fracture. Thus, the normal stiffness of the fracture also exhibits a nonlinear behaviour:
(
n n0 m)
2n 2
n0 m
k k v
k v
+
= , (6)
which is related to the fault normal stiffness as Kn = kn/(w/s). The dilational displacement vs of the fracture is related to the shear displacement as:
s tan i s
v u
= − , (7)
where us is the fracture shear displacement given as us = Us/(w/s), and ϕi is the dilation angle. The fracture aperture is thus derived as:
n
0 n
0 n s n
, 0
/
, 0
b V
b w s
b v v
−
=
− −
, (8)
where b0 is the fracture initial aperture ,w is the width of the fault and s is the interval between each fracture.
For the permeability of the fault zone, we consider its intrinsic anisotropic feature. The permeability of the fault along the strike direction is given as:
3
|| 12
b
= s, (9)
while the permeability perpendicular to the fault strike is given as:
⊥=core, (10)
where κcore is the permeability of the fault core.
2.2. Fluid flow model
Single-phase steady-state fluid flow in fractured porous media is governed by the following mass balance equation :
d ( p ) ( ) m bd vol
u Q
dt dt
+ = − , (11)
where εp is the porosity, ρ is the fluid density,u is the velocity field, Qm is the change of the flow mass, αb is the permeability-porosity parameter and εvol is the volumetric strain,. The momentum equation obeys the Darcy’s law as:
China Rock 2020
IOP Conf. Series: Earth and Environmental Science 570 (2020) 022043
IOP Publishing doi:10.1088/1755-1315/570/2/022043
P
= −
u , (12)
where p is the fluid pressure, µ is the dynamic fluid viscosity, and κ is the local permeability. For the correlation between fluid flow and solid changes in elastic porous media, we couple the solid deformation and fault displacement with Darcy-type fluid flow based on poroelasticity principles and hydro-mechanical constitutive relationships.
2.3. Random field model
In order to represent the reservoir heterogeneity, we used a random field generator to mimic the permeability distribution in subsurface reservoirs. Note that the heterogeneity here aims to reflect the effects of small-scale structures such as fractures, whereas the large-scale fault is explicitly represented as described in subsection 2.1-2.2.
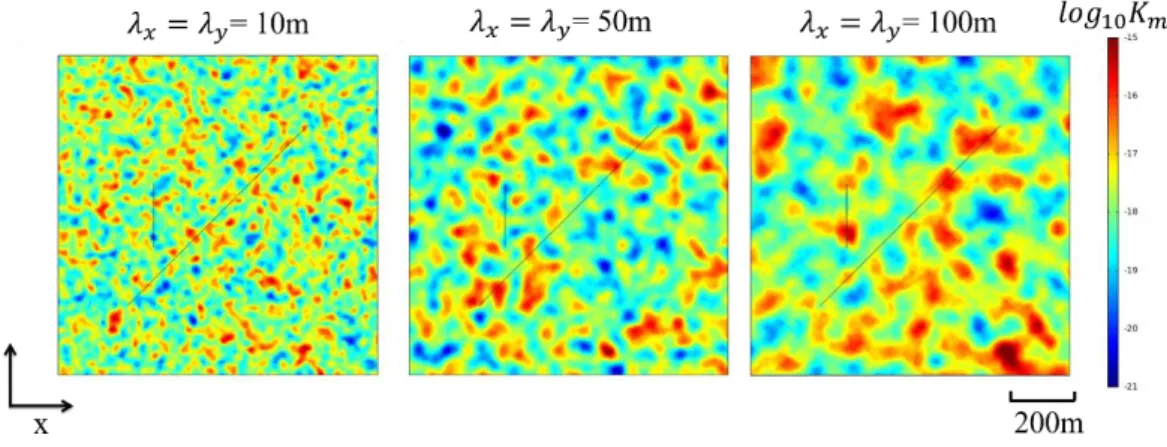
In the random field model, the permeability distribution are characterized by three key parameters, the meanx, standard deviation σ and correlation length λ. The mean and standard deviation determine the magnitude and variability of permeability values. The larger the mean is, the higher the overall permeability is; the larger the variance is, the larger the difference between the maximum and minimum values is. The parameter of correlation length characterizes the spatial variation of permeability. We may define independent correlation lengths for the x and y direction for the 2-D problem. The smaller the correlation length is, the higher the frequency of permeability fluctuation in that direction is, i.e. the distance from a high permeability zone to a low permeability zone is smaller.
3. Model setup
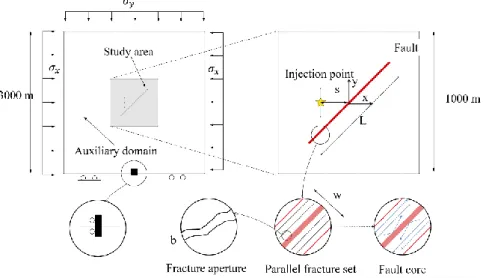
In this study, we create a 2-D reservoir model with a square domain size of 1 km by 1 km. In order to reduce the boundary effect, the study area is embedded in a larger auxiliary domain with size of 3 km by 3 km. We discretise the domain using an unstructured grid of triangular elements with a refined size of approximately 2 m in the study area; the element size is progressively increased away from the boundary of the study area in the auxiliary domain.
Figure 1. Schematic of the numerical model setup showing the boundary conditions, model components and their physical representations.
We define the in-situ stress (σx=90 MPa,σy=105 MPa) and water pressure (pinj=70 MPa) conditions according to the actual field data. The bottom of the model is constrained by a roller condition, while the in-situ stresses are imposed orthogonally to the rest of the boundaries. The specific model configuration and boundary conditions are shown in Figure 1.
China Rock 2020
IOP Conf. Series: Earth and Environmental Science 570 (2020) 022043
IOP Publishing doi:10.1088/1755-1315/570/2/022043
5
The numerical model includes three key components (Figure 1): (i) a natural fault, (ii) a hydraulic fracture, and (iii) the heterogeneous host rock. We define a Cartesian coordinate system with the origin at the centre of the domain.
The assumed properties of the natural fault are given in Table 1, the length of the fault was presented as 800 m. Based on the typical relation between the fault length and fault stiffness [15] in the literature, we assumed the corresponding stiffness value (Kn=0.5 GPa/m, Ks=0.25 GPa/m) for the fault. The middle point of fault was placed at the domain centre and we assumed the fault is inclined at 45º with respect the positive x direction.
We used the x coordinate of the injection point to indicate the distance between the injection point and the fault. Four different cases, i.e. x=0 m, x=-150 m, x=-300 m, and x=-450 m, are explored in this research. When x=0 m, it means that the natural fault gets across with the hydraulic fracture. With the decrease of x, the injection point is placed farther away from the fault.
By analysing the permeability measurements from the given actual reservoir, we found that the permeability obeys a lognormal distribution with a mean of 1.76 and a standard deviation of 6.35. We then explored different values of the correlation length, i.e. 10 m, 50 m, and 100 m (the correlation lengths in the x and y directions are assumed equal). The generated spatially correlated, random permeability field is as shown in Figure 2.
Figure 2. Generated random fields of reservoir permeability with different correlation lengths.
China Rock 2020
IOP Conf. Series: Earth and Environmental Science 570 (2020) 022043
IOP Publishing doi:10.1088/1755-1315/570/2/022043
Figure 3. Model setup for geomechanical and fluid flow simulation.
We run the simulation in two stages. In the first stage, the system reached the initial equilibrium under the in-situ stress and pore fluid pressure condition. In the second stage, we increased the water pressure at the injection point to the designed level and also progressively lengthened the hydraulic fracture with the pressure imposed on it. The maximum length of the hydraulic fracture is 200 m and the whole time lasted for 5 h.
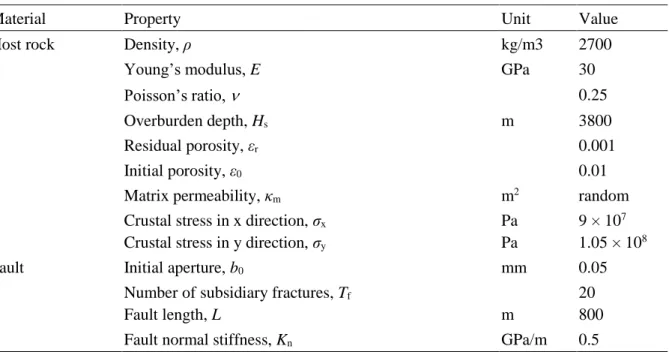
Table 1. Material properties of the fractured rocks
Material Property Unit Value
Host rock Density, ρ kg/m3 2700
Young’s modulus, E GPa 30
Poisson’s ratio, 0.25
Overburden depth, Hs m 3800
Residual porosity, εr 0.001
Initial porosity, ε0 0.01
Matrix permeability, κm m2 random
Crustal stress in x direction, σx
Crustal stress in y direction, σy
Pa Pa
9 × 10⁷ 1.05 × 10⁸
Fault Initial aperture, b0 mm 0.05
Number of subsidiary fractures, Tf
Fault length, L m
20 800
Fault normal stiffness, Kn GPa/m 0.5
China Rock 2020
IOP Conf. Series: Earth and Environmental Science 570 (2020) 022043
IOP Publishing doi:10.1088/1755-1315/570/2/022043
7
Fault shear stiffness, Ks GPa/m 0.25
Fracture initial normal stiffness, kn0
Fracture initial shear stiffness, ks0
GPa/m GPa/m
10 5
Fault core permeability, κcore m2 1 × 10-20
4. Results
We first analysed the effects of the position of fluid injection and the correlation length of reservoir permeability field on the fault reactivation behaviour. As shown in Figure 4, we present the change of fluid pressure in the reservoir for two cases, i.e. λx=λy=10m, λx=λy=100m. As the time proceeds, the fluid pressure continues to diffuse from the injection point into the fault zone and reservoir rock.
If x=0m, the injected fluid quickly migrates into the fault zone and flows along the fault. For the cases of x=-150m, x=-300m and x=-450m, it is much harder for the fluid to enter the fault. In these
scenarios, it is found that the fluid flow is mainly controlled by the local permeability field around the hydraulic fracture. To analyse the effect of correlation length, we compare the two cases of λx=λy=10m and λx=λy=100m. When the correlation length is small, the diffusion of water pressure appears to be more localised.
(a) (b)
China Rock 2020
IOP Conf. Series: Earth and Environmental Science 570 (2020) 022043
IOP Publishing doi:10.1088/1755-1315/570/2/022043 Figure 4. The change of fluid pressure with correlation length (a) λx=λy=10m (b) λx=λy=100m.
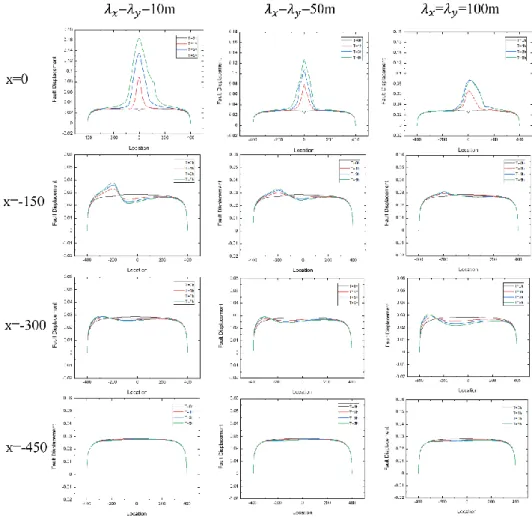
Figure 5. Displacement of the fault with different injection positions and correlation lengths.
In Figure 5, we show the displacement along the fault and the change of the displacement on the fault over time. We selected four different times, i.e. t = 0 h, t = 1 h, t = 3 h and t = 5 h, and plot the distribution of fault displacement for these time instants. The black curve represents the initial fault displacement value before the fluid injection; the green curve represents the final displacement value of the fault after the injection.
With the change of simulation time, the fault displacement value shows an increasing trend. If the injection position x=0m, the incremental value of the fault displacement reached a value of around 0.1m.
It is due to the fact that the injected fluid was able to migrate into the fault zone, resulting in the reduction of the effective stress and shear resistance and therefore the fault reactivation. The final displacement value of the fault shows a significant negative correlation with the injection-to-fault distance, generally showing that the farther the injection point is away from the fault, the smaller the value of the induced fault slip. However, we also found that not all the cases conform to this general trend.
China Rock 2020
IOP Conf. Series: Earth and Environmental Science 570 (2020) 022043
IOP Publishing doi:10.1088/1755-1315/570/2/022043
9
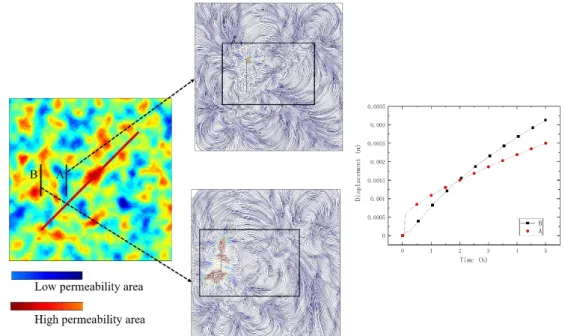
Figure 6. Two different injection points in a random permeability field and its flow lines and displacement with time.
As shown in Figure 6, comparing the two different water injection points A and B, although the location of B is relatively far from the fault, in the random permeability field, point B is just right in a high permeability area, while point A is in a low permeability area. Considering from the flow lines, it is also obvious that the flow of a streamline along the high permeability area can affect the fault displacement value more effectively. From the perspective of the overall principle, the fault displacement does have a negative correlation with the relative distance, but the flow channeling formed by the high-permeability area may still affect the fault behaviour at a location far away from the fault.
5. Conclusion
In this paper, we analysed the impact of reservoir permeability and injection location on the fault slip.
We observe that the farther the distance between the hydraulic fracture and the natural fault zone is, the smaller the induced fault slip will be. However, if the reservoir is strongly heterogeneous and if the injection point is located in a high permeability zone linked to the fault, despite its large distance from the fault, significant fault slip can still be triggered.
Acknowledgement
This research was funded by Sinopec and the National Natural Science Foundation of China (No.
41672262).
References
[1] Rutqvist J and Stephansson O 2003 The role of hydrochemical coupling in fractured rock engineering Hydrogeol. J. 11 7–40
[2] Rutqvist J, Rinaldi A P, Cappa F and Moridis G J 2015 Modeling of fault activation and seismicity by injection directly into a fault zone associated with hydraulic fracturing of shale-gas reservoirs J. Pet. Sci. Eng. 127 377–86
[3] Holland A 2011 Examination of Possibly Induced Seismicity from Hydraulic Fracturing in the Eola Field, Garvin County, Oklahoma Oklahoma Geol. Surv. Open-File 1–31
[4] Bao X and Eaton D W 2016 Fault activation by hydraulic fracturing in western Canada Science (80-. ). 354 1406–9
China Rock 2020
IOP Conf. Series: Earth and Environmental Science 570 (2020) 022043
IOP Publishing doi:10.1088/1755-1315/570/2/022043 [5] Rinaldi A P, Rutqvist J and Cappa F 2014 Geomechanical effects on CO2 leakage through fault
zones during large-scale underground injection Int. J. Greenh. Gas Control 20 117–31 [6] Konstantinovskaya E, Rutqvist J and Malo M 2014 CO2 storage and potential fault instability in
the St. Lawrence Lowlands sedimentary basin (Quebec, Canada): Insights from coupled reservoir-geomechanical modeling Int. J. Greenh. Gas Control 22 88–110
[7] McClure M W and Horne R N 2011 Investigation of injection-induced seismicity using a coupled fluid flow and rate/state friction model Geophysics 76
[8] Rutqvist J, Rinaldi A P, Cappa F and Moridis G J 2013 Modeling of fault reactivation and induced seismicity during hydraulic fracturing of shale-gas reservoirs J. Pet. Sci. Eng. 107 31–44 [9] Rutqvist J, Rinaldi A P, Cappa F and Moridis G J 2015 Modeling of fault activation and seismicity
by injection directly into a fault zone associated with hydraulic fracturing of shale-gas reservoirs J. Pet. Sci. Eng. 127 377–86
[10] Farmahini-Farahani M and Ghassemi A 2016 Simulation of micro-seismicity in response to injection/production in large-scale fracture networks using the fast multipole displacement discontinuity method (FMDDM) Eng. Anal. Bound. Elem. 71 179–89
[11] Tsang C F and Neretniek I 1998 Flow rocks in heterogeneous study transport Reviews of Geophysic 36 275–98
[12] Tsang Y W and Tsang C F 1989 Flow channeling in a single fracture as a two‐dimensional strongly heterogeneous permeable medium Water Resour. Res. 25 2076–80
[13] De Dreuzy J R, Méheust Y and Pichot G 2012 Influence of fracture scale heterogeneity on the flow properties of three-dimensional discrete fracture networks (DFN) J. Geophys. Res. B Solid Earth 117 1–21
[14] Neretnieks I 1993 Applications To Radionuclide Waste Flow Contam. Transp. Fract. Rock 39–
127
[15] Bandis S C, Lumsden A C and Barton N R 1983 Fundamentals of rock joint deformation Int. J.
Rock Mech. Min. Sci. 20 249–68