Supplemental Information for:
Gene expression remodelling and immune response during adaptive divergence in an African cichlid fish
Jelena Rajkov, Athimed El Taher, Astrid Böhne, Walter Salzburger, Bernd Egger
Table of Contents:
Figure S1 Page 2
Figure S2 Page 3
Figure S3 Page 4
Figure S4 Page 5
Figure S5 Page 6
Figure S5 (continued) Page 7
Figure S6 Page 8
Figure S7 Page 9
Figure S8 Page 10
Table S1 Page 11
Table S2 Page 12
Table S3 Page 13
Table S4 Page 14
Table S5 Page 15
Titles of tables S6-S12 in Excel file Page 16
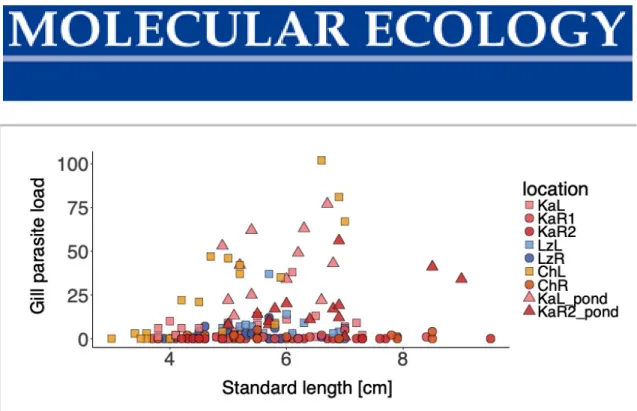
Figure S1 Gill parasite load versus fish standard length. Colours represent populations;
squares – lake, circles – river, triangles – pond. Colour code according to Figure 1: KaL – Kalambo lake, KaR1 – Kalambo river, KaR2 – Kalambo river upstream, ChL – Chitili lake, ChR – Chitili river, LzL – Lunzua lake, LzR – Lunzua river.
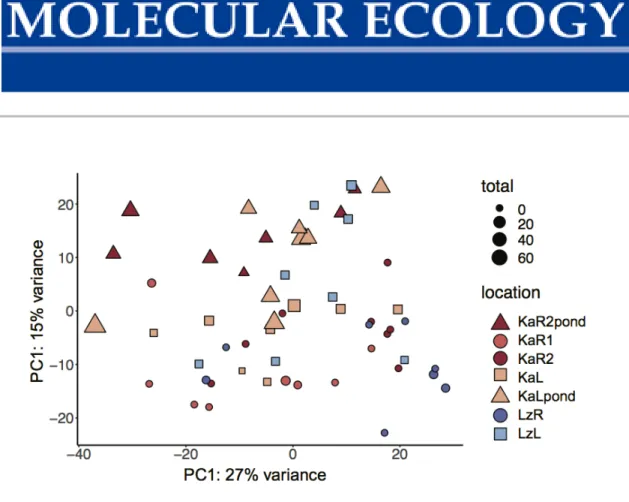
Figure S2 Global patterns of gene expression differences among samples. PCA plot of gene expression levels in spleen samples. Colours represent populations; squares – lake populations, circles – river populations, triangles – ponds, with symbol size representing total parasite load per specimen. Colour code according to Figure 1: KaL – Kalambo lake, KaR1 – Kalambo river, KaR2 – Kalambo river upstream, , LzL – Lunzua lake, LzR – Lunzua river.
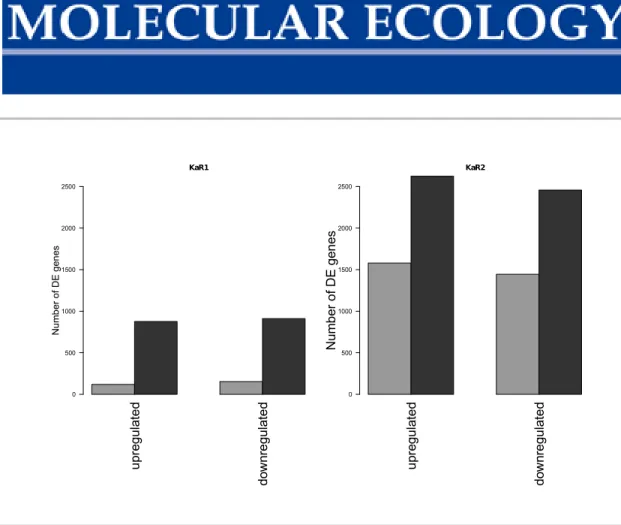
upregulated downregulated
KaR1
Number of DE genes
0 500 1000 1500 2000 2500
upregulated downregulated
KaR2
Number of DE genes
0 500 1000 1500 2000 2500
Figure S3 Lake-river differential expression. (a) Barplot of the number of genes up- regulated and down-regulated in the lake - river contrast (KaL, LzL and KaR1, LzR population) in the two different organs (dark grey: gills, light grey: spleen). (b) Barplot of the number of genes up-regulated and down-regulated in the lake - river contrast (KaL, LzL and KaR2, LzR population) in the two different organs (dark grey: gills, light grey: spleen).
gills_lake spleen_lake gills_river spleen_river
Number of DE genes
0 2 4 6 8 10 12
Monogenea_gills Monogenea_spleen Copepoda_gills Copepoda_spleen Nematoda_gills Nematoda_speen Acanthocephala_gills Acanthocephala_spleen
Number of DE genes
0 10 20 30 40
Figure S4 (a) Barplot of the number of genes differentially expressed between Monogenea infected and Monogenea non-infected fishes for two different habitats (lake and river) and two different tissues (gills and spleen). (b) Barplot of the number of genes differentially expressed between infected and non-infected lake fishes for four different types of parasites (Monogenea, Copepoda, Nematoda and Acantocephala) and two different tissues (gills and spleen).
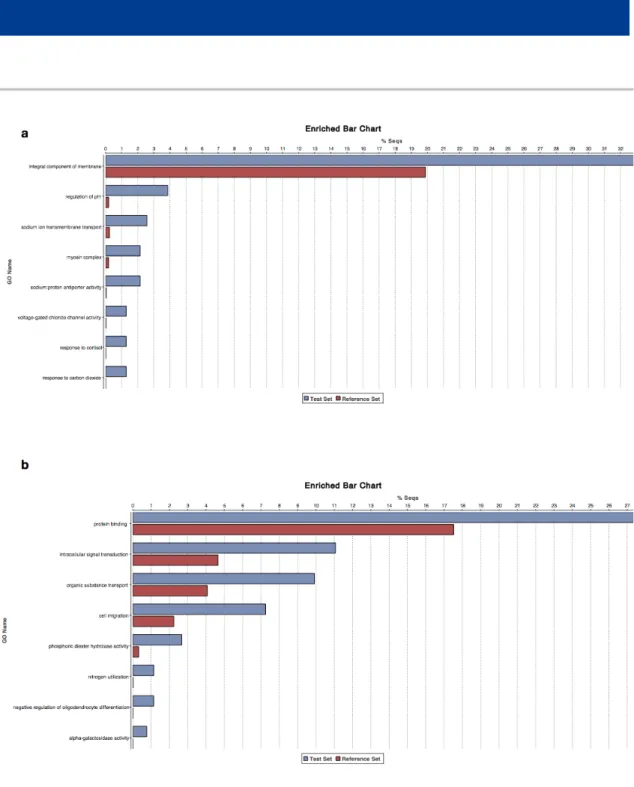
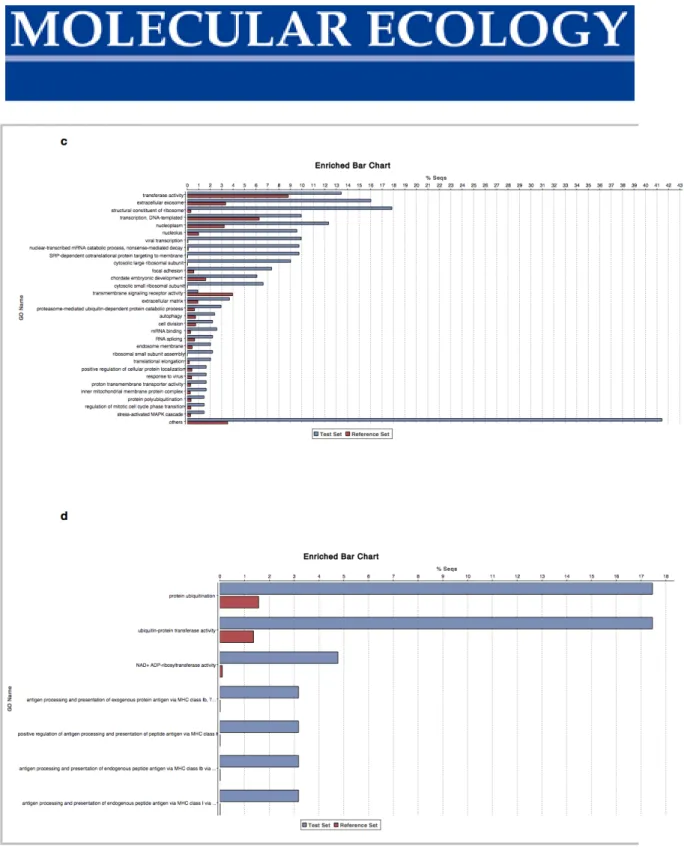
Figure S5 Gene enrichment plots for co-expression networks from gill (greenyellow (a) and magenta (b) modules) and spleen (red (c) and darkturquoise (d) modules) expression profiles.
Figure S5 (continued) Gene enrichment plots for co-expression networks from gill (greenyellow (a) and magenta (b) modules) and spleen (red (c) and darkturquoise (d) modules) expression profiles.
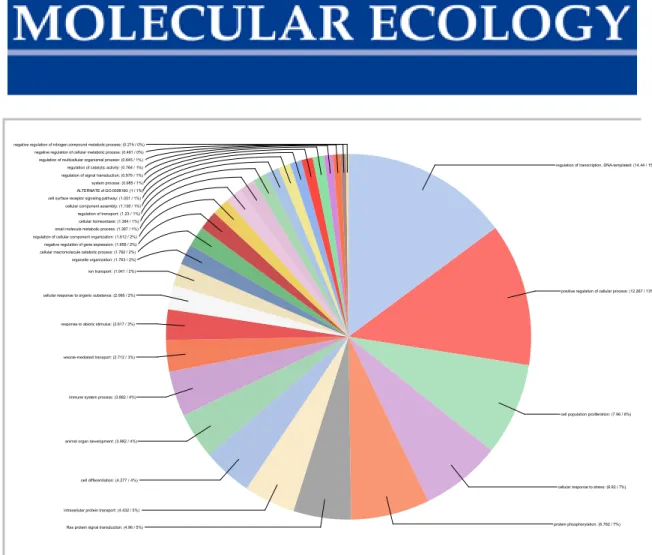
negative regulation of nitrogen compound metabolic process: (0.215 / 0%) negative regulation of cellular metabolic process: (0.461 / 0%) regulation of multicellular organismal process: (0.645 / 1%) regulation of catalytic activity: (0.764 / 1%) regulation of signal transduction: (0.979 / 1%) system process: (0.985 / 1%) ALTERNATE of GO:0008150: (1 / 1%) cell surface receptor signaling pathway: (1.051 / 1%) cellular component assembly: (1.138 / 1%) regulation of transport: (1.23 / 1%) cellular homeostasis: (1.384 / 1%) small molecule metabolic process: (1.397 / 1%) regulation of cellular component organization: (1.512 / 2%) negative regulation of gene expression: (1.656 / 2%) cellular macromolecule catabolic process: (1.762 / 2%) organelle organization: (1.763 / 2%) ion transport: (1.941 / 2%)
cellular response to organic substance: (2.065 / 2%)
response to abiotic stimulus: (2.617 / 3%)
vesicle-mediated transport: (2.712 / 3%)
immune system process: (3.882 / 4%)
animal organ development: (3.982 / 4%)
cell differentiation: (4.277 / 4%)
intracellular protein transport: (4.432 / 5%)
Ras protein signal transduction: (4.96 / 5%)
regulation of transcription, DNA-templated: (14.44 / 15%)
positive regulation of cellular process: (12.267 / 13%)
cell population proliferation: (7.96 / 8%)
cellular response to stress: (6.92 / 7%)
protein phosphorylation: (6.762 / 7%)
Figure S6 Pie chart of the GO term associated with the genes with significant habitat-specific SNPs (Table S8).
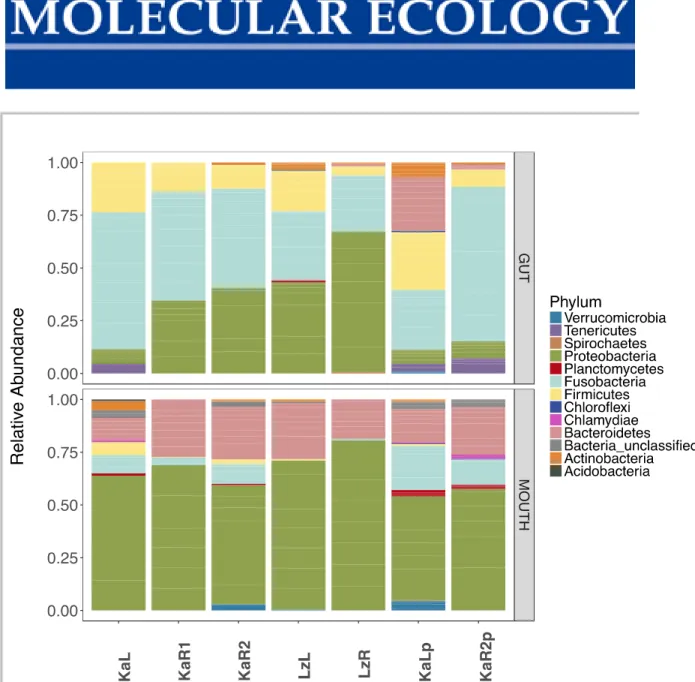
Figure S7 Relative abundance of different microbiota phyla per population given after filtering out low abundance sequences (≤ 0.02). KaL – Kalambo lake, KaR1 – Kalambo river, KaR2 – Kalambo river upstream, LzL – Lunzua lake, LzR – Lunzua river, KaLp – Kalambo lake ponds, KaR2p – Kalambo river upstream ponds.
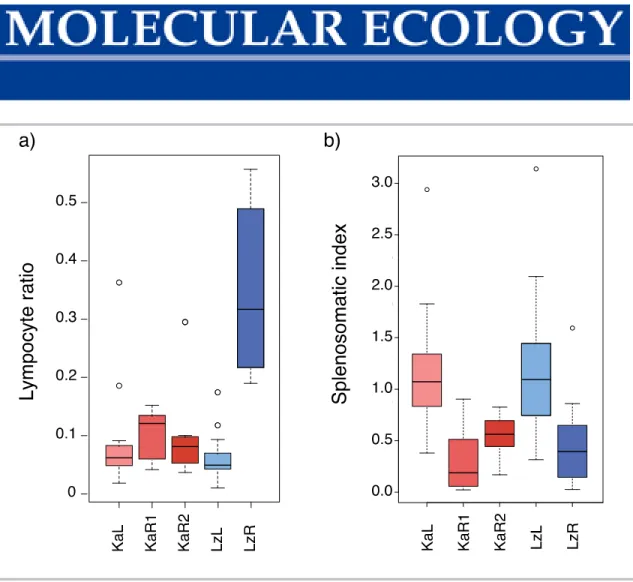
Figure S8 Comparison of adaptive and innate immune response in wild lake and river A. burtoni populations. Proportion of cells of the adaptive immune system estimated as lymphocyte ratio in the blood (lymphocyte count/(lymphocyte + monocyte counts)) as found in Theis et al. (2017) (a) and splenosomatic index as an estimate of the innate immune response in the same populations in this study (b): KaL – Kalambo lake, KaR1 – Kalambo river, KaR2 – Kalambo river upstream, LzL – Lunzua lake, LzR – Lunzua river.
Table S1 Primer sequences for the second PCR for 16S Metagenomic Sequencing Library Preparation.
Table S2 Analyses of variance table and results of Tukey-Kramer post hoc pairwise comparisons of means of a zero-inflated Poisson generalized linear model on parasite taxa number for all the wild populations. SL – standard length. Significant effects (p <
0.05) are highlighted.
Table S3 Analyses of variance table and results of Tukey-Kramer post hoc pairwise comparisons of means of a zero-inflated negative binomial generalized linear model on total parasite load. SL – standard length. Significant effects (p < 0.05) are highlighted.
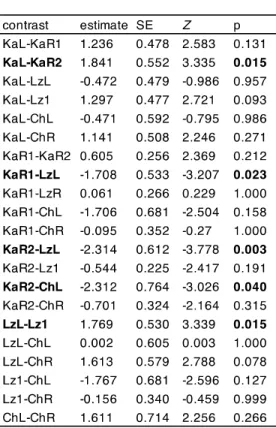
Table S4 Analyses of variance tables and results of Tukey-Kramer post hoc pairwise comparisons of means of a zero-inflated negative binomial generalized linear models of gill parasite load for all the wild populations (model 1) and for Kalambo river system comparison between the wild and pond setup (model 2). SL – standard length.
Significant effects (p < 0.05) are highlighted. Sex: f – females, m-males, ? – juveniles.
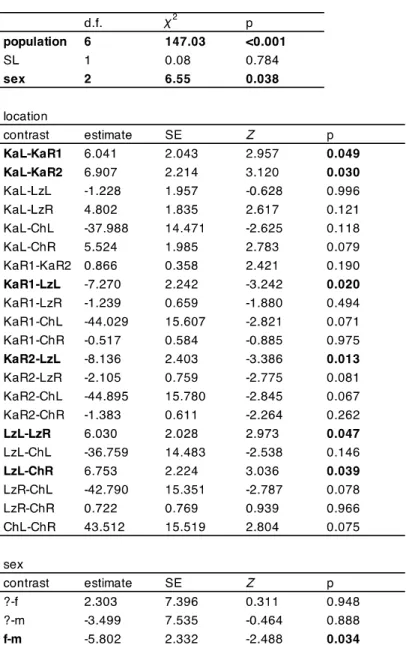
Table S5 Analyses of variance tables and results of Tukey-Kramer post hoc pairwise comparisons of means of linear models on splenosomatic index for all the wild populations (model 1) and Kalambo river system comparison between the wild and pond setup (model 2). TPL – total parasite load, SL – standard length. Significant effects (p < 0.05) are highlighted in bold.
Tables in the Excel file
Table S6 Genes differentially expressed between lake and river samples in the gills (a) and in the spleen (b).
Table S7 Genes differentially expressed between Monogenea infected and Monogenea non- infected fish in two habits (river and live) and two tissues (gills and spleen).
Table S8 Genes differentially expressed between infected and non-infected lake fish for four different group of parasites in the gills and in the spleen.
Table S9 WGCNA gene module memberships in the gills (a) and in the spleen (b).
Table S10 Habitat-specific genetic variation identified between lake and river samples.
Table S11 Genetically assimilated genes. List of genes that are differentially expressed in lake- river condition, in the wild and in the pond.
Table S12 Plastic gene expression. List of genes that are differentially expressed in lake-river condition, in the wild but not in the pond.