Institut f¨ur Experimentelle Kernphysik (EKP) Prof. Dr. M. Feindt, Dr. M. Kreps, Dr. T. Kuhr C. Hackstein, D. Zander, Dr. A. Zupanc
3. December 2009
Computerpraktikum zur Vorlesung Teilchenphysik f¨ ur Fortgeschrittene
Reconstructing charm resonances from DELPHI data
compiled and written by
Zolt´an Albrecht, Gary Barker and Markus Moch
1 Introduction
This part of the Computer Praktikum is concerned with observing so-called ‘charm’ or D-mesons i.e. bound states of a charm(anti-charm) quark with another anti-quark(quark).
In our case the other quark will either be an ‘up’ quark or a ‘down’ quark. The data we will use has been taken by the DELPHI detector at the CERN Large Electron-Positron Collider (LEP), see Figure 1.
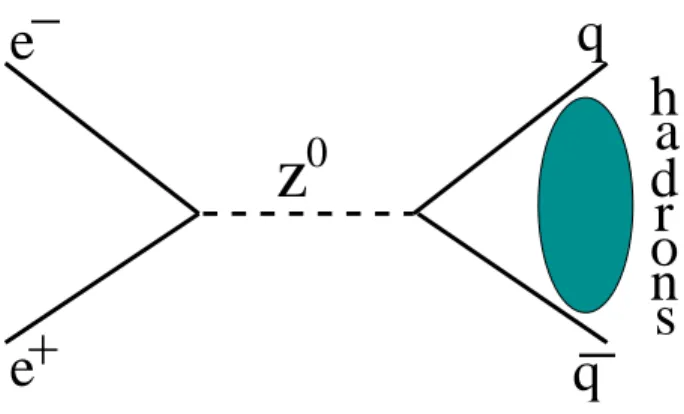
In the LEP ring, intense beams of electrons and positrons are accumulated, accelerated and finally made to collide in the region of each of the four detectors. For the data set we will use, the collision energy is finely tuned to be at the rest mass of the Z0 boson which subsequently decays into pairs of leptons (about 30% of the time) or pairs of quarks (about 70% of the time). It is the production of quark pairs that we are interested in here and the process is illustrated in Figure 2. The Z0 is produced at rest in the laboratory frame and decays to a quark-anti quark pair (q¯q) which fly apart back-to-back. As the qq¯pair separate, the magnitude of the strong force field between them increases until the stored energy becomes large enough to create new qq¯pairs in a process known as fragmentation or hadronisation. The result is that our original quark and anti-quark become bound up inside hadrons which, in turn, form part of a whole cluster or jet of other fragmentation hadrons that approximately follow the direction of the parent quark or anti-quark. It is
1 INTRODUCTION 2
POINT 4.
LAKE GENEVA GENEVA
CERN Prévessin
POINT 6.
POINT 8.
POINT 2.
CERN
SPS
ALEPH DELPHI
OPAL
L3
LEP e Electron -
e Positron +
R. Lewi jan. 1990
s
Abbildung 1: The LEP collider at CERN is 27km in circumference and about 100m un- derground. This picture illustrates the position of the four detectors; ALEPH, DELPHI, L3 and OPAL.
2 THE DELPHI EXPERIMENT 3
these jets of particles, or their decay products, that enter our detector and are measured.
2 The DELPHI Experiment
2.1 Overview
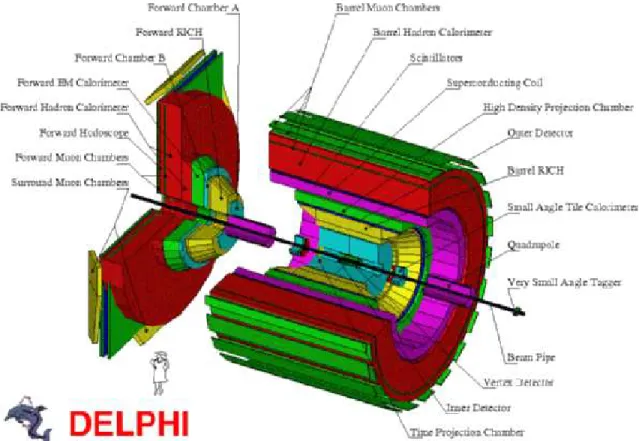
DELPHI (DEtector with Lepton, Photon and Hadron Identification) is shown in Figure 3.
It consists of a collection of sub-detectors arranged as concentric cylinders going to larger and larger radii away from the interaction region, rather like the layers of an onion. Each sub-detector is optimised to perform a certain task so that, taken as a whole, DELPHI is able to measure the trajectory and 4-vector as well as identify all particles that enter the detector (the exception to this are neutrinos that interact with matter so weakly they escape direct detection, but show themselves by the presence of missing energy in reconstructed events).
The electron and positron beams circulate in a high vacuum (10−12 Torr) inside a beryllium beam pipe that goes through the centre of DELPHI. Directly outside the beam pipe are the charged particle tracking devices. Closest to the interaction region is the Vertex Detector (VD) consisting of solid state silicon-strip devices providing high precision trajectory reconstruction of short lived particles. Outside of the VD are a series of less precise but large, gas ionisation tracking devices of which the largest is the Time Projection Chamber(TPC) which can track the passage of particles between a radius of about 40 cm and 110 cm. All tracking devices sit inside a 1.23 T magnetic field, provided by the Superconducting Solenoid, oriented along the z-axis. This is important in order to measure the momenta of tracks since the momentum in the plane transverse to the z axis is proportional to the measured radius of curvature of the track.
Surrounding the TPC is a Ring Imaging CHerenkov or RICH detector which iden- tifies the type of charged particle by reconstructing the Cherenkov light cone emitted when a relativistic charged particle passes through a dielectric medium. At still larger radii from the interaction region come the calorimetry devices for reconstructing particle energies. Electron and photon identification is provided by the High Density Projection Chamber(HPC) and the return yoke of the solenoid is instrumented with the Hadron Ca- lorimeter. The very outside layer of DELPHI are the Muon Chambers designed to track the passage of the very penetrating muons.
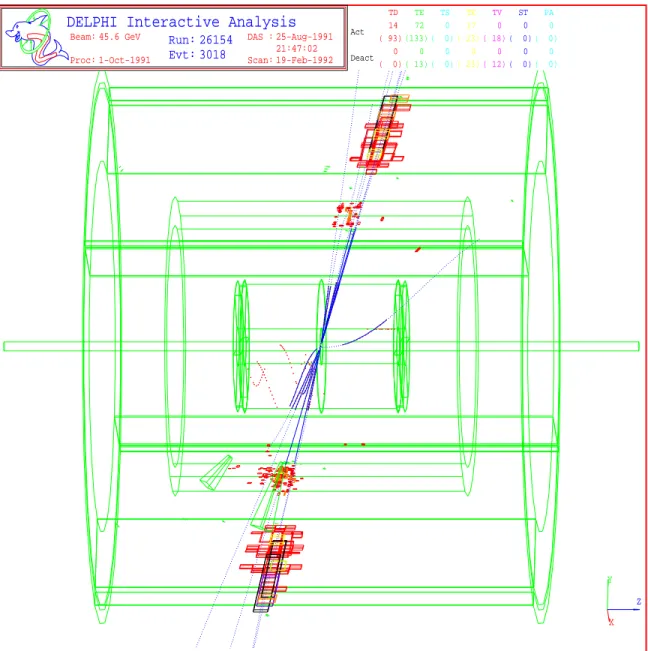
Although we have described here just the cylindrical or Barrel section of DELPHI, a similar scheme is also followed to instrument the forward regions in End-Caps that can also be seen in Figure 3. The response of the detector to a typical 2-jet event of the type described in Section 1 is shown in Figure 4. The lines represent reconstructed charged particle tracks and the boxes are calorimetry clusters, the size of which is proportional to the energy deposited by a particle at that point.
2 THE DELPHI EXPERIMENT 4
2.2 Charged Particle Tracking
The (x, y, z) coordinates or hits recorded by the various tracking detectors as a charged particle passes through the detector, are sorted bypattern recognitionalgorithms into sets likely to have originated from the passage of the same physical particle. The hits are then fitted to a helix function to give a track described by five free parameters referenced to the perigee point, that is the point of closest approach of the track to the origin of the coordinate system. The fitted parameters are:
• - the x,y distance to the perigee point in thex, y plane (carries a geometrical sign),
• z - the z coordinate of the track at the perigee point,
• θ - the polar angle of the track,
• φ - the azimuthal angle made by the tangent to the track at the perigee point,
• 1/r - the inverse of the radius of curvature of the track (signed by the charge of the particle).
The most precise tracking information and the most important sub-detector for the reconstruction of hadrons containing c and b−quarks, is the VD. There are three layers of silicon strip devices at radii of 6.3. 9.0 and 10.9 cm from the interaction point, giving an intrinsic spatial precision of around 8µm in both the x, y and z planes respectively.
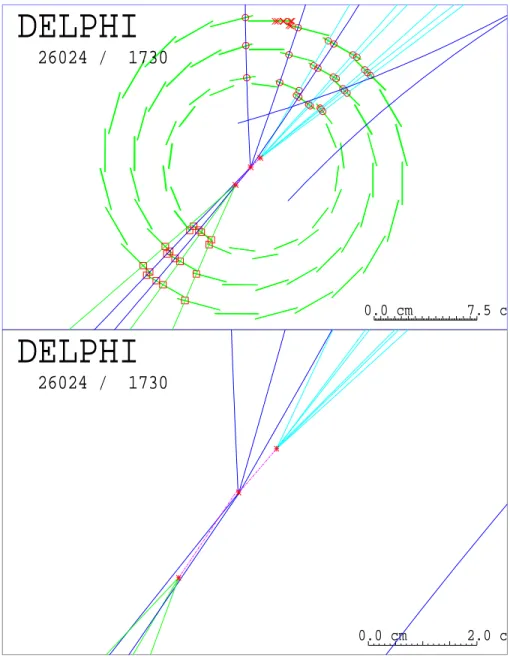
Figure 5 shows the reconstruction of aZ0 →b¯b event in the VD. Tracks fitted through the detector hits are shown and stars indicate the location of three separate vertices from which tracks originate. The lower picture is a blow-up of this central region. The reconstructed vertex in the middle corresponds to the e+e− interaction point or primary vertex, where the b and ¯b quark were produced. The tracks coming from this point are either particles produced in the fragmentation process or decay products of excited states that decay very fast by the strong or electromagnetic interaction. The remaining two secondary vertices correspond to the decay points of the two B hadrons, produced in the fragmentation process, and the tracks emanating from these points are the B hadron decay products.
2.3 Charged Particle Identification
Hadrons containing c and b quarks typically decay well before entering the DEL- PHI detector. It is only relatively stable decay products and fragmentation tracks (i.e.
e±, µ±, π±, K±, p) that live long enough to register signals in the detector and it is from these that we must try and reconstruct what process actually occurred in the event. In addition to accurately reconstructing the trajectory of particles through the detector, it is clearly important to be able to identify the type of particle we have detected.
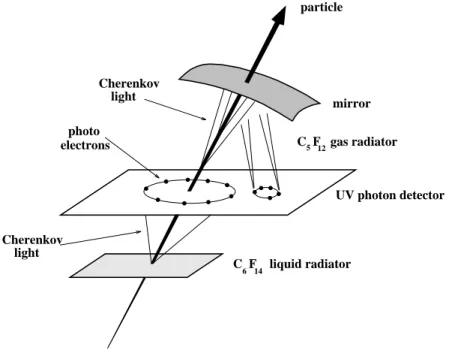
The RICH detectors in DELPHI play a central role in determining the identity of charged tracks. The technique used relies on the following dependence between the opening angle (θC) of the Cherenkov light cone emitted by a particle and the mass of the particle
3 D-MESON SPECTROSCOPY - THEORY 5
(M): cos(θC) = 1/n·p
1 +M2/p2 wheren is the refractive index of medium the particle traverses. A gas and a liquid medium are used in the DELPHI RICH’s in order to be sensitive to a large spread in particle momenta: the liquid is used for the range from 0.7 to 8 GeV/c and the gas is used from 2.5 to 25 GeV/c. The basic principle of light cone detection by the RICH is illustrated in Figure 6.
Another powerful tool for particle identification, in the low momentum region, comes from sampling the energy loss (dE/dx) as particles traverse the VD and TPC. This technique exploits the differences in the Bethe-Bloch energy loss formula for particles of different mass in the region below the minimum ionizing point. The performance of this method together with the RICH’s is shown in Figure 7. As we shall see in the next section, the separation of kaons from pions is particularly important for the identification of heavy quark hadron decays.
Various algorithms have been developed inside DELPHI, e.g. based on neural networks, to combine in an optimal way dE/dx and RICH information for a particle identification capability over the full momentum spectrum.
3 D-Meson Spectroscopy - Theory
D,( ¯D) mesons are two-quark states where one of the quarks is ac(¯c) e.g.D+ =cd, D¯ − =
¯
cd, D0 = c¯u,D¯0 = ¯cu. Quantum ChromoDynamics or QCD is thought to be the appro- priate theoretical framework in which to calculate the properties of such states. In practice however, the tool of perturbative expansion can often not be used and we must resort to the use of models. Fortunately, many aspects of meson states containing a heavy c or b quark can be understood to some approximation if we consider the heavy quark(anti- quark) to be de-coupled from the light anti-quark(quark) partner. The most extreme form of this is the so-called spectator model in which the heavy quark is considered to be completely independent of the light quark. Since the dynamics of the light quark are considered to have no influence on the heavy partner, this model works best when the difference in mass between the quark and anti-quark is as large as possible e.g. the spec- tator model is a better approximation to the B system and D system than it is to the K system. In the DELPHI e+e− → qq¯data set, D mesons can be produced whenever a c quark is present which is the case for e+e− → c¯c events and in e+e− → b¯b where the b quark has decayed weakly to a cquark. Charm quarks can in principle be produced in the fragmentation process, but due to their relatively high mass of 1.1 to 1.4 GeV /c2 the probability is negligibly small. The fraction of all e+e− →qq¯events that are c¯cis about 18%, about 22% are b¯b events with the remainder involving the lighteru, d, s quarks.
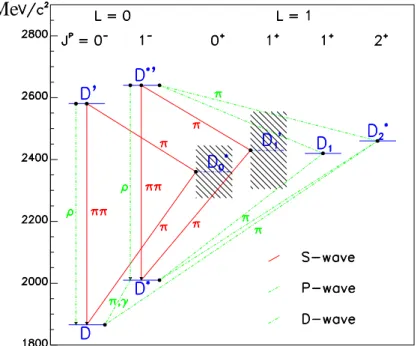
Figure 8 shows the expected spectroscopy of D-mesons containing a u or d quark where the vertical axis represents the rest mass and the states are horizontally separated by their total spin (J =S(intrinsic spin)+L(orbital angular momentum)) andP = parity assignment.
The ground stateDandD∗ are well established experimentally and can be considered as the degenerate levels of theL= 0 state. Representing these states in Dirac notation as
4 D-MESON SPECTROSCOPY - PRACTICE 6
| ±1/2,±1/2>where the first(second) index is the 3rd component of the c(light) quark intrinsic spin:
|Di = (|+1/2,−1/2i − |−1/2,+1/2i)/√ 2
|D∗,+1i = |+1/2,+1/2i
|D∗,0i = (|+1/2,−1/2i+|−1/2,+1/2i)/√ 2
|D∗,−1i = |−1/2,−1/2i
This notation explicitly illustrates that one would naively expect, from spin counting alone, a production ratio of D:D∗ = 1 : 3. This is in fact true to a good approximation in the B meson system where B∗’s represent 75% of allB+B∗ mesons. In the D-system however the proportion of D∗’s is more like 62% and results from the greater impact of non-spectator effects in D-mesons relative toB-mesons.
Of the fourL= 1 orbitally excited states only the twonarrowstates (D1 andD∗2), with decay widths of about 20MeV, have been clearly observed experimentally. The D∗0 and D∗1 are expected to have much larger decay widths and have not yet been clearly verified experimentally. Figure 8 also illustrates higher mass radial excitations of the ground state, labeled D0, D?0, which are expected to decay into D(D∗)ππ and the D?0 has now been measured in this channel by DELPHI.
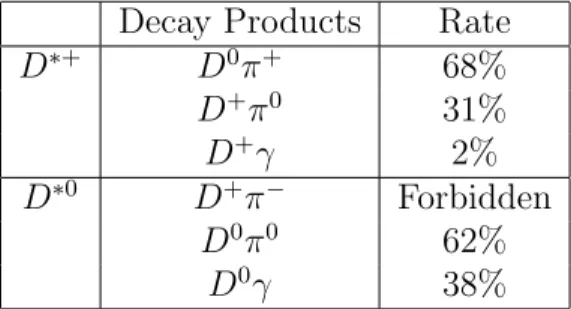
The decay branching ratios of D∗ mesons are tabulated below: The suppression of Decay Products Rate
D∗+ D0π+ 68%
D+π0 31%
D+γ 2%
D∗0 D+π− Forbidden D0π0 62%
D0γ 38%
Tabelle 1: The decay branching ratios of charged and neutral D∗ states. The charge con- jugate reactions are assumed in the above numbers. Note that the mass difference between D∗0 andD+ is less than a pion mass, making this decay channel kinematically forbidden.
D+ production indicated by the branching ratios in Table 1 result in the following overall production branching ratios of D0, D+ from cquarks:
BR(c→D0) ' 56%
BR(c→D+) ' 22%
4 D-Meson Spectroscopy - Practice
Reconstructing D-states from data can be rather difficult in practice because there are typically many potential kaon and pion candidates per event, and not all of them are
4 D-MESON SPECTROSCOPY - PRACTICE 7
decay products from a D. The general technique of spectroscopy is to form the invariant mass of various combinations of particles that fit the decay pattern of the state you are interested in i.e. the signal. The correct combinations then form a cluster or peak in the invariant mass spectrum around the true physical mass of the signal while the wrong combinations form an underlying spectrum of combinatorial background that, in general, will not peak at the mass value of the signal.
The mass peak can then be fitted, usually with a Breit-Wigner function in combination with some parameteristion of the combinatorial background. The Breit-Wigner function has the following form,
σ(x) = Γ
2π[(x−x0)2+ (Γ/2)2]
and is fully defined by x0, the position of its maximum (about which the distribution is symmetric), and by the full width at half maximum (FWHM) Γ since,
σ(x=x0) = 2·σ(x=x0 ±Γ/2).
Although originally derived to describe the cross-section of resonant scattering, the func- tion is widely used to fit non-interfering resonance peaks where x0 is the resonance mass and Γ is the energy width of the resonance. Note that in practice, reconstructed resonance peaks have widths larger than Γ due to the effects of detector resolution.
Our study ofD spectroscopy will centre on the following decay channel:
D∗+ → D0π∗+
,→K−π+ orK−π+π−π+
This channel has the advantage that a) all the decay products are charged particles so that a precise momentum measurement can be made, b) the D∗+ is relatively easy to identify experimentally through the detection of the slow pion labeled as π∗+. This name derives from the fact that there is very little energy left in the rest frame of the D∗+ after decay since,
Q=M(D∗+)−M(D0) = 145.436±0.016 MeV 'M(π+) = 139.57 MeV .
This means that the decay π+ will have low momentum in the D∗+ rest frame which makes it a useful experimental ‘tag’ for the presence of a D∗.
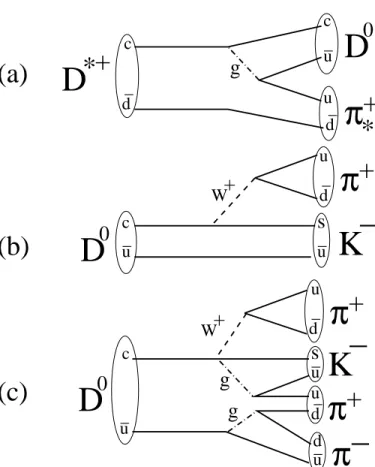
Feynmann diagrams illustrating these decay channels are shown in Figure 9. Note that the D∗+ decay shown in Figure 9(a), is a strong interaction process mediated by gluon exchange and happens so fast that the D0 and π+ decay products can be considered as originating from the primary vertex. The D0 decay however, involves the much slower weak interaction resulting in a proper lifetime of τ(D0) = 0.4 ps, cτ = 124µm. The kaon and pion decay products in this case originate from a secondary vertex separated from the primary vertex which, in principle, could be resolved with the precision tracking capability of DELPHI. Branching ratios for the above channels are listed in Table 2.
4 D-MESON SPECTROSCOPY - PRACTICE 8
Channel Branching Ratio
D∗+ →D0π+ 67.7±0.5%
D0 →K−π+ 3.83±0.09 % D0 →K−π+π−π+ 7.49±0.31 %
Tabelle 2: Current world average measurements of branching ratios for the channels of interest.
z 0
q −
e _
e +
d a h o r n s q
Abbildung 2: The process of e+e− annihilation to form a Z0 boson that then decays into a q¯q pair.
4 D-MESON SPECTROSCOPY - PRACTICE 9
Abbildung 3: The DELPHI detector showing the layout of the various sub-detectors in both the Barrel and End-Cap regions.
4 D-MESON SPECTROSCOPY - PRACTICE 10
DELPHI Interactive Analysis
Run: 26154 Evt: 3018
Beam: 45.6 GeV Proc: 1-Oct-1991
DAS : 25-Aug-1991 21:47:02 Scan: 19-Feb-1992
TD TE TS TK TV ST PA
Act Deact
14 ( 93)
0 ( 0)
72 (133)
0 ( 13)
0 ( 0)
0 ( 0)
17 ( 23)
0 ( 23)
0 ( 18)
0 ( 12)
0 ( 0)
0 ( 0)
0 ( 0)
0 ( 0)
X Y
Z
Abbildung 4: A 2-jet Z0 →qq¯event as seen in DELPHI.
4 D-MESON SPECTROSCOPY - PRACTICE 11
0.0 cm 7.5 cm
26024 / 1730
DELPHI
0.0 cm 2.0 cm
26024 / 1730
DELPHI
Abbildung 5: A B-meson decay reconstructed in the VD.
4 D-MESON SPECTROSCOPY - PRACTICE 12
12
C F liquid radiator6 14 light
Cherenkov
light Cherenkov
electrons photo
C F gas radiator
UV photon detector
5
particle
mirror
Abbildung 6: The operation principle of the DELPHI RICH detectors.
4 D-MESON SPECTROSCOPY - PRACTICE 13
Abbildung 7: The performance of charged particle identification in DELPHI. The plots show how dE/dx information from the TPC together with the liquid and gas RICH de- tectors allow the identification of lepton, pion, kaon and proton states over essentially the full momentum range of the data.
4 D-MESON SPECTROSCOPY - PRACTICE 14
Me
Abbildung 8: The spectroscopy of D-mesons containing a u or d quark. The shaded are- as show the expected widths of these states. For better clarity the decays of the D1 and D∗2 states into p and ππ are not shown.
4 D-MESON SPECTROSCOPY - PRACTICE 15
K −
K − D 0
π − π +
π +
D 0
D 0 D *+
π +
π +
u−
u−
u−
u−
u− W
+
W
+
d−
d− d−
d− d−
u−
g g
c
c
u
c
s
u d
g
* (a)
(c) (b)
c
s
u u
Abbildung 9: Feynmann diagrams for (a) D∗+ decay and D0 decay into the two channels of interest: (b) D0 →K−π+ and (c) D0 →K−π+π−π+