Descending Control in a Locomotor System
Inaugural-Dissertation zur
Erlangung des Doktorgrades
der Mathematisch-Naturwissenschaftlichen Fakultät der Universität zu Köln
vorgelegt von
Felix Clotten
aus Troisdorf
Köln
2020
Tag der mündlichen Prüfung: 25. September 2019
... Du wirst immer da sein ...
1 Introduction 1
1.1 Descending control of rhythmic behavior . . . . 1
1.2 The swimmeret system . . . . 4
1.2.1 Neuronal circuitry . . . . 4
1.2.2 Microcircuits at a silent state . . . . 6
1.2.3 Descending control . . . . 9
1.3 Aim of study . . . . 11
2 Materials and Methods 14 2.1 Animal preparation . . . . 14
2.2 Experimental procedure . . . . 15
2.2.1 Electrical stimulation . . . . 15
2.2.2 Electrophysiology . . . . 18
2.2.3 Drug application . . . . 19
2.3 Histological methods . . . . 20
2.3.1 Backfills of axon bundles . . . . 20
2.3.2 Histological development . . . . 20
2.3.3 Antibody staining . . . . 20
2.3.4 Picture acquisition . . . . 21
2.4 Analysis . . . . 22
2.4.1 Parameters of the swimmeret rhythm . . . . 22
2.4.2 Intracellular recordings . . . . 23
2.4.3 Hook electrode recordings . . . . 24
2.4.4 Statistics and data presentation . . . . 24
3 Results 25 3.1 Stimulation of descending command neurons . . . . 25
3.1.1 Histological identification of stimulated axons . . . . 25
3.1.2 Stimulations recruited distinct units . . . . 29
3.2 Stimulation effects on the swimmeret system . . . . 34
3.2.1 Termination of fictive locomotion . . . . 34
3.2.2 Initiation of fictive locomotion . . . . 37
3.2.3 Enhancement of fictive locomotion . . . . 44
3.2.4 Side-specific stimulation effects during enhancement . . . . 48
3.2.5 Similar effects evoked at different levels of the CNS . . . . 51
3.3 Stimulation effects on individual neurons of the swimmeret microcircuits . . . . . 55
3.3.1 Shifts in membrane potential during activity transitions . . . . 55
3.3.2 Enhancement on a cellular level . . . . 64
3.3.3 IRS is directly targeted by descending pathways . . . . 69
3.4 Neuromodulators mimic the stimulation effects - to some extent . . . . 72
3.4.1 Proctolin . . . . 72
3.4.2 Octopamine . . . . 77
4 Discussion 80 4.1 Stimulation of command neurons . . . . 81
4.2 Activity transitions of the swimmeret system . . . . 86
4.2.1 Spontaneous activity transitions . . . . 86
4.2.2 Termination through inhibitory command neurons . . . . 88
4.2.3 Initiation through excitatory command neurons . . . . 91
4.2.4 Enhancement through excitatory command neurons . . . . 94
4.3 Microcircuits between a silent and an active state . . . . 97
4.4 Conclusion . . . 104
5 Outlook and future experiments 105
Lokomotion ist sehr variabel, da sie sich an eine Vielzahl von Verhaltenskontexten anpassen muss. Daher müssen die Motorleistung und die zugrunde liegenden neuronalen Netzwerke an die Umgebungsbedingungen angepasst werden, in dem sie z.B. in Bezug auf Geschwindigkeit, Stärke oder Richtung moduliert werden. Vor allem muss Lokomotion initiiert werden, um eine zielgerichtete Bewegungen zu erzeugen, und zu einem anderen Zeitpunkt muss sie been- det werden. Bei einer Vielzahl von Tieren, sowohl Vertebraten als auch Invertebraten, wurde gezeigt, dass Lokomotion durch absteigende Informationen gesteuert wird, welche außerhalb des Bewegungsapparates entstehen. Im zentralen Nervensystem (ZNS) von Wirbeltieren wer- den diese Informationen von neuronalen Gruppen bereitgestellt, die eine große Anzahl von Neuronen umfassen. Bei wirbellosen ZNSs führte die geringere Anzahl von Neuronen jedoch zur Entdeckung einzelner Neurone, die die Fähigkeit besitzen, komplexe Verhaltensweisen zu initiieren oder zu beenden.
Das Netzwerk zur Bewegungskontrolle der Schwimmbeine von Flusskrebsen ist ein ausführlich beschriebenes System zur Untersuchung neuronaler Mechanismen, die der Motorleistung und Koordination mehrerer Gliedmaßen zugrunde liegen. Die Schwimmbeine sind vier gepaarte Pleopoden am Abdomen des Tieres. Beim Schwimmen des Flusskrebses bewegen sich die Schwimmbeine in alternierender Protraktion und Retraktion. Das neuronale Netzwerk, das diese Bewegungen erzeugt, wurde detailliert untersucht und es konnte gezeigt werden, dass zwei Klassen von Interneuronen den zentralen Mustergenerator (central pattern generator, CPG) bilden. Die Aktivität jedes Schwimmbeines wird von einem eigenen CPG gesteuert.
Zusätzlich wurden absteigende Kommandoneurone beschrieben, die eine fiktive Lokomotion in isolierten Präparationen des Nervensystems initiieren oder beenden. Die Frage, wie diese Neurone die CPGs ansprechen, blieb jedoch bisher unbeantwortet.
Um diese Frage zu beantworten, habe ich einzelne Axonbündel innerhalb des Nervensystems
stimuliert und extrazelluläre und intrazelluläre Aufnahmen der fiktiven Aktivität der Schwimm-
beine gemacht. Ich konnte erfolgreich zeigen, dass meine Stimulationen einzelne Komman-
doneurone rekrutierten, die fiktive Lokomotion initiierten und beendeten. Interessanterweise
konnte ich weiter zeigen, dass erregende Kommandoneurone die fiktive Lokomotion auch beschleunigen und verstärken können. Während die Beschleunigung bilateral identisch ist, ist die Verstärkung der Bewegung auf beiden Seiten unterschiedlich. Ich habe weiter gezeigt, dass hierbei nur eine Klasse von CPG-Neuronen direkten exzitatorischen Eingang bekommt.
Darüber hinaus werden die CPGs einseitig angesteuert, was einen Mechanismus zur Initi-
ierung eines bestimmten Verhaltens, z.B. Kurvenschwimmen, widerspiegeln könnte. Dies ist
der erste Beweis dafür, wie absteigende Kontrolle die Bewegung der Schwimmbeine moduliert
und liefert neue Einblicke in die allgemeine Kontrolle von Lokomotion.
Locomotion is highly variable because it needs to adapt to a wide range of behavioral contexts.
Consequently, the motor output and the underlying neuronal circuits need to be adapted in order to fit into the environmental circumstances, e.g. modulated in terms of speed, strength, or direction. Most importantly, locomotion needs to be initiated to generate necessary movements and under different circumstances it needs to be terminated. It was shown in a broad range of animals, both vertebrates and invertebrates, that motor output is controlled by descending information that arise outside of the locomotor systems. In the central nervous systems (CNS) of vertebrates these information are provided by distinct neuronal groups that comprise large numbers of neurons. In invertebrate CNSs, however, the smaller number of neurons had led to the discovery of individual neurons that possess the ability to initiated or terminate complex behaviors.
The swimmeret system of crayfish is a well characterized system to investigate the neuronal mechanisms underlying locomotion and coordination of multiple pairs of limbs. It consists of four paired limbs on the animal’s abdomen that perform cycles of alternating power and return stroke movements when the crayfish swims. On the one hand, the neuronal network that generates these movements was investigated in great detail. The activity of each limb is driven by two classes of interneurons which form the central pattern generator (CPG). On the other hand, descending command neurons were found that initiate or terminate fictive locomotion in the isolated swimmeret system. However, the question of how these neurons affect the CPGs of the swimmeret system remained unanswered.
In order to address this question, I stimulated separated axon bundles within the abdominal
nerve cord and performed extracellular and intracellular recordings of the swimmeret system’s
activity. I successfully showed that my stimulations recruited individual command neurons that
affected fictive locomotion in terms of initiation and termination. Interestingly, I was able to show
that excitatory command neurons can accelerate and strengthen fictive locomotion. While ac-
celeration is implemented bilaterally, strengthening of the motor output contains a side-specific
component. I further demonstrated that only one class of CPG neurons is directly targeted by
descending excitatory input. Furthermore, the CPGs are unilaterally targeted which may reflect
a mechanism to initiate a specific behavior, e.g. turning. This is the first evidence of how de-
scending input modulates the swimmeret system’s motor output and gives new insights into the
general control of locomotion.
1.1 Descending control of rhythmic behavior
Perhaps the most striking characteristic that all species within the animal kingdom have in com-
mon is the ability to perform movements. Movements form the basis for any form of behavior
and therefore, addressing the inherent mechanisms of the motor activity underlying it had al-
ways been a great incentive in the field of neuroscience. Within the wide range of behaviors
that animals perform, periodic movements fascinated early researchers the most and never lost
attraction since. The biological relevance of rhythmic movements is strongly emphasized by the
fact that the rhythmicity of the heartbeat represents the very first movement performed during
the embryonic development of vertebrates [Wernicke, 1876; Sylva et al., 2013]. The sinus node
of the vertebrate heart consists of specialized muscle cells that are spontaneously active and
act as pacemaker cells. No additional neuronal innervation is necessary to maintain the car-
dial rhythm. In comparison, early research on insects [Alexandrowicz, 1926] or crustaceans
[Carlson, 1904] had shown that the neurogenic hearts of invertebrates are innervated by a
specialized neuronal cluster, the cardiac ganglion (see Cooke [2002] for a review). Moreover,
Carlson [1904] already demonstrated that within the cardiac ganglion, certain neurons drive the
rhythmic activity of the decapod heart and this neuronal subset can be referred to as a central
pattern generator (CPG). CPGs either can consist of single neurons that show specific activity
oscillations due to their intrinsic properties (Alving [1968], to some extent Bal et al. [1988]),
or are formed by multiple neurons and rely on the neuron’s interconnections [Smarandache-
Wellmann et al., 2013; Friesen et al., 1976]. All CPGs share the common feature that they gen-
erate rhythmic activity without any timed sensory or descending input being necessary [Marder
and Bucher, 2001]. Besides regulation of the invertebrate heart beat, such CPGs were found
in a wide range of investigated animals and performed behaviors like breathing (see Negro
et al. [2018] for a review), chewing (see Westberg and Kolta [2011] for a review), or locomo-
tion. In fact, CPGs underlying motor activity during locomotion are investigated perhaps on
the most detailed level. In invertebrates, they had been extensively shown to control different
1 Introduction
forms of locomotion like flying in locust [Wilson, 1961], walking in cockroaches [Pearson and Iles, 1970], or swimming in leeches [Kristan and Calabrese, 1976]. On the one hand, locomo- tion is reflected by alternating activity of two antagonistic muscle groups. On the other hand, separated body segments or limbs can be active during locomotion and it could be shown that individual CPGs control for the respective motor output of these segments [Murchison et al., 1993; Brodfuehrer et al., 1995]. In order to combine their separated activities, intersegmental coordination is essential to form a goal-directed motor output on a system’s level. In different systems, this coordination could be shown to depend on sensory feedback [Cang and Friesen, 2000; Borgmann et al., 2009] or to be maintained by a specialized neuronal network, which had been successfully demonstrated in the crustacean swimmeret system [Namba and Mulloney, 1999; Mulloney and Hall, 2003; Smarandache-Wellmann and Grätsch, 2014; Smarandache- Wellmann et al., 2014].
The picture of locomotion is not complete by only describing the neuronal mechanisms that generate and maintain a specific locomotor behavior. On the output level, the most crucial as- pect of locomotion is the ability to modulate the motor activity. Since locomotion is necessary for food acquisition, predator avoidance, or sexual reproduction, modulation is the prerequisite to ensure adaptation and survival in different environmental contexts. In general, modulation can be achieved in two different ways. On the one hand, local proprioceptive feedback can directly act on the neuronal microcircuits that generate or coordinate locomotion [Büschges, 2005;
Borgmann et al., 2009; Zill et al., 2004]. On the other hand, modulatory information arising upstream of a locomotor system has been shown to be transmitted by descending pathways.
Modulation by such pathways is predominantly reflected by termination and initiation of loco- motion but also occurs in terms of acceleration or strengthening. In addition, turning behavior or postural stabilization can be achieved by modulating the activity of two body sides differently.
Ullén et al. [1995] showed that bilateral descending input from the vestibular system controls for
the rightening response in lampreys and Zelenin et al. [2000] further investigated these findings
on a neuronal level. In addition, Karayannidou et al. [2007] could demonstrate that the same
bilateral pathways account for the control of horizontal orientation. In parallel to these modu-
lations, ensuring the maintenance of proper locomotion, sensory information can also initiate
locomotion. Lampreys for example completely depend on olfactory sensation to find a food
source. In preparations of the isolated nervous system of the lamprey, olfactory input activates
a poly-synaptic pathway that produces fictive locomotion [Derjean et al., 2010; Daghfous et al.,
2018]. Within this neuronal pathway, reticulospinal neurons activate the locomotor networks
in the spinal cord [Di Prisco et al., 1997; Dubuc et al., 2008]. However, Grätsch et al. [2018]
could recently show that a subpopulations of reticulospinal neurons are additionally involved in a parallel descending pathway that terminates locomotion. Analogous descending pathways initiating locomotor responses were also described in other vertebrates. To name only a few, Mauthner cells trigger escape response in fish [Eaton et al., 2001], electrical stimulation of the mesencephalic locomotor region (MLR) initiates locomotion in salamanders [Cabelguen et al., 2003] and cats (see [Whelan, 1996] for a review), and optogenetic activation even of distinct neuron populations within the MLR can initiate and modulate motor output in mice [Josset et al., 2018]. In addition, descending pathways that terminate locomotion were also described in frog tadpoles [Perrins et al., 2002], cats [Takakusaki et al., 2003], and mice [Bouvier et al., 2015].
Despite immense methodical advances in recent times, descending pathways in vertebrates were so far mostly described on a level of distinct populations of neurons. Due to smaller numbers of neurons and considerably lower complexity, invertebrate systems offer the great advantage to investigate the function of individual neurons within these pathways. For exam- ple, Zorovi´c and Hedwig [2012] intracellularly recorded from descending interneurons in the cricket and demonstrated their role in activation and modulation of walking. In fruit flies, Bi- daye et al. [2014] identified a bilateral pair of descending interneurons that trigger backward walking and Sen et al. [2017] could show, that asymmetric activation of these neurons induces backward turning. In terms of swimming, individual neurons for both initiation [Brodfuehrer and Friesen, 1986] and termination [O’Gara and Friesen, 1995] were discovered in leech. Interest- ingly, the very first description of descending neurons commanding locomotor movements was also related to a swimming movement, the escape response of crayfish, when Wiersma [1947]
described, that electrical stimulation of the giant fibers within the connectives evoked contrac-
tion of flexor muscles of the animals abdomen (see [Edwards et al., 1999] for a review). Several
years later, Wiersma and Ikeda [1964] also demonstrated individual neurons that initiate and
terminate swimming behavior in isolated preparations of the abdominal nervous system of the
crayfish and referred to them as command neurons of the swimmeret system.
1 Introduction
1.2 The swimmeret system
The swimmeret system of crustaceans provides a well established system to reveal fundamen- tal mechanisms that underlie locomotor movements. Like all arthropods, crustaceans have a segmented body with paired limbs on each segment. Different segments contain limbs special- ized for a specific function. The swimmerets are the limbs located on the animal’s abdomen and besides their function in turning behavior [Copp and Hodes, 2001] and righting response [Davis, 1968a], they perform the locomotor movements used during swimming. For researchers, the swimmeret system combines several aspects that emphasize its important role in studying locomotion. First of all, preparations of the isolated abdominal nerve cord of crayfish, i. e.
preparations lacking any sensory or proprioceptive feedback, express the same motor pattern as it is observed in vivo [Wiersma and Hughes, 1961]. This so called fictive locomotion is expressed without experimental application of neuromodulatory substances and enables de- tailed investigations under this reduced conditions [Wiersma and Ikeda, 1964]. In addition, the isolated preparation provides great accessibility regarding intracellular recordings or drug appli- cation, even to distinct parts of the nervous system. Finally, the neuronal circuits underlying the swimmeret system’s motor output, i.e. alternating motor neuron activities and intersegmental coordination, were characterized in great detail. Hence, the swimmeret system offers the pos- sibility to address specific questions regarding neuronal control of locomotion (see Mulloney and Smarandache-Wellmann [2012] for a review).
1.2.1 Neuronal circuitry
The swimmeret system of the signal crayfish, Pacifastacus leniusculus (DANA, 1842), consists
of four pairs of swimmerets on abdominal segments two to five (Figure 1.1 A). The pair of
limbs on the first abdominal segment is only developed in male crayfish and is modified for
sexual reproduction. Propulsion during swimming is achieved by rhythmical movements of
the four pairs of swimmerets by performing cycles of alternating power-stroke (PS, retraction)
and return-stroke (RS, protraction) movements. During straight forward swimming, the two
swimmerets of one abdominal segment are active synchronously [Davis, 1968a]. However,
the mechanism of this bilateral coupling remains unknown and I will further only address the
unilateral activity pattern of the swimmeret system. The PS generates the actual driving force
and the RS returns the swimmeret to the initial position, required for performing a subsequent
power-stroke (Figure 1.1 B). The muscles underlying these movements are controlled by PS
and RS motor neurons, located in the ipsilateral hemiganglion of the corresponding abdominal
ganglia A2 to A5 (Figure 1.1 C). They project their axons through the first nerve (N1) and can be pooled in four functional groups: PS Exciters (PSE), PS Inhibitors (PSI), RS Exciters (RSE) and RS Inhibitors (RSI). The axons of PSE and PSI project through the posterior and the axons of RSE and RSI through the anterior branch of N1, respectively [Mulloney and Hall, 2000]. Extracellular recordings from these branches reveal alternating discharge patterns of PSE and RSI motor neurons on the one hand, and RSE and PSI motor neurons on the other hand. PS muscles are inhibited when RS muscles are excited, and vice versa. Although direct synaptic connections between small subsets of motor neurons were shown to exist [Sherff and Mulloney, 1996], it was hypothesized that these monosynaptic connections do not play a crucial role in maintaining their alternating activity. Instead, it was shown that the alternating activity of different motor neuron pools is driven by a local CPG, located in each hemiganglion [Heitler and Pearson, 1980; Murchison et al., 1993].
The local CPGs consist of two populations of non-spiking interneurons that drive motor neuron activity by graded, inhibitory transmitter release [Paul and Mulloney, 1985b,a; Mulloney, 2003].
Smarandache-Wellmann et al. [2013] described three types of interneurons inhibiting PSEs
and RSIs and two types of interneurons inhibiting RSEs and PSIs. They assigned these neu-
rons to previous descriptions of CPG neurons and renamed them as Inhibitors of PS (IPS) and
Inhibitors of RS (IRS). Each IPS type was found as single copies in each hemiganglion and, al-
though the three types are distinguishable by their specific morphology, they were not found to
have different effects on the fictive motor pattern. Depolarizing current injection in IPS, inhibits
PS activity and excites RS activity of the respective hemiganglion. Vice versa, hyperpolariza-
tion of IPS excites PS and inhibits RS activity. In contrast to IPSs, Smarandache-Wellmann
et al. [2013] only characterized two different types of IRS with absolute certainty. IRS hook
(IRSh) and IRS no hook (IRSnh) can be distinguished by their morphology and were also de-
scribed to be present as single copies within each hemiganglion. Depolarization of either IRSs
excites PS and inhibits RS activity, whereas hyperpolarization inhibits PS and excites RS activ-
ity. However, occasional dye-coupling of two similar neurons gave evidence for the existence of
an additional IRSnh, electrically coupled to the already described IRSnh. Whether this finding
reflects a distinct, third type of IRS had not been demonstrated so far. Interestingly, IRSh, but
not IRSnh, is electrically coupled to Commissural Interneuron 1 (CI1), which takes a crucial role
in intersegmental coordination [Smarandache-Wellmann et al., 2014]. In the active swimmeret
system, the membrane potentials (V
m) of IPSs and IRSs oscillate in antiphase to each other
due to reciprocal inhibition [Murchison et al., 1993; Skinner and Mulloney, 1998]. The alternat-
ing motor activity of PS and RS is shaped by this opposing oscillations and consequently fully
1 Introduction
relies on the interplay of IPS and IRS.
During forward swimming in intact animals, as well as during fictive locomotion in isolated preparations, swimmeret activity reveals a stable posterior-to-anterior progression from A5 to A2 [Ikeda and Wiersma, 1964; Davis, 1968b]. The movements of different pairs of swimmerets are temporally shifted among each other, i.e. the cycle of movement starts with the most posterior pair and the anterior ones follow with a phase lag of approximately 25 % between segments, independent of the swimming speed [Davis, 1968b; Mulloney and Smarandache- Wellmann, 2012, (Blumenthal and Smarandache-Wellmann, unpublished)]. This metachronous wave from posterior to anterior is maintained by an ipsilateral coordinating network that consists of three neurons, located as single copies in each hemiganglion. Two different types of coor- dinating neurons encode information about the motor activity of their own hemiganglion and send it in ascending (Ascending Coordinating Neuron, ASC
E) and descending (Descending Coordinating Neuron, DSC) direction to neighboring hemiganglia [Namba and Mulloney, 1999;
Smarandache-Wellmann and Grätsch, 2014]. The third neuron, CI1, decodes the coordinating information from all neighboring ganglia and feeds it back to the CPG of its own hemiganglion [Mulloney and Hall, 2003; Smarandache-Wellmann et al., 2014].
1.2.2 Microcircuits at a silent state
Since research on the swimmeret system mostly aimed to investigate the neuronal basis of oscillatory activity, i.e. alternating PS and RS activity, information about the microcircuits in an inactive state is sparse. On a behavioral level, Davis [1968a] showed that during righting responses in intact lobster, one side of the paired swimmerets is inactive. In this case, the swimmerets are protracted in the RS position. This can also be observed in intact crayfish not performing any swimmeret movements (personal observations). These animals keep all swim- merets in a horizontal position directed anteriorly. This position could either be determined by the morphological or anatomical structure of the swimmerets, or indicates a tonic activity of the RS muscles while the PS muscles are inactive. In lobster, Davis [1969] performed record- ings from swimmeret muscles and distinguished the activity of individual motor neurons. He described tonic activity of motor neurons when no swimmeret movements were observed and stated that this might be associated with holding the swimmeret at a specific position. Unfortu- nately, it is not possible to assign this tonic activity to one functional group of motor neurons, i.e.
PSE or PSI, or RSE or RSI, respectively. Generally, an inactive state of the isolated prepara-
tion of the swimmeret system is defined as the absence of PS activity. Intracellular recordings
performed in crayfish further revealed that the membrane potential (V
m) of motor neurons does
A B
C
power stroke return stroke
~ 4 ~ 4 A2
A3
A4
A5
A
DSCs
ASCE
DSC RSI
PSI RSE PSE
IRS
inhibitory excitatory electrical
~
ASCE
PS RS
IPS C 1 I
N1N2
N3 RSE RSI
PSI PSE A
A
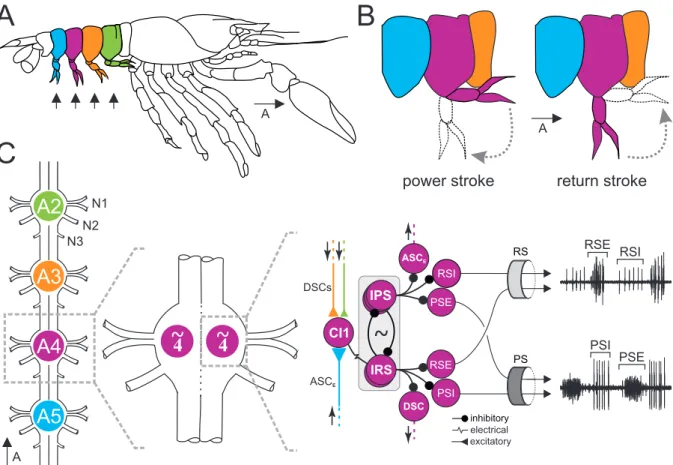
Figure 1.1: The swimmeret system of the crayfish, Pacifastacus leniusculus. A: Schematic drawing of a crayfish.
The swimmerets (arrows) are paired limbs on the animal’s abdomen. B: During forward swimming, swimmerets
perform alternating power (PS) and return (RS) strokes. C: From left to right: Schematic drawing of the four
abdominal ganglia that innervate the swimmerets. The activity of a single swimmeret is controlled by a neuronal
micro circuit located in the corresponding hemiganglion. Two groups of neurons (IPS, IRS) form the CPG that the
alternating discharge of RS and PS motor neurons (RSE / PSI, and PSE / RSI). Three neurons (CI1, DSC, ASCE)
form a coordinating network that coordinates the activities of ipsilateral hemiganglia. A detailed description is given
in the text. Abdominal body segments and corresponding ganglia are colored (2nd: green, 3th: orange, 4th: purple,
5th: blue). RS return stroke, PS power stroke, N1 first nerve root, N2 second nerve root , N3 third nerve root, A2-
A5 abdominal ganglia, CI1 Commissural Interneuron 1, DSC Descending Coordinating Neuron, ASCE Ascending
Coordinating Neuron, IPS Inhibitor of Power Stroke, IRS Inhibitor of Return Stroke, RSI Return Stroke Inhibitor ,
RSE Return Stroke Exciter, PSI Power Stroke Inhibitor , PSE Power Stroke Exciter.
1 Introduction
not oscillate in this silent state [Heitler, 1978; Sherff and Mulloney, 1997; Mulloney, 2003]. At this non-oscillating potential (NOP), Sherff and Mulloney [1997] described that “a few motor neurons fired action potentials tonically, but most were quiet” but did not further distinguish between different functional groups. However, Mulloney [2003] assigned his observations in a silent state to specific groups of motor neurons. In his experiments, the axons of PSE did not show any neuronal discharge “while a few RSE and RSI axons fired steadily”. If a prepara- tion became active, PSEs fired bursts of action potentials and RSEs and RSIs “changed from steady firing to periodic bursting”. Mulloney [2003] additionally described these changes at the intracellular level and specifically reported that the V
mof one RSE started to oscillate “around it’s resting potential [in this thesis: NOP]”.
Absent PS and tonic RS activity during a silent state of the swimmeret system, indicates that PSEs and RSEs are locked at a comparatively hyper- or depolarized V
m, respectively. Since phasic inhibition from the CPG neurons gradually modulates the V
mof motor neurons when the system is active, this constant, stable synaptic inputs represent a potential source for the lack of oscillations in different motor neuron groups. Heitler and Pearson [1980] performed simul- taneous intracellular recordings from one PSE and one presynaptic, non-spiking interneuron, presumably IRS. Depolarization of the interneuron decreased the amplitude of V
moscillations in the PSE “with the membrane potential remaining in the depolarized phase”, indicating re- duced inhibition. In addition, they observed a strong excitation of other PS motor neurons and inhibition of RS motor neurons that were recorded extracellularly. In contrast, hyperpolarization of the interneuron silenced the system, i.e. PS activity was absent and RS became tonically active. The V
moscillations of PSE were again “much reduced with the membrane remaining hyperpolarized”. Smarandache-Wellmann et al. [2013] could reproduce these effects by current injections into identified IRSs and observed the opposite effects on motor neurons regarding IPS. Depolarization of IPS silenced PS activity and evoked tonic RS activity. In addition, their intracellular recordings indicate that the amplitudes of V
moscillations of IRS and IPS decreased when the neurons were hyperpolarized or depolarized, respectively. This could indicate, that the NOP in a silent state is respectively hyper- or depolarized, compared to V
moscillations in an active state.
The observations made by Heitler and Pearson [1980] and Smarandache-Wellmann et al.
[2013] are due to artificial interfering with the rhythmicity of the swimmeret system, i.e. altering
the activity of a single neuron with current injections. However, spontaneous transition from
one state into the other might be underlined by different shifts in the V
m. Only little information
is available about spontaneous activity transition at the level of interneurons of the swimmeret
system. Paul and Mulloney [1985b] showed one recording of IPS (previously Interneuron 1, Figure 2 A in Paul and Mulloney [1985b]), whose V
mstarted to oscillate spontaneously. In this case, the peak potential (PP) during oscillations was at the V
mof the NOP. Analog to motor neu- rons, the coordinating neurons DSC and ASC
Ealso receive synaptic inhibition from the CPG interneurons and Schneider [2017] showed two examples of spontaneous activity transition of these neurons. She demonstrated that the NOP of DSC is at the V
mof the PP, whereas the NOP of ASC
Eis at the V
mof the trough potential (TP) during oscillation. Finally, Blumenthal [2018] presented one example of spontaneous transition, revealing that the NOP of CI1 equals it’s TP.
1.2.3 Descending control
As extensively described in chapter 1.1, locomotion can be modulated by descending input from higher centers of the CNS, i.e. neuronal populations upstream of locomotor systems.
Here, sensory information plays a crucial role and was shown to affect the activity of the swim-
meret system. The righting response of crustaceans, as described by Davis [1968a], relies
on information provided by the statocysts system. In the crayfish species Procambarus clarkii,
statocyst-driven descending interneurons (SDI) were described both at the level of the brain
[Nakagawa and Hisada, 1989] and within the abdominal connectives [Takahata and Hisada,
1982]. Takahata and Hisada [1982] described four pairs of SDIs projecting throughout the en-
tire nervous system to the most posterior ganglion A6. Two of them receive input from the
contralateral, one from the ipsilateral side, and one pair receives bilateral input. Even if it is
not demonstrated so far, the projection pattern of SDIs and the contribution of swimmerets in
righting responses indicate that SDIs can potentially affect the swimmeret system. Subsequent
research has shown that the activity of SDIs is affected by proprioception of the walking legs
[Hama and Takahata, 2003], the behavioral context, i.e. the direction of walking [Takahata et al.,
1984], and to some extent by the visual system [Takahata and Hisada, 1982]. At the level of the
brain, statocyst-driven local interneurons that are most likely presynaptic to SDIs [Nakagawa
and Hisada, 1989], were shown to be modulated by sensory information from the walking legs
[Hama and Takahata, 2005]. Furthermore, the dendritic projections of SDIs and their presy-
naptic partners within the brain suggest interaction with other sensory neurons [Nakagawa and
Hisada, 1989]. Therefore, SDIs can be assumed to be multimodal interneurons and Takahata
and Hisada [1982] discussed a potential role as command neurons of the righting response. In
fact, this idea is strongly emphasized since Fraser [1975] was able to evoke a righting response
in the crab, Scylla serrata, by electrical stimulation of a single SDI.
1 Introduction
Command neurons were also described in the swimmeret system. Descending axons within the abdominal connectives that modulate fictive locomotion were first extensively investigated in P. clarkii by Wiersma and Ikeda [1964]. They described five pairs of excitatory command neurons that, when electrically stimulated, initiated fictive locomotion in isolated preparations of the abdominal nervous system. The period of the evoked activity depends on the stimulation frequency [Stein, 1971; Atwood and Wiersma, 1967] and early studies stated that stimulation of different command neurons evoked slightly different effects within the swimmeret system [Atwood and Wiersma, 1967]. Acevedo et al. [1994] demonstrated the existence of the same neurons in P. leniusculus and named then E
Ato E
Eaccording to the locations described by Wiersma and Ikeda [1964] and their excitatory effect (Figure 1.2 A, B). In contrast to Atwood and Wiersma [1967], she described similar motor activities evoked by stimulation of individ- ual excitatory command neurons. Furthermore, she compared the resulting fictive locomotion to spontaneous and proctolin-induced (PR) locomotion, and did not find any differences. A remarkable bioassay and antibody labeling against PR, gave evidence that at least a portion of the excitatory command neurons contain PR that is released within the abdominal ganglia during stimulation of these neurons [Acevedo, 1990; Acevedo et al., 1994] (Figure 1.2 C).
Analog to excitatory command neurons, Wiersma and Ikeda [1964] and Acevedo et al. [1994]
also described inhibitory command neurons of the swimmeret system. Electrical stimulation of the axons of these neurons completely terminated PS activity, applicable for both sponta- neous locomotion or locomotion evoked by stimulation of an excitatory command neuron. The locations of the axons within the abdominal connectives are close to some of the excitatory command neurons, and Acevedo et al. [1994] named then I
A, I
Cand I
Edue to their inhibitory effect (Figure 1.2 B). It was shown that octopamine (OA) terminates fictive locomotion, making OA a potential neurotransmitter to be released by inhibitory command neurons [Mulloney et al., 1987]. Mulloney et al. [1987] further demonstrated that bath application of phentolamine, an OA antagonist, partially blocked the termination caused by the stimulation of inhibitory command neurons.
Although descending input that affects the swimmeret system was described in detail, we are
still lacking knowledge about the neuronal targets of inhibitory and excitatory command neurons
within the microcircuits. Frequency-dependent effects on the period and on the excitement of
PS motor neurons [Davis and Kennedy, 1972a], suggest that both the CPG neurons and the
motor neurons are targeted. However, if they are affected within the same magnitude or with
bilateral differences was not investigated on a cellular level. In addition, it is unknown which
input command neurons receive and how they interact with other descending input, e.g. SDIs.
B
LG
MG
77 76
78 79 80 81
82 84 83
85
E & I
A AE
DE
BE & I
C CE & I
E EA C
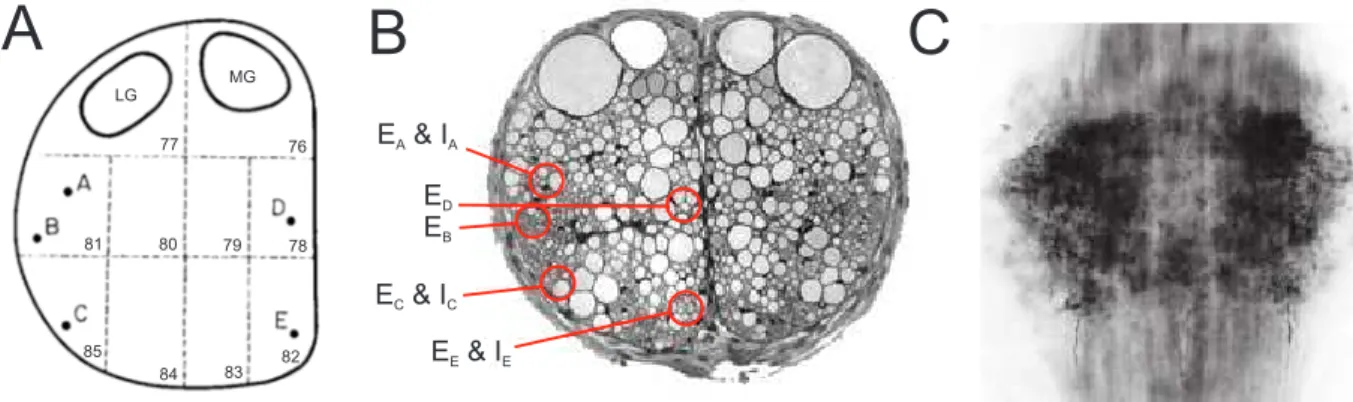
Figure 1.2: Command neurons of the swimmeret system. A: Schematic drawing of an abdominal hemiconnec- tive. Numbers refer to areas described by Wiersma and Hughes [1961]. Letters A to E indicate the locations of excitatory command neurons EA - E. Modified from Wiersma and Ikeda [1964]. B: Cross section of one abdominal connectives in Pacifastacus leniusculus . Letters EA - E and IA,C,E indicate the locations of excitatory and inhibitory command neurons, respectively. Adopted from Mulloney and Smarandache-Wellmann [2012]. C: Anti-proctolin an- tibody labeling in the abdominal ganglion A2 (dorsal view, anterior at the top). Dense labeling is present in ganglion, predominantly in the lateral neuropil. Adopted from Acevedo et al. [1994]. LG lateral giant fiber, MG medial lateral giant fiber , Ex excitatory command neuron, Ix inhibitory command neuron.
1.3 Aim of study
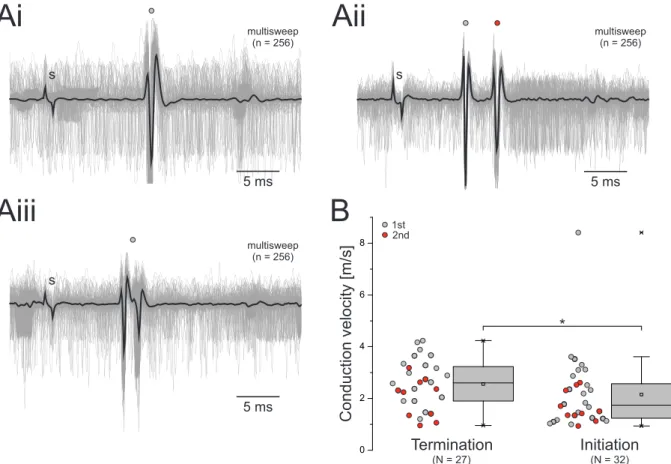
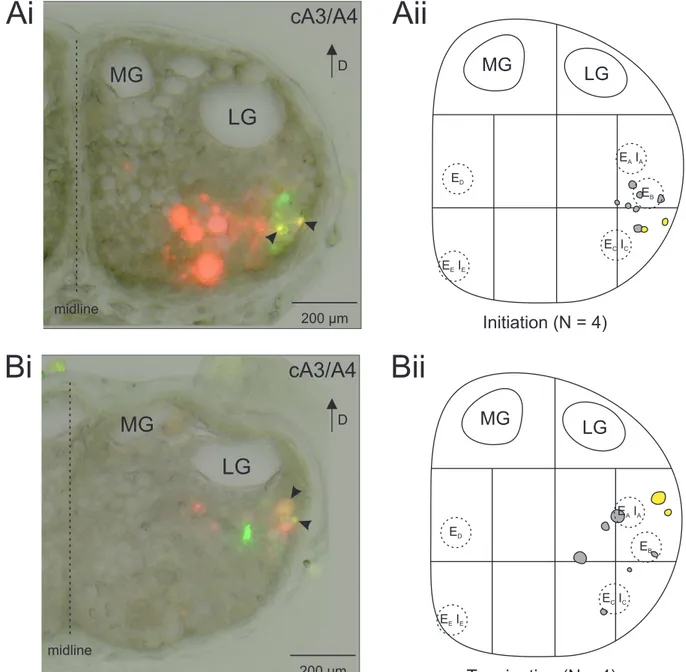
The first aim of my thesis was to revise previous studies of command neurons of the swimmeret system that were shown to provide descending control of locomotion. In addition to already described termination and initiation of fictive locomotion, I wanted to address further modulatory effects on the motor output, e.g. a potential enhancement of fictive locomotion. Therefore, I performed electrical stimulations in areas that presumably contain the axons of inhibitory and excitatory command neurons and extracellularly recorded the motor output of the swimmeret system. Since the locations of the command neurons’ axons were so far described only by visual estimation, I aimed to provide a histological proof of the stimulated axons and investigate their physiological properties, i.e. the extent of their axonal projection and the propagation of descending information. In future, these anatomical and physiological approach will ensure proper comparison between different experiments and studies. They are further necessary to relate the evoked modulations of fictive locomotion to different descending inputs (e.g. statocyst input, Yoshino et al. [1980]; Takahata and Hisada [1982]) and to other behaviors observed in intact animals (e.g. turning, Bowerman and Larimer [1974]).
The second aim of my thesis was to study transitions between different states of activity at the
level of the neuronal microcircuits. Therefore, I investigated activity changes in individual neu-
rons by performing intracellular recordings. The membrane potentials (V
m) of these neurons
1 Introduction
oscillate between phases of depolarization (peak potential, PP) and hyperpolarization (trough potential, TP) when the swimmeret system expresses fictive locomotion but are stable at a silent state (non-oscillating potential, NOP). As suggested by behavioral observations and physiolog- ical descriptions, different neuronal groups are locked at specific phases of V
moscillations, i.e.
they are either continuously depolarized or hyperpolarized (Chapter 1.2.2). Based on these finding, I hypothesized a silent state of the microcircuits in which the NOP of each neuron is assigned to be either at the PP or the TP (Figure 1.3). The absence of rhythmic power stroke (PS) motor activity indicates tonic hyperpolarization of PS excitatory motor neurons (PSE) at the TP and continuous depolarization of PS inhibitory motor neurons (PSI) at the PP. Vice versa, continuous return stroke (RS) activity indicates continuous depolarization of RS excita- tory motor neurons (RSE) at the PP and continuous hyperpolarization of RS inhibitory motor neurons (RSI) at the TP. Due to the known neuronal circuitry, I assume that the specific NOP of a motor neuron is determined by either tonic or absent inhibition by the respective interneu- rons of the central pattern generator (CPG). The NOPs of these CPG neurons consequently determine the NOPs of the neurons forming the coordinating network (Figure 1.3 B).
My final aim was to identify the local targets of command neurons. Termination and initiation
of fictive locomotion is achieved by unilateral stimulations of command neurons that bilater-
ally affect PS motor activity [Wiersma and Ikeda, 1964; Mulloney et al., 1987; Acevedo et al.,
1994]. Consequently, I assumed that both hemiganglia of one segment are equally targeted by
unilateral command neurons. In addition, initiated fictive locomotion is reflected by constant co-
ordination that is independent of the evoked period of the motor output. This suggests that the
neurons of the coordinating networks are not affected by command neurons. Instead, there is
evidence that the period and the strength of fictive locomotion depend on varying input from ex-
citatory command neurons, indicating that CPG neurons and motor neurons are direct targets
of these neurons.
DSCs
ASC
EDSC RSI
PSI RSE PSE
IRS
inhibitory synapse excitatory synapse electrical synapse
~
ASC
EPS RS
IPS C 1 I
A B
swimmeret tonically protracted A
Peak potential Trough potential
silent active Silent state
RSE PSI
RSI PSE
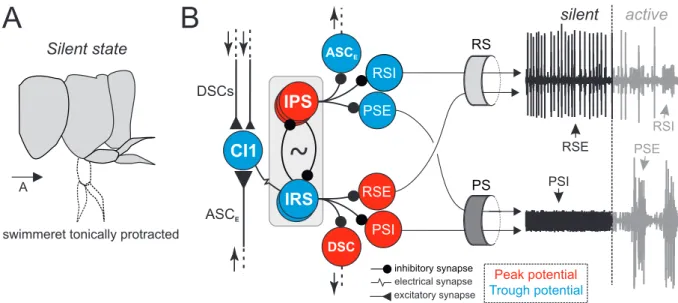
Figure 1.3: Illustration of a hypothetical silent state of the microcircuit. A: In freely behaving crayfishes, swim-
merets are tonically protracted in the return stroke (RS) position, indicating tonic excitation of RS muscles and tonic
inhibition of PS muscles. B: During swimming, the membrane potentials of neurons within the micro circuits oscillate
between the peak (PP, depolarized phase) and the trough (TP, hyperpolarized phase) potential to generate alternat-
ing activity (not shown). In a silent state, different neuronal groups are locked at one of these phases to generate
tonic discharge of RS exciters (RSE) and PS inhibitors (PSI), and suppress discharge of PS exciters (PSE) and RS
inhibitors (RSI). The corresponding activities of motor neurons at a silent and an active state are illustrated by ex-
tracellular recordings of the posterior (PS) and anterior (RS) branch of the first nerve root. A detailed description is
given in the text. RS return stroke, PS power stroke, CI1 Commissural Interneuron 1, DSC Descending Coordinat-
ing Neuron, ASCE Ascending Coordinating Neuron, IPS Inhibitor of Power Stroke, IRS Inhibitor of Return Stroke,
RSI Return Stroke Inhibitor , RSE Return Stroke Exciter , PSI Power Stroke Inhibitor, PSE Power Stroke Exciter .
2 Materials and Methods
All surgical and experimental procedures were performed observing the guidelines of the ani- mal protection act of the Federal Republic of Germany. Signal crayfish, Pacifastacus leniuscu- lus, were caught in different waters of North Rhine-Westphalia by local fishermen or members of our research group. Animals were kept in aerated fresh water maintained at 14° C and fed once a week with organic carrots and shrimp pallets (The Hartz Mountain Corporation, New Jersey, USA). For this study, I performed experiments on 107 adult animals of both sexes.
2.1 Animal preparation
Directly prior to an experiment, I took a single crayfish from the animal holding tanks and anes- thetized it on ice for 30 minutes. Both claws were cut at their bases, the left and right uropod were removed and the crayfish exsanguinated through the claw openings with 50 ml cold nor- mal crayfish saline (CS) (5.4 mM KCl, 2.6 mM MgCl
2, 13.5 mM CaCl
2and 195 mM NaCl, buffered with 10 mM Tris base and 4.7 mM maleic acid at pH 7.4 - 7.6 and oxygenated for 2 hours). The crayfish was decapitated and the abdominal nerve cord together with the forth and fifth thoracic ganglia was isolated and pinned out straight with the dorsal side up in a Petri dish lined with transparent Sylgard (Sigma-Aldrich, St. Louis, MO, USA). For a detailed de- scription of the preparation steps see Seichter et al. [2014]. In the experiments presented in chapter 3.2.5, I isolated additional portions of the nervous system. In addition to the abdomi- nal chain of ganglia, these preparations either included only the thoracic ganglia T1 to T5, the subesophageal ganglion, or the entire nervous system as far as to the level of the brain. All ganglia were desheathed on the dorsal side using fine forceps and scissors to ensure proper oxygen supply of the nervous tissue. If necessary for the experiment, I isolated the nerves innervating the walking leg muscles in T4.
For electrical stimulations the connectives between the first (A1) and second (A2) abdominal ganglia (cA1/A2) were completely desheathed. The dorsal portion of one hemiconnective, i.e.
divisions 76 and 77 [Wiersma and Hughes, 1961], were removed to preclude stimulation of the
medial (MG, 76) and lateral (LG, 77) giant fibers. The remaining portion of the hemiconnec- tive was split into separated axon bundles using a sharpened insect pin while care was taken to prevent axon damages. In some experiments I performed stimulations at different levels of the nervous system. The respective portion of the connectives was prepared according to the description for cA1/A2. In addition, the connective between A5 and A6 (cA5/A6) was also desheathed to facilitate extracellular recordings using a hook electrode. To improve the record- ing quality, the hemiconnective of cA5/A6 ipsilateral to the stimulation was subdivided into two dorsal and two ventral sections.
2.2 Experimental procedure
2.2.1 Electrical stimulation
I electrically stimulated separated axon bundles at the level of cA1/A2 using a suction electrode (Figure 2.1 A). Suction electrodes were pulled on a micropipette horizontal puller (P-87, Sutter Instruments) with filament (Sutter Instruments) from fire polished borosilicate glass capillaries (outer/inner diameter: 1.5 mm/0.86 mm). I manually broke the tips under visual control using a dissection microscope to generate tip openings suitable for axon bundle diameters used in this study. A single axon bundle was cut posterior to A2 and carefully sucked into the suction electrode (Figure 2.1 B). The reference electrode was placed in the bath solution. Stimuli were generated with a Universal Digital Stimulator (MS 501, Electronic Lab), further processed by an Universal Stimulus Isolater (Model 401, Electronic Lab, University of Cologne, Germany) and send to a preamplifier (MA 103, Electronic Lab) connected to the electrode. The stimulus signal was digitized by an A / D converter (Digidata 1440A, Molecular Devices, Sunnyvale, CA, USA or Micro1401 mkII, Cambridge Electronic Design, Cambridge, England) and recorded on a computer with Spike2 (v7.09, Cambridge Electronic Design) or pClamp software (v10.2.0.18, Molecular Devices).
Within an experiment, I stimulated different axon bundles until a reproducible stimulation effect
was evoked by the stimulation of the same bundle. Please note that I stimulated several axon
bundles in each preparation but not all of them had an effect on the swimmeret system. In
this study I present only the data from successful stimulations, i.e. stimulations that initiated,
terminated or enhanced fictive locomotion of the swimmeret system. I used silent preparations,
i.e. preparations not being spontaneously active in normal crayfish saline, to initially investi-
gate the initiation of fictive locomotion. Afterwards, a stable expression of fictive locomotion
2 Materials and Methods
was elicited by using crayfish saline containing carbolic (CCh, Sigma-Aldrich, St. Louis, MO, USA). Analogously, I used active preparations (spontaneously or CCh-induced) to investigate the termination of fictive locomotion by electrical stimulations.
The stimuli I used in this study, were trains of rectangular pulses with a duration of 1 ms and
a frequency of 30 Hz delivered in bouts lasting from one second up to one minute. For every
single stimulation configuration, the stimulus amplitude was individually set depending on stim-
ulated axons and the seal between the axon bundle and the suction electrode. Therefore, the
amplitude was gradually increased until a stimulation effect was reproducible observed, even-
tually ranging from 0.01 to 0.1 mA for individual stimulations. In some experiments, in order
to investigate the effect of changes in stimulation frequency and amplitude, I tested different
stimulation frequencies (10 to 50 Hz). Occasionally, I tested additional stimulation amplitudes
above or below the initial value.
A
Suction electrode + Saline
Electrical stimulation
cA5/A6
Hook electrode
A5
A6 A4 A2 A1 T5
N1 N2
N3
ipsi contra
LN LN
Pin electrode
RS3i
Pin electrode
PS3i
A RS3i
PS2i PS2c
Sharp electrode + dTR
Intra (A3i)
Pressure injection + FastGreen FCF
Pico (A3i) A3
PS3iPS3c
RS4i PS4i PS4c
PS5i PS5c
Petroleum jelly 200 µM
Stimulated axon bundle
cA1/A2 100 µM
C
D
400 µM A
N1 N2
N3
A3
PS3i RS3i
contra ipsi
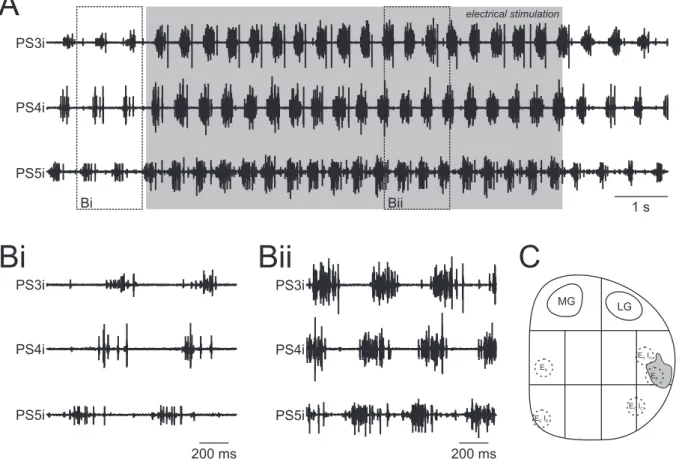
Figure 2.1: Experimental setup. Dorsal views. Dashed lines indicate midline. A: Schematic drawing of the preparation consisting of ganglia T4 to A6. The extracellular recordings of the motor output of abdominal ganglia A2 to A5 are listed using the corresponding color code. Electrical stimulations using a suction electrode were performed anterior to the swimmeret system, i.e. cA1/A2, and recordings of stimulus-correlated activity at the level of cA5/A6 using a hook electrode. B: Picture of an electrical stimulation of a separated axon bundle at the level of cA1/A2. C:
Picture of a representative ganglion, i.e. A3. The anterior and posterior branches of N1 contain the axons of RS and PS motor neurons, respectively. D: Schematic drawing of an individual ganglion. Extracellular recordings of RS and PS activity were performed using pin electrodes. Intracellular recordings of individual neurons using sharp microelectrodes and focal drug application using a suction electrode were performed within the lateral neuropil.
For clarity reasons, only recordings ipsilateral to the electrical stimulation are depicted here. RSi ipsilateral return
2 Materials and Methods
2.2.2 Electrophysiology
I extracellularly recorded the activity of motor neurons using stainless steel pin electrodes [Se- ichter et al., 2014] (Figure 2.1 A). I recorded power stroke (PS) motor neurons bilaterally from ganglia A2 to A5 and return stroke (RS) motor neurons from ganglia A3 and A4 ipsilateral to the electrical stimulation. Electrodes were inserted into the Sylgard close to the posterior or anterior branch of N1 for recording of the PS or RS, respectively. The respective nerve branch was wrapped around the electrode and insulated from the bath solution using petroleum jelly (Figure 2.1 C and D). The reference electrodes were inserted into the Sylgard close to the corresponding recording electrode .
To investigate the propagation of neuronal signals that were potentially evoked by the electrical stimulation, I aimed for picking up stimulus-correlated activity at the most posterior level of the abdominal nervous system, i. e. cA5/A6. Therefore, I used a hook electrode (Electronic Lab) connected to a preamplifier (MA 101, Electronic Lab) to extracellularly record from a separated portion of the hemiconnective ipsilateral to the stimulation (Figure 2.1 A). I insulated the hook electrode together with the respective axon bundle from the bath solution using petroleum jelly and placed the reference electrode nearby into the bath.
I performed intracellular recordings in the dendritic processes within the lateral neuropil (LN) using sharp microelectrodes to investigate the stimulation effect on individual neurons (Fig- ure 2.1 D). Characterization of neurons was based on their physiological properties, i. e. spik- ing activity, phase of membrane potential oscillations, and the effect on the motor output of the corresponding hemiganglion (see chapter 1.2.1). Motor neurons were finally characterized by identifying intracellularly recorded action potentials on corresponding extracellular PS or RS recordings. In contrast to that, the non-spiking interneurons of the CPGs were only considered in this study if they matched the neurons’ morphology and physiology [Smarandache-Wellmann et al., 2013]. Microelectrodes were pulled on a micropipette horizontal puller (P-1000, Sutter Instruments, Novato, CA, USA) from fire polished borosilicate glass capillaries (outer / inner diameter: 1 mm / 0.5 mm) and filled with 1 % dextran Texas Red (dTR; Invitrogen, Carlsbad, CA, USA) or 1 % dextran Fluorescein (FITC, Life Technologies, CA, USA) in 1 M KAc + 0.1 M KCl, resulting in tip resistances of 30 - 60 MΩ. To identify intracellular recorded neurons by their morphology, I iontophoretically stained the neurons with dTR or FITC by applying trains of rectangular pulses (1 nA, 500 ms, 1 Hz) for at least 15 minutes and kept the preparations overnight at 7° C to allow dye diffusion.
The extracellularly recordings were amplified (1000 x) and filtered (300 - 2000 Hz) using an
extracellular amplifier (Model 102, Electronic Lab). Intracellular signals were amplified (10 x) using a SEC 05X amplifier (npi Electronics Instruments, Tamm, Germany). All recordings were digitized by an A / D converter (Digidata 1440A, Molecular Devices or Micro1401 mkII, Cam- bridge Electronic Design) with a sampling frequency of 10 kHz, recorded on a computer (Dell, Round Rock, TX, USA) with Spike2 or pClamp software and saved for later analysis.
2.2.3 Drug application
If a stable expression of rhythmic motor output was required within an experiment, I used the cholinergic agonist carbachol (CCh, 1 - 5 µM) to activate an initially inactive preparation. CCh acts on both muscarinic and nicotinic acetylcholine receptors and elicits fictive locomotion of the swimmeret system [Braun and Mulloney, 1993]. For each preparation I gradually increased the CCh concentration until stable fictive locomotion was elicited, predominantly at 1 - 2 µM CCh. However, if the preparation was spontaneously active the experiment was performed in CS. In some experiments, I applied octopamine (OA, 1 - 100 µM, Alfa Aesar, Ward Hill, MA, USA), proctolin (PR, 1 µM, Alfa Aesar) and epinastine (10 µM, Sigma-Aldrich) to either test their effect on the spontaneous or CCh-induced rhythmic motor output directly, or to test if these substances are affecting the observed stimulation effects.
Drug solutions with the desired concentration were always prepared just prior to the experi- mental usage by diluting the stock solution in CS. Stock solutions of CCh (6 mM in CS) were stored in a freezer at - 20° C. Stock solutions of PR (147 µM) and Epinastine (10 mM) were prepared in aqua destillata (aq. dest) and stored in a fridge at 7° C. Due to the photoinstability of dissolved OA, it was kept as a solid at room temperature. Stock solutions of OA (20 mM in purified water) were stored in a fridge at 7° C and used not longer than five days.
In order to apply drugs to the entire abdominal nervous system, I used a custom-built, gravita-
tional perfusion system and replaced the bathing solution with the drug solution. At least 50 mL
were washed in to ensure that the desired drug concentration was reached. In addition, I used
a pressure ejection system (PDES-2DX, npi Electronics Instruments) to focally apply drugs to
the lateral neuropil of individual hemiganglia. Focal application was achieved using suction
electrodes (see chapter 2.2.1) with fine tip diameters as an application electrode. I filled the
application electrode with the drug solution by applying negative pressure, carefully inserted
the tip of the electrode into the neuronal tissue, and applied the drug solution by giving single
pulses of positive pressure (1 ms, 0.7 psi). For focal application experiments, Fast Green FCF
(Sigma-Aldrich) was added to visualize the extent of application (Figure 2.1 D).
2 Materials and Methods
2.3 Histological methods
2.3.1 Backfills of axon bundles
To identify the location of axons that were successfully stimulated or recorded, I performed backfills of the respective axon bundles. Therefore, I cut the nerve bundles at a maximal distal level, isolated the cut ends using petroleum jelly and briefly pre-incubated them in distilled water. Afterwards, I incubated the cut ends in dextran tetramethylrhodamine (TRDA, 1 % in aq.
dest., Life Technologies, CA, USA) or FITC (1 % in aq. dest.) for 48 - 96 h at 8° C. After fixation (see chapter 2.3.2), I removed the desired portions of the connectives, e.g. cA2/A3 or cA4/A5, and embedded tissue samples in agar-agar (4 % in 1 M PBS, Merck, Darmstadt, Germany). I prepared transversal cross sections (50 - 100 µM) using a vibratome (Leica VT1200 S, Leica Biosystems, Wetzlar, Germany) and transferred the sections to microscope slides for picture acquisition.
2.3.2 Histological development
In the following I describe the standardized histological development of abdominal ganglia with intracellular stained neurons (Chapter 2.2.2) or backfilled axon bundles (Chapter 2.3.1). If not mentioned differently, all steps were performed at room temperature (22 ° C). The protocol for antibody staining is separately described (Chapter 2.3.3). Due to the usage of photosensitive fluorescent dyes in this study, I performed all steps with a maximum protection from light.
After removal of the dyes, I washed the preparations three times with cold CS and fixed them in paraformaldehyde (PFA, 4 % in PBS, Serva, Heidelberg, Germany) at 4° C overnight or at room temperature for 2 hours on a shaker. Preparations were then washed in PBS (1 M), dehydrated in an ascending ethanol series (50 %, 70 %, 90 %, 100 %, 10 minutes each), transferred to a Permanox® Petri dish and cleared in methyl salicylate (Carl Roth, Karlsruhe, Germany) for picture acquisition.
2.3.3 Antibody staining
In order to investigate the distribution of proctolin (PR) within the abdominal nervous system, I
performed immunohistochemical stainings using primary antibodies against PR (anti-Proctolin,
raised in rabbit, Jena Bioscience, Jena, Germany). After fixation (see chapter 2.3.2), I preincu-
bated selected preparations in PBST-NGS (1 M PBS; + 1 % Triton-X-100, Fluka Chemie AG,
Buchs, Switzerland; + 5 % normal goat serum, Vector Laboratories, Burlingame, CA, USA;
+ 0.1 % sodium azide, Sigma-Aldrich) for 2 h. Afterwards, I applied the primary antibody (1 : 1000) and incubated at 4° C (2 x, 24 h each). After the preparations were washed in PBST- NGS (6 x, 1 h each), I applied the secondary antibody (1 : 200, donkey anti-rabbit conjugated to Alexa Fluor 488, Abcam plc, Cambridge, UK) and incubated again at 4° C (2 x, 24 h each).
Before picture acquisition, preparations were washed in PBS (3 x, 1 h each), dehydrated in an ascending ethanol series (50 %, 70 %, 90 %, 100 %, 10 minutes each) and cleared in methyl salicylate. In addition to taking pictures as whole mounts of abdominal ganglia, I also prepared transversal cross sections of the connectives (see chapter 2.3.1).
2.3.4 Picture acquisition
Pictures were acquired using a fluorescence microscope (BX61, Olympus, Hamburg, Ger-
many) or stereomicroscope (MVX10, Olympus). I took pictures of transversal cross sections of
the connectives within one plane. Whole mounts of abdominal ganglia were either pictured in
one plane or scanned as z-stacks (5 - 20 µm). Further processing was performed using Im-
ageJ (National Institutes of Health, USA), Adobe Photoshop (CS5, Adobe, San José, CA) and
CorelDRAW (X6, Corel, Ottawa, ON, Canada). Afterwards ganglia were rehydrated to 70 %
Ethanol and stored in a freezer at - 20° C.
2 Materials and Methods
2.4 Analysis
I removed stimulus artifacts caused by electrical stimulation using the ”ArtRem6” script for Spike2 (by Cambridge Electronic Design, www.ced.co.uk). If the stimulus signal was not recorded, I manually defined the stimulus artifacts within the extracellular recordings. If the stimulus signal was available for a given experiment, stimuli were defined by this. In both cases, an appropriate time range for each stimulus was cut out of the data [3 to 5 ms]. The gaps were filled with a straight line to ensure further data analysis. Afterwards, I analyzed the rhythm using the ”Crab-Analyzer” script (by Mark Beenhakker and Wolfgang Stein, www.neurobiologie.de) to calculate the burst on- and off-sets, period, burst durations, phases and duty cycles of the rhythm for each PS recording.
2.4.1 Parameters of the swimmeret rhythm
If fictive locomotion occurs spontaneously or is evoked by bath application of CCh [Braun and Mulloney, 1993] or PR [Mulloney et al., 1987; Acevedo et al., 1994], the two hemiganglia in each abdominal segment are simultaneously active (see chapter 1.2). Therefore, analyzing the parameters of the rhythm is sufficient for one side of the swimmeret system. However, for fictive locomotion evoked by unilateral stimulation of descending input, the parameters refer to PS activity recorded ipsilateral to the stimulation if not mentioned differently.
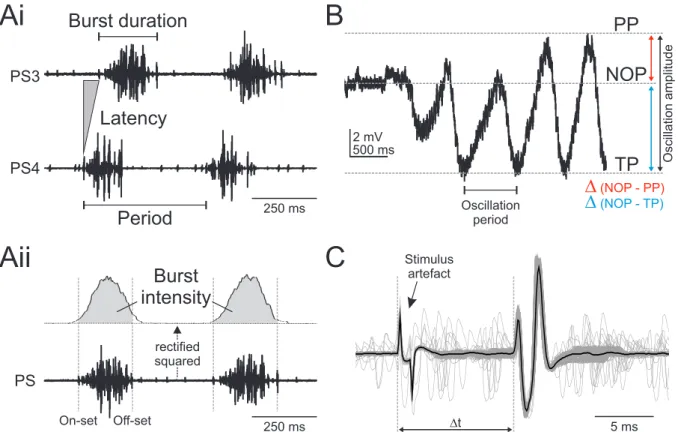
An overview about the analyzed parameter is shown in figure 2.2 Ai. On- and off-set are the beginning and the end of a single burst, respectively. The period, meaning the time span of one complete cycle, is defined by the time interval between the on-set of a PS burst and the on-set of a consecutive PS burst. The period was calculated using the most posterior recorded PS. The burst duration is the time from the on-set to the off-set of each burst. The phase of one PS burst describes the percentage time points within the cycle at which the corresponding burst begins. The on-set of the PS burst in A5 is the reference for calculating the phases of the more anterior PS bursts. Phases are calculated by dividing the latency of a PS burst on-set by the period. As the phase reflects the percentage of the period at which a particular PS burst occurs within the whole cycle, the duty cycle shows how much percent of a period is captured by the activity of a PS burst. It is calculated by dividing the burst duration by the period.
The strengths of individual PS bursts were analyzed by calculating the integral under a digital
filtered PS recording as described by Mulloney [2005]. Baseline drifts were removed (DC re-
moval) and the voltages were squared (rectification). Afterwards the recordings were smoothed
to ensure proper measurement of the underlying integral (Figure 2.2 Aii). The calculated inte- grals were divided by the respective burst duration and normalized to the mean within one experiment.
Ai
PS4 PS3
Latency
Period
Burst duration B
250 ms
Aii
PS
Burst intensity
rectified squared
500 ms 2 mV
PP
TP NOP
∆
(NOP - TP)∆
(NOP - PP)Oscillation amplitude
Oscillation period
C
250 ms
On-set Off-set ∆t 5 ms
Stimulus artefact