Analyzing synergistic and non-synergistic interactions in signalling pathways using Boolean Nested Effect Models
Martin Pirkl
1∗, Elisabeth Hand
2, Dieter Kube
2and Rainer Spang
1∗1Statistical Bioinformatics Department, Institute of Functional Genomics, University of Regensburg, 93053 Regensburg
2Department of Haematology and Oncology, University Medical Centre of the Georg-August University of G ¨ottingen, 37073 G ¨ottingen
ABSTRACT
Motivation: Understanding the structure and interplay of cellular signalling pathways is one of the great challenges in molecular biology. Boolean Networks can infer signalling networks from observations of protein activation. In situations where it is difficult to assess protein activation directly, Nested Effect Models are an alternative. They derive the network structure indirectly from downstream effects of pathway perturbations. To date, Nested Effect Models cannot resolve signalling details like the formation of signalling complexes or the activation of proteins by multiple alternative input signals. Here we introduce Boolean Nested Effect Models (B-NEM). B-NEMs combine the use of downstream effects with the higher resolution of signalling pathway structures in Boolean Networks.
Results:We show that B-NEMs accurately reconstruct signal flows in simulated data. Using B-NEM we then resolve BCR signalling via PI3K and TAK1 kinases in BL2 lymphoma cell lines.
Availability: R code is available at https://github.com/MartinFXP/B- NEM (github). The BCR signalling dataset is available at the GEO database (http://www.ncbi.nlm.nih.gov/geo/) through accession number GSE68761.
Contact:Martin-Franz-Xaver.Pirkl@ukr.de, Rainer.Spang@ukr.de Supplementary information:Supplementary data are available at Bioinformatics online.
1 INTRODUCTION
Cells process input signals to output signals using a network of cellular signalling pathways. For example, a small molecule binds a membrane receptor. The signal is brought into the cell via structural modification of the receptor. A set of kinases and other signalling molecules propagate the signal through the cytosol. This involves both activation and repression of proteins. Often complexes of multiple proteins must form before a signal propagates. Some of the molecules are also part of different pathways linking multiple pathways together. Eventually, the signal enters the nucleus where transcription factors and chromatin remodelling enzymes become activated. Finally, the combination of activated transcription factors and regulatory co-factors leads to the transcription of a large set of genes changing the phenotype of the cell. Understanding the structure and the interplay of pathways is crucial both for understanding the cellular mechanism and for designing novel
∗to whom correspondence should be addressed
therapies that target specific pathways.
Inferring networks from molecular profiles is a well developed field in bioinformatics. Transcriptional data can be generated more easily compared to protein activation data. Consequently, many algorithms were developed that focus on the reconstruction of regulatory networks. E.g. Gaussian graphical models (GGM) (Sch¨afer &
Strimmer, 2005), Bayesian networks (Friedman et al. , 2000), the PC-algorithm (Kalisch & B¨uhlmann, 2007) or the Algorithm for the Reconstruction of Accurate Cellular Networks (ARACNE, Margolinet al., 2006). All these methods use observational gene expression data to construct regulatory networks based on different association scores between genes.
It is no problem to quantify the expression of any gene using standard methods like qPCR, microarrays, or RNAseq.
Observing signalling networks is more complicated. Protein activation can operate on the levels of protein expression, cellular protein localization, or protein modifications like phosphorylation, ubiquitination etc. While there are assays to assess activation on any of these levels, those assays are more elaborate, more expensive and less generic. Moreover, for every protein a priori information on which type of modification mediates signal transduction is necessary.
Molecular biologists have been inferring pathways without formal computations for many years. Typically functional/interventional data is used. Pathways are perturbed by activation or inhibition of genes and the consequences of the interventions are observed, organized and interpreted. Also a range of algorithms have been described that formalise these types of arguments and make them accessible to bigger and more complex pathway models.
Sachs et al. , 2005 use flow cytometry data from perturbation experiments to infer protein signalling pathways with a Bayesian network approach. They test for conditional independence between proteins’ states using protein inhibition experiments and direct measurement of these states.
Markowetzet al., 2005 introduced Nested Effects Models (NEM) (Markowetz et al., 2007; Froehlich et al. , 2011; Niederberger et al., 2012). NEMs infer non-transcriptional signalling pathways by transcriptional downstream effects of pathway perturbation. A pathway is activated in a set of cellular assays where specific pathway components are silenced. The silencing of a specific component blocks the flow of information in a specific branch of the pathway. As a consequence, genes that normally change expression in response to the stimulus no longer react in inhibition assays.
NEMs infer the pathway structure from the nesting of these sets:
if the effected genes of perturbing gene B are a noisy subset of the effected genes of gene A, then A is upstream of B. This concept has been extended to time series data (Anchanget al., 2009; Froehlich et al., 2011; D¨umckeet al., 2014), evolving networks (Wanget al.,
1 Associate Editor: Dr. Jonathan Wren
© The Author(s) 2015. Published by Oxford University Press.
Bioinformatics Advance Access published November 17, 2015
at Universitaetsbibliothek Regensburg on November 27, 2015http://bioinformatics.oxfordjournals.org/Downloaded from
et al. , 2011). However they cannot model the role of complex formation in signalling pathways. If a protein X is activated by a complex, all members of the complex must be present and in the correct activation state. The proteins in the complex operate concertedly and are linked to X by an AND gate. In another scenario, X can be activated independently by several proteins.
In this case the proteins are linked by an OR gate. Boolean Networks (Kauffman, 1969) model logical gates. They have been used to simulate signalling pathways (Klamtet al., 2007) and to reconstruct them from interventional data (Saez-Rodriguezet al., 2009). Allowing for logical gates leads to identifiability problems of network structures. To resolve this ambiguities, prior knowledge on the pathway structures is used. Saez-Rodriguezet al., 2009 describe an algorithm called CellNetOptimizer (CNO) to construct signalling pathways from directly observed activation states of proteins in the Boolean Network framework. They combine prior knowledge networks, with protein phosphorylation data form interventional assays.
Here we describe Boolean Nested Effect Models (B-NEM). This method combines advantages from Boolean Network Models and Nested Effect Models. Like Boolean Networks B-NEMs distinguish between the alternative and cooperative activation of a protein, and like normal NEMs, B-NEMs do not need direct observations of protein activity. Moreover, B-NEMs can use data from assays where several pathway genes are perturbed simultaneously. In the following, we will describe the model formalism and define a pathway score together with a genetic algorithm to search for high scoring networks. We will then validate our algorithm on simulated data and use it to analyse B-cell receptor (BCR) signalling in lymphoma cells.
2 BOOLEAN NESTED EFFECTS MODELS 2.1 Pathway model and score
Signalling Pathways and Deterministic Boolean Networks Molecular signalling pathways can be described as Deterministic Boolean Networks (Saez-Rodriguezet al., 2009). Networks are encoded as directed acyclic hyper-graphsΨ = (S, H)consisting of a set of nodesS= (S1, . . . , SN) and a set of Hyper-edgesH = (H1, . . . HM). Every nodeSirepresents a signalling protein that can be either active (Si= 1) or inactive (Si = 0).
Hyper-edges describe how the signal is propagated through the network.
Every directed hyper-edgeHjconnects one or more parent nodes with a single child node. Hyper-edges with one parent node specify whether the child is activated or repressed by its parent. Hyper-edges with more parents specify a unique activation pattern of the parent nodes that is required for activating the child. If a node has multiple incoming hyper-edges, it can be independently activated by all of them. Hence, every hyper-edge with more then one parent node encodes an AND gate and multiple hyper-edges with the same child form OR gates (Figure 1). Signalling pathways form AND gates, if multiple proteins need to be jointly activated to propagate the signal to their target molecule. This is often associated with the formation of larger protein complexes. OR gates in contrast occur when signalling is organized in a redundant manner. As with Bayesian networks and nested effects models, we assume that the real graph is acyclic. This limits the scope of the method to models of signalling pathways in which the signal is propagated from receptors via branching cytosolic effector pathways into the nucleus without feedback loops.
D(k)is hence associated with a specific experimental conditionC(k)that specifies which receptors were stimulated and which signalling genes were inhibited. This is the typical experimental set-up of Nested Effect Models (NEM) (Markowetzet al., 2005, 2007). Following the NEM literature, we call the signalling pathway componentsS1, . . . SnS-Genes and the genes that show expression changes in response to perturbations E-Genes. S-genes and E-genes can but need not overlap.
Expected and Observed Response Schemes For a given hyper-graph Ψ and a given condition C(k), we can calculate the activation states of all nodes inΨas follows: (1) root nodes are initialized to zero, (2) stimulated nodes are set to 1 and inhibited nodes are set to 0 independently of any incoming signals from parent nodes, (3) all other nodes are determined by propagating activation states through the directed acyclic graph using the Boolean functions defined by the hyper-edges ofΨ. Let C = (C(1), ..., C(K))be the set of all experimental conditions, and A⊂C×Ca set of comparisons between pairs of conditions. For every pair of conditionsi = (C(k), C(l))∈Awe can determine, whether the expected activation of an S-gene is identical under both conditions or not.
We setΦij= 0, if the predicted state ofSjis identical underCkandCl. We setΦij = 1, ifSjwas switched on, i.e if it is inactive underCkbut active underCland we setΦij=−1, ifSjwas switched off. We callΦ the Expected S-gene Response Scheme (ERS) ofΨ(Figure 1, middle).
Analogously, we organize the observed E-gene responses. For a given E- geneEj, let∆i,jbe the expression change ofEjin comparisoni. We call
∆the Observed E-gene Response Scheme (ORS).
Scoring hyper-graphs For a given hyper-graphΨ, we want to score how well its expected S-gene responsesΦmatch the observed E-gene responses
∆. This cannot be done directly, becauseΦrefers to activation states of S-genes, while∆refers to downstream effects in E-genes. Following the nested effect model literature (Markowetzet al., 2005; Tresch & Markowetz, 2008), we assign E-genes to S-genes. For every E-geneEwe search for the S-geneS∗(E)for which the expected S-gene responsesΦ(S)matches observed E-gene responses∆(E)best. We quantify this match by the absolute value of the rank correlation between expected S-gene and the observed E-gene responses. Finally, we score the hyper-graph by balancing its data fit with its size:
L(Ψ) = 1 m·∑
E
|ρ(Φ(S∗(E)),∆(E))| −ζ· 1 M · ∑
H∈Ψ
#pa(H) (1)
The first sum runs over all E-genes and the second sum runs over all hyper- edges inΨ. ρ(x, y)is the rank correlation of xandy,#pa(H)is the number of parent nodes of hyper-edgeH.ζ >0is a parameter to calibrate the penalty for network size. The network size penalty is identical to that used in Saez-Rodriguezet al., 2009.mis the number of E-genes used in the score andMis the maximal network size possible. This way the score normalizes to[0,1]and the size penalty to[0, ζ]. This makesζindependent of the number of E-genes or the overall size of the fully connected network.
2.2 Restricting the search space using prior knowledge
Like Bayesian networks and standard NEMs, also B-NEMs are affected by likelihood/score equivalence. It is possible that two different networks have the same expected S-gene response schemeΦ. If in addition the networks have identical size, they yield identical scores no matter what the data looks like. If not the smaller network is chosen. Note thatΦdepends on the design of the set of perturbation assaysC. Two networks can be distinguished by one experimental design but not by another. Figure 2 gives an example, how
at Universitaetsbibliothek Regensburg on November 27, 2015http://bioinformatics.oxfordjournals.org/Downloaded from
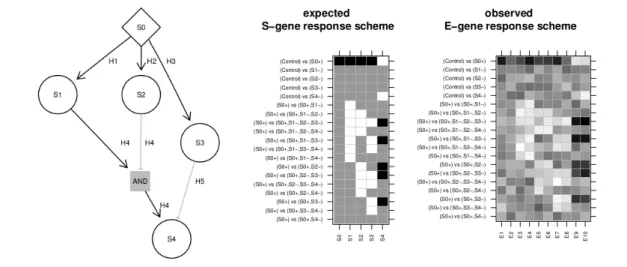
Fig. 1. Hyper-graphs and their response schemesThe two matrices are an expected S-gene response scheme of the S-genes and a hypothetical noisy continuous observed E-gene response scheme of attached E-genes for the hyper-graph left. Black matrix entries indicate up-regulation (+1), white down- regulation (-1) and gray no change (0). Each column is a response scheme of an S-gene respectively E-gene. The rows are comparisons between two conditions.
In a condition+denotes the activation of the S-gene and−the inhibition independent of the state of the parents. The set of modelled comparisons is restricted to the typical design of a nested effect model. Included are comparisons of stimulation vs. control and stimulations + inhibitions vs. stimulations only. S0 is a receptor that can be activated. The other S-genes propagate the signal and can be inhibited. The edgeH4is an AND gate with two parents. S4 is activated by H4, if S1 is active and S2 inactive. Alternatively, the inhibition of S3 can activate S4. HenceH4andH5implicitly form an OR gate.
the design can (a) affect score equivalence classes and (b) affect the optimal scoring network. Interestingly we need an experiment involving only S3 during stimulation of S0 to correctly identify the signalling logic of S4.
If the data can not distinguish between competing networks it is still possible that existing domain knowledge can. Like Saez-Rodriguezet al., 2009 we represent pathway knowledge by a priori restrictions of the network search space. With this restrictions we do not only reduce network ambiguity due to score equivalence, but also ensure that the constructed networks follow general conventions of modelling signalling pathways (e.g. the signal is propagated from receptors, via cytosolic molecules to nuclear factors). We encode prior knowledge by a directed graphGwhose edges are a collection of all links between S-genes that are a priori possible. In other words, it is the missing edges ofGthat define the search space restriction. We refer toG as a Prior Knowledge Network (PKN). PKNs are then extended to a Boolean network by adding hyper-edges such that all Boolean functions allowed in G are a priori possible. Hence, while B-NEMs use help from prior knowledge to estimate the network structure they infer logical gates only from data.
Using prior knowledge can resolve score equivalence problems, but there is no guarantee that it always does.
2.3 Network search
The size of the space of hyper-graphs that needs to be searched is2n, where nis the number of hyper-edges in the extended PKN. Even for small PKN an exhaustive search is hence impractical. Here we use a genetic algorithm (Saez-Rodriguez et al., 2009) involving tournament selection (Sokolov
& Whitley, 2005) and complementary insertion (Louis & Rawlins, 1992) Details are given in the supplement, section 1.
Running time of the GA can be a limiting factor. It is determined by the size of the search space. The more hyper-edges we exclude a priori, the smaller the search space and the faster algorithm. Forn= 504our algorithm runs less than10hours on an Intel(R) Xeon(R) CPU E5-4620 0 @ 2.20GHz.
We now describe a generic way to construct PKNs that effectively reduce the search space using prior knowledge that is often readily available. We first limit the size of AND gates to two incoming nodes then we assign S- genes uniformly to five hierarchical layers: stimuli, receptors, membrane complexes, cytosolic signalling and nuclear signalling. Then we assume that
Fig. 2. Network equivalence and experimental designs The response schemes of the two network differ only for the experiment marked by the arrow. If that experiment was missing the response schemes would be identical and the left network would score higher due to its smaller size no matter what the data looks like.
it is known whether a gene is an activator or a repressor. We then exclude a priori all edges that span more then two adjacent layers. This restricts the
at Universitaetsbibliothek Regensburg on November 27, 2015http://bioinformatics.oxfordjournals.org/Downloaded from
3 SIMULATIONS
Before applying B-NEM in practice we check whether the algorithm can reconstruct networks accurately, if the data is generated from known Boolean networks. We refer to underlying data generating networks as Ground Truth Networks (GTN). GTNs and matching PKNs are generated by randomly sampling edges from a super PKN shown in the supplement, figure S3. The super PKN has30 nodes and144edges respectively504hyper-edges after extension.
The nodes fall onto five layers representing ligands, receptors, membrane complexes, cytosolic and nuclear signalling. Edges connect nodes on adjacent layers. 90% of edges are stimulating and 10% are inhibiting. We first draw a PKN and then a GTN.
To generate a network ofnnodes we randomly choose nnodes from the super PKN, ensuring that their is at least one node at every layer. For this set ofnnodes we take all hyper-edges connecting those nodes as the extended PKN. From this PKN we randomly sample50%hyper-edges, but make sure that the network is at one point stimulated. This means we reject GTNs which do not change their state during any stimulation. Similarly we generate networks ofnhyper-edges. Without restricting the GTN to a specific number of nodes. Finally10E-genes were attached to every S-gene. Note that the PKN is always consistent with the GTN, no existing edges are a priori excluded. For a given GTN and a set of conditions we calculated the E-gene response scheme and added Gaussian noise∼ N(0, σ)withσ ∈ {0.5,1,2}. Every E-gene profile was generated in triplicates with independent noise. The experimental conditions consist of controls, single and double stimulations, single inhibitions and the single/double stimulations together with single inhibitions. Finally, observed E-gene response schemes were composed by the differences between controls and single/double stimulations/inhibitions and the differences between single/double stimulation and single/double stimulation with a single inhibition.
3.1 B-NEM accurately estimate the equivalence class of networks with up to 30 S-genes.
We first tested the performance of B-NEM for GTNs with 10,15,20,25 and 30 S-genes. For each size we generated 10 random GTNs and matching PKNs and run B-NEM on E-gene data generated from these GTNs. The GTNs consisted of10% of the allowed edges in the corresponding PKN, hence the PKNs were consistent with the GTN and effectively reduce the search space.
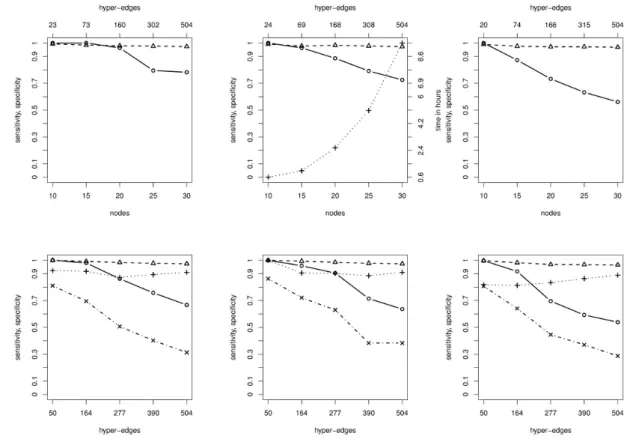
We then compared the expected S-gene response schemes of the estimated networks with that of the GTNs. Figure 3, top shows the sensitivity and specificity of the estimated networks (solid circle, dashed triangle). The corresponding computation time is shown as the dotted line connecting crosses. In this setting computation is a limiting factor for networks with 30genes, but reconstruction accuracy is not.
3.2 Network reconstruction is sensitive to the strength of the prior knowledge network.
In the previous simulation we checked whether the algorithm finds the correct equivalence class of networks. However, equivalence
as a function of the strength of the PKN. For10random GTNs with50hyper-edges drawn randomly from the full PKN, we run B-NEM using PKNs of 50,164,277,390,504 a priori possible hyper-edges. Figure 3, bottom shows the sensitivity and specificity of the reconstructed networks both on the level of expected S-gene response schemes and the actual networks. While the performance stays very good with respect to response schemes (equivalence classes) it breaks down with respect to network reconstruction if the PKN becomes weak.
If we do not allow for negative regulation, the PKN needn’t be a DAG but can have cycles. Cycles in a PKN with negative regulation can lead to undefined expected S-gene response schemes. See supplement section 2 for details.
4 MODELLING B-CELL SIGNALLING
We now apply the B-NEM framework to a previously unpublished dataset monitoring gene expression changes in the Burkitt lymphoma cell line BL2 after induction of the B-cell receptor (BCR). Our analysis explains how BCR signalling propagates to downstream effector pathways like the NFκB, MAP kinase, P38, or JNK pathways through activation of the intermediate messengers TAK1 and PI3K.
B-cell receptor signalling was induced in BL2 cells by cross- linking IgM with an anti-IgM antibody. S-genes were inhibited on protein level using small molecules: 5Z-7-oxozeaenol (TAK1), IKK2 inhibitor VIII (IKK2), Ly294002 (PI3K), SB203580 (P38/MAPK14), SP600125 (JNK), U0126 (ERK1/2). In addition to single inhibitions, IKK2, JNK and P38 were jointly inhibited yielding three double and one triple inhibition. All inhibitions were done in triplicate both under BCR stimulation and control conditions and gene expression profiles were generated using Affymetrix hgu133plus2 Genechips. Moreover, profiles of 6 negative controls (unstimulated BL2 cells) and 6 positive controls (BCR stimulated cells) were produced, yielding a dataset of 72 gene expression profiles in total. The dataset was made available at the GEO database under GSE68761.
The raw data was normalized (see supplement, section 3) and observed E-gene response schemes were calculated for the comparisons listed in table 1. We filtered for E-genes that respond to BCR stimulation by at least an absolute log2 foldchange of1and to another comparison by at least an absolute log2 foldchange of log2(1.5)≈0.58. This corresponds to a change in expression of at least100%respectively50%, leaving us with602E-genes and their continuous observed E-gene response scheme.
4.1 Prior knowledge in BCR signalling
The B-cell receptor (BCR) is the cell surface receptor that initiates BCR signalling upon binding of an antigen. BCR signalling leads to the activation of IKK2, P38, ERK, and JNK (DeFranco, 1997;
Richardset al., 2001; Schumanet al., 2009; Shinohara & Kurosaki, 2009). These four effector pathways send signals into the nucleus that affect gene expression. The two proteins PI3K and TAK1 are
at Universitaetsbibliothek Regensburg on November 27, 2015http://bioinformatics.oxfordjournals.org/Downloaded from
Fig. 3. Simulation resultsFrom left to right we setσ = 0.5,1,2in each column respectively.Top:Random GTN ofnnodes (x-axis) and the median sensitivity, specificity of the ERS (solid circle, dashed triangle) and running time (dotted cross) for ten runs. The top axis shows the mean PKN size.Bottom:
Results for ten runs each given a fixed GTN and different PKN sizes (x-axis) including the GTN. Median sensitivity and specificity of the ERS (solid circle, dashed triangle) and the hyper-edges (dotted cross, dashed-dotted x).
base level change level (control) vs (BCR+) (BCR+) vs (BCR+,PI3K-) (BCR+) vs (BCR+,TAK1-) (BCR+) vs (BCR+,ERK-) (BCR+) vs (BCR+,IKK2-) (BCR+) vs (BCR+,P38-) (BCR+) vs (BCR+,JNK-) (BCR+) vs (BCR+,IKK2-,P38-) (BCR+) vs (BCR+,IKK2-,JNK-) (BCR+) vs (BCR+,P38-,JNK-) (BCR+) vs (BCR+,IKK2-,P38-,JNK-)
Table 1. Contrasts of conditions used to calculate the observed E-gene response schemes from the data.+denotes activation of the node and− inhibition in that particular condition.
potential mediators of BCR induced activation of effector pathways.
We do not put any restriction on the hierarchical ordering of PI3K and TAK1. PI3K and TAK1 are parts of several other pathways where they are described as activators and not as repressor of signalling. We thus assume that the same holds true in BCR induced signalling. What is not known is which activations depend on which of the two mediators, nor is it known whether they activate downstream pathways independently from each other (OR gate) or
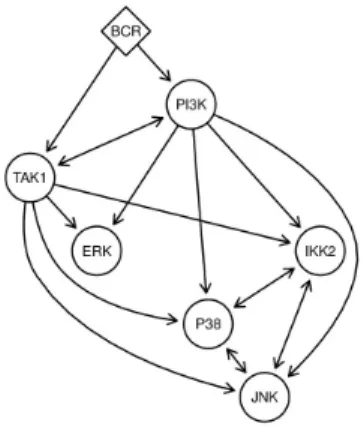
jointly (AND gate). Furthermore the combinatorial inhibitions of IKK2, P38 and JNK allow more freedom in the PKN and therefore we do a complete reconstruction on this subnetwork. We summarize this prior knowledge situation in the PKN of Figure 4.
4.2 Calibrating the sparseness parameterζ
Calibratingζis critical to the performance of B-NEM. We randomly split the set of E-genes in half. For various settings ofζ(exponential decrease ζ ∈ {
1,0.64,0.36,0.16,0.04,10−10,0}
) we learn a network using the first half of the data (training set), and then score this network using the second independent half (test set) but without employing the complexity penalty in equation (1). We repeat this step with100different random splits of E-genes and take the mean of graph size, connected S-genes (both in percent) and scores of the test sets. Figure 5 shows that the score continuously improves asζ approaches zero. Forζ= 0the test accuracy drops again. Note that for any positive zeta the smaller network wins in case of likelihood equivalence while forζ= 0there is no size penalty operating at all.
We thus setζto10−10.
4.3 The role of PI3K and TAK1
We run B-NEM on this data using the PKN and the parameter settings described above. Figure 6 shows the highest scoring network. The network predicts that the activation of the JNK pathway is only PI3K dependent, while Erk is only TAK1
at Universitaetsbibliothek Regensburg on November 27, 2015http://bioinformatics.oxfordjournals.org/Downloaded from
BCR defines the top S-gene. PI3K and TAK1 build the second hierarchical layer but we additionally allow for TAK1 above PI3K or the reverse. The third layer consists of IKK2, P38, JNK and ERK. Since our combinatorial inhibitions reduce the problem of equivalence classes for IKK2, P38 and JNK we allow for the complete reconstruction of the sub network consisting of these three S-genes.
Fig. 5.ζcalibrationMean cross validated network scores as a function of the complexity parameterζ. Score on the test dataset (solid circle, log-scale) and graph size in percent (dashed triangle).
dependent. IKK2 activation is predicted either as redundant by PI3K or alternatively TAK1. P38 is positively regulated by PI3K via either JNK or alternatively jointly with IKK2. The signalflow to P38 can be stopped either with the inhibition of PI3K or the double inhibition of JNK and IKK2. The observed E-gene response schemes side by side with the corresponding expected S-gene response schemes can be seen in supplementary figures S5-S11.
That TAK1 alone, as proposed by our model, can not block signalling into IKK2 and JNK has been detected for toll-like receptor 8 (TLR8) signalling in mouse embryonic fibroblasts (MEF, Qinet al., 2006). TAK1 knock-out mice still showed an activated NFκB pathway. TLR8 also seems to be causative in some lymphomas (Ngo Vu N.et al., 2011). Furthermore Mattaet al., 2012 show that herpes virus encoded viral FLICE inhibitory protein (vFLIP) K13 inducted NFκB activity is not impaired in TAK1 deficient MEFs. Chen & Debnath, 2013 give evidence that the IKK
Fig. 6. Learned networkThe highest scoring network (black edges). The BCR signal is propagated via PI3K into JNK and P38. IKK2 is alternatively regulated by PI3K or TAK1. PI3K and TAK1 are directly regulated by BCR. TAK1 propagates the signal into the ERK pathway. Additionally P38 is alternatively regulated by JNK or IKK2. The different AND and OR gates are annotated more prominently. Grey dashed edges illustrate the propagation of signals from all molecules into the nucleus to regulate transcription.
complex (IKK1, IKK2, NEMO) acts independently of PI3K in mammary epithelial cells and Xueet al., 2000 that ERK can be activated independently from PI3K in nerve growth factor (NGF)- dependent sympathetic neurons. Kloo et al. , 2011 propose the regulation of IKK2 by PI3K in diffuse large B-Cell like lymphomas.
They show in their data, that the PI3K inhibitor only partially blocks IKK2 inhibitor target genes I.e. downstream targets of PI3K are a subset of downstream targets of IKK2, which is not true in our case. In the Nested Effects Model logic this either places PI3K downstream of IKK2 or PI3K and IKK2 have joint downstream targets. A third explanation is, that some NFκB activity is regulated by PI3K, but another alternative regulation is possible as depicted in our network in figure 6.
As a comparison we applied the original NEM to the data (supplement section 4).
5 DISCUSSION
We have introduced B-NEM a novel method to infer signalling network structures. B-NEM extends the framework of standard nested effect models. Standard models infer upstream/downstream relations of signalling genes. B-NEMs in addition resolve the Boolean logic of signal propagation. They distinguishing between the independent activation of a protein by multiple upstream proteins and the joint activation by a complex formed from the upstream proteins. Moreover, B-NEMs distinguish between activating and inhibiting interactions. Due to identifiability problems associated with the estimation of Boolean networks, B- NEM modelling must build on strong prior assumptions on the network structure. Networks cannot be constructed from scratch, but unknown features of existing networks can be resolved. We demonstrated this idea by resolving the role of PI3K and TAK1
at Universitaetsbibliothek Regensburg on November 27, 2015http://bioinformatics.oxfordjournals.org/
as mediators of BCR signalling. In our cancer derived cell lines signalling was perturbed. Such cancer derived changes in signalling mechanisms can be further characterised in a comparative B-NEM analysis of signalling in primary healthy cells and tumor derived cell lines.
B-NEM exploits combinatorial perturbations of multiple genes.
Since it is in general not feasible to perform all possible combinations, a subset needs to be chosen. We suggest an iterative procedure. First a B-NEM is learned from single gene perturbations.
In case high scoring networks are incoherent with respect to an important pathway feature, one can simulate combinatorial perturbation data from these high scoring networks aiming at identifying those combinations that resolve the incoherence.
In simulations we showed that B-NEMs identify the correct score equivalence class of a signalling pathway with high accuracy.
Identifying the correct signalling topology is harder. The most critical step here is the use of prior knowledge. We implement prior knowledge by excluding hyper-edges. A full Bayesian framework allows using softer priors that specify prior distributions on the full space of network topologies. However, for large networks these are not practical with B-NEM because a reduction of the search space is needed for computational reasons. The a priori restriction of the search space is needed for at least three independent reasons.
First, the search space needs to be reduced in order to achieve practical running times of the algorithm. Second, together with the regularizing penalty for overly complex networks the PKN is used to limit over-fitting. Third, PKNs limit network ambiguities due to score equivalence of multiple networks. Fortunately, these goals are not opposing. The stronger the prior assumptions, the faster the algorithm, the less over-fitting we have, and the fewer the ambiguities due to score equivalence. On the other side, incorrect a priori assumptions can be disastrous as well. They lead to biased and under-fitted network models. Therefore one must find a good balance between belief in prior knowledge from literature and the data.
Funding: This work was supported by the Bavarian Research Network for Molecular Biosystems (BioSysNet).
conflict of interest: none declared.
REFERENCES
Anchang, Benedict, Sadeh, Mohammad J, Jacob, Juby, Tresch, Achim, Vlad, Marcel O, Oefner, Peter J, & Spang, Rainer. 2009. Modeling the temporal interplay of molecular signaling and gene expression by using dynamic nested effects models.
Proc Natl Acad Sci U S A,106(16), 6447–6452.
Chen, Nan, & Debnath, Jayanta. 2013. IB kinase complex (IKK) triggers detachment- induced autophagy in mammary epithelial cells independently of the PI3K-AKT- MTORC1 pathway.Autophagy,9(8), 1214–1227.
DeFranco, Anthony L. 1997. The complexity of signaling pathways activated by the BCR.Current Opinion in Immunology,9(3), 296 – 308.
D¨umcke, Sebastian, Br¨auer, Johannes, Anchang, Benedict, Spang, Rainer, Beerenwinkel, Niko, & Tresch, Achim. 2014. Exact likelihood computation in Boolean networks with probabilistic time delays, and its application in signal network reconstruction.Bioinformatics,30(Feb), 414–419.
Friedman, N., Linial, M., Nachman, I., & Pe’er, D. 2000. Using Bayesian networks to analyze expression data.J Comput Biol,7(Jan), 601–620.
Froehlich, Holger, Praveen, Paurush, & Tresch, Achim. 2011. Fast and efficient dynamic nested effects models.Bioinformatics,27(2), 238–244.
Kalisch, Markus, & B¨uhlmann, Peter. 2007. Estimating High-Dimensional Directed Acyclic Graphs with the PC-Algorithm.J. Mach. Learn. Res.,8(May), 613–636.
Kauffman, S. A. 1969. Metabolic stability and epigenesis in randomly constructed genetic nets.J Theor Biol,22(3), 437–467.
Klamt, Steffen, Saez-Rodriguez, Julio, & Gilles, Ernst D. 2007. Structural and functional analysis of cellular networks with CellNetAnalyzer.BMC Syst Biol,1, 2.
Kloo, Bernhard, Nagel, Daniel, Pfeifer, Matthias, Grau, Michael, Dwel, Michael, Vincendeau, Michelle, Drken, Bernd, Lenz, Peter, Lenz, Georg, & Krappmann, Daniel. 2011. Critical role of PI3K signaling for NF-Bdependent survival in a subset of activated B-celllike diffuse large B-cell lymphoma cells.Proceedings of the National Academy of Sciences,108(1), 272–277.
Louis, Sushil J., & Rawlins, Gregory J. E. 1992. Predicting Convergence Time for Genetic Algorithms. Pages 141–161 of: Foundations of Genetic Algorithms 2.
Morgan Kaufmann.
Margolin, Adam A., Nemenman, Ilya, Basso, Katia, Wiggins, Chris, Stolovitzky, Gustavo, Dalla Favera, Riccardo, & Califano, Andrea. 2006. ARACNE: an algorithm for the reconstruction of gene regulatory networks in a mammalian cellular context.BMC Bioinformatics,7 Suppl 1, S7.
Markowetz, Florian, Bloch, Jacques, & Spang, Rainer. 2005. Non-transcriptional pathway features reconstructed from secondary effects of RNA interference.
Bioinformatics,21(21), 4026–4032.
Markowetz, Florian, Kostka, Dennis, Troyanskaya, Olga G, & Spang, Rainer. 2007.
Nested effects models for high-dimensional phenotyping screens. Bioinformatics, 23(13), i305–i312.
Matta, Hittu, Gopalakrishnan, Ramakrishnan, Graham, Ciaren, Tolani, Bhairavi, Khanna, Akshat, Yi, Han, Suo, Yulan, & Chaudhary, Preet M. 2012. Kaposis Sarcoma Associated Herpesvirus Encoded Viral FLICE Inhibitory Protein K13 Activates NF-B Pathway Independent of TRAF6, TAK1 and LUBAC.PLoS ONE, 7(5), e36601.
Ngo Vu N., Young Ryan M., Schmitz Roland, Jhavar Sameer, Xiao Wenming, Lim Kian-Huat, Kohlhammer Holger, Xu Weihong, Yang Yandan, Zhao Hong, Shaffer Arthur L., Romesser Paul, Wright George, Powell John, Rosenwald Andreas, Muller-Hermelink Hans Konrad, Ott German, Gascoyne Randy D., Connors Joseph M., Rimsza Lisa M., Campo Elias, Jaffe Elaine S., Delabie Jan, Smeland Erlend B., Fisher Richard I., Braziel Rita M., Tubbs Raymond R., Cook J. R., Weisenburger Denny D., Chan Wing C., & Staudt Louis M. 2011. Oncogenically active MYD88 mutations in human lymphoma.Nature,470(7332), 115–119. 10.1038/nature09671.
Niederberger, Theresa, Etzold, Stefanie, Lidschreiber, Michael, Maier, Kerstin C., Martin, Dietmar E., Froehlich, Holger, Cramer, Patrick, & Tresch, Achim. 2012.
MC EMiNEM maps the interaction landscape of the Mediator.PLoS Comput Biol, 8(6), e1002568.
Qin, Jinzhong, Yao, Jianhong, Cui, Grace, Xiao, Hui, Kim, Tae Whan, Fraczek, Jerzy, Wightman, Paul, Sato, Shintaro, Akira, Shizuo, Puel, Anne, Casanova, Jean- Laurent, Su, Bing, & Li, Xiaoxia. 2006. TLR8-mediated NF-B and JNK Activation Are TAK1-independent and MEKK3-dependent. Journal of Biological Chemistry, 281(30), 21013–21021.
Richards, James D., Dav, Shaival H., Chou, Chih-Hao G., Mamchak, Alusha A., &
DeFranco, Anthony L. 2001. Inhibition of the MEK/ERK Signaling Pathway Blocks a Subset of B Cell Responses to Antigen. The Journal of Immunology,166(6), 3855–3864.
Sachs, Karen, Perez, Omar, Pe’er, Dana, Lauffenburger, Douglas A., & Nolan, Garry P.
2005. Causal Protein-Signaling Networks Derived from Multiparameter Single-Cell Data.Science,308(5721), 523–529.
Sadeh, Mohammad Javad, Moffa, Giusi, & Spang, Rainer. 2013. Considering Unknown Unknowns - Reconstruction of Non-confoundable Causal Relations in Biological Networks.Pages 234–248 of: Proceedings of the 17th International Conference on Research in Computational Molecular Biology. RECOMB’13. Berlin, Heidelberg:
Springer-Verlag.
Saez-Rodriguez, Julio, Alexopoulos, Leonidas G, Epperlein, Jonathan, Samaga, Regina, Lauffenburger, Douglas A, Klamt, Steffen, & Sorger, Peter K. 2009.
Discrete logic modelling as a means to link protein signalling networks with functional analysis of mammalian signal transduction.Mol Syst Biol,5, 331.
Sch¨afer, Juliane, & Strimmer, Korbinian. 2005. An empirical Bayes approach to inferring large-scale gene association networks.Bioinformatics,21(6), 754–764.
Schuman, James, Chen, Yuhong, Podd, Andrew, Yu, Mei, Liu, Hong-Hsing, Wen, Renren, Chen, Zhijian J., & Wang, Demin. 2009. A critical role of TAK1 in B-cell receptor–mediated nuclear factor B activation.Blood,113(19), 4566–4574.
Shinohara, Hisaaki, & Kurosaki, Tomohiro. 2009. Comprehending the complex connection between PKC, TAK1, and IKK in BCR signaling. Immunological Reviews,232(1), 300–318.
Sokolov, Artem, & Whitley, Darrell. 2005. Unbiased Tournament Selection. Pages 1131–1138 of: Proceedings of the 2005 Conference on Genetic and Evolutionary Computation. GECCO ’05. New York, NY, USA: ACM.
at Universitaetsbibliothek Regensburg on November 27, 2015http://bioinformatics.oxfordjournals.org/Downloaded from
2014. Reconstructing evolving signalling networks by hidden Markov nested effects
at Universitaetsbibliothek Regensburg on November 27, 2015http://bioinformatics.oxfordjournals.org/Downloaded from