MICROW-A VE SPECTROSCOPY
w.
MAlERInstitut für Physikalische Chemie der Universität FreiburgfBr., Deutehe Bundesrepublik
INTRODUCTION
This paper is intended as a short survey of some special topics related to the progress in microwave spectroscopy during the years 1959 and 1960.
EXPERIMENTAL TECHNIQUE
Up to the present, the Stark modu1ation spectrometer is still the most widely used microwave spectrometer. There have been remarkab1e improve- mep.ts in this type of spectrometer in recent years, and other types of micro- wave spectrometers have been developed and tested. Before discussing the developments in experimental technique, it may be useful to give some ofthe requirements which must be met by a microwave spectrometer that is to be used for investigations in molecular physics.
Firstly, it should be noticed that there are two requirements which are incompatible in that both cannot be met to the full simultaneously: these are maximum sensitivity and maximum resolution. Fortunately, the Stark modulation spectrometer is an instrument which can realize both require- ments-though not at the same time. The instrument can be operated either at high power Ievel and high gas pressures to detect extremely weak lines with restricted resolution, or at low pressures and low power level, i.e.
with reduced sensitivity but with very high resolution. For extreme cases, however, the use of a special purpose spectrometer may be necessary.
The three properties which characterize the performance of a microwave spectrometer are:
(a) its sensitivity;
(b) its resolution;
(c) the accuracy ofthe line frequency determinations.
Let us consider each of these three characteristic qualities.
Sensitivity of a microwave spectrometer
The sensitivity of a spectrometer is of interest if one has to look for and measure very weak 1ines. In this case, one app1ies a gas pressure high enough to give the maximum value of the peak absorption coefficient for the transi- tion to be studied. I t is well-known that this maximum va1ue is reached when collision-broadening represents the overwhelming part of 1ine-broadening.
This ho1ds for gas pressures of about 30 p, of mercury and more. I t is, of course, useless to increase the pressure much beyond this critica1 value, because the result is only a greater line-width without any improvement in peak intensity. With gas pressures between about 20 and 100 f.L of mercury,
157
W. MAlER
the line-widths, L1v (half-width at half intensity), have values of several Mcfsec and the peak absorption is given according to the V an Vleck-Weißkopf theory by:
- 8n2v~f 12 !!_ -1
~peak - 3ckT
I
Jlii ~Jcm ] (1) where v0 = frequency of the line centre, J.Lii=
dipole matrix element of the transition, N =total number of molecules per cm3, andf =
fraction of molecules in the lower state of the transition.In the pressure region specified above,
Nf
Avis independent of pressure, but a function of the substance and the temperature. The sensitivity of a spectrometer (more exactly, the limit sensitivity) is usually defined hy"ccm im vi;:,. that value of ocpeak which gives a signal equal to the noise Ievel of the spectrometer. In practice, one determines experimentally the signal-to- noise ratio for a very weak line near the Iimit of detectability, and calculates
ocpeak for this line according to equation ( 1). This value ocpeak depends on the temperature to a marked degree, and this dependence is the source of some confusion in the literature. In order to ohtain the true value of the minimum detectable absorption coefficient, ocpeak should be calculated forthat tempera- ture at which the signal-to-noise ratio has been measured. It has become the custom, however, always to calculate ocpeak for T
=
300°K, even though the signal-to-noise ratio may have been measured at a different temperature.This somewhat confusing situation may be clarified in the following manner.
If one wishes to characterize the purely electrical performance ofthe spectro- meter, the true value of ocpeak must be given. If, however, the performance of the whole apparatus (including the effectiveness of the cooling system, etc.) is of interest, the calculated value at 300 °K may be used for comparison. In any case, the temperatures at which ocpeak has been observed and at which it has been calculated should be clearly stated.
As regards the power Ievel of the microwave radiation transmitted through the absorption cell for the detection of weak lines, powers of about I m W are used. U p to this value the signal caused by a given ocpeak is proportional to the power Ievel. Powers in excess of I m W would not improve the spectrometer sensitivity; this has been shown by investigations of the crystal detector properties. Radiation power of magnitude 1 m W in absorption cells of X-band or K-band dimensions would, it is true, cause considerable saturation broadening, and would, therefore, diminish ccpeak
if the line-width lay below about 0·2 Me/sec. With line-widths of several Mcfsec, as are necessarily used for the detection of extremely weak lines, the saturation has no detectable effect.
Finally, it should be mentioned that lengthening of the absorption cell enhances the sensitivity of the spectrometer for extremely weak lines. Of course, there is a Iimit: the wall Iosses of the absorption cell reduce the power Ievel transmitted by the cell. As soon as the power Ievel at the end of the cell falls considerably below the value entering the cell, a further increase in the length. of the cell leads to no advantage.
For the frequency region 10-40 kMc/sec, one can say that a microwave spectrometer of good performance has a sensitivitiy of ocmin
=
I0-9-I0-10 cm-1, the better value holdingfor the lower frequencies.158
MICROWAVE SPECTROSCOPY
Resolution of a microwave spectrometer
The resolution of a microwave spectrometer should, of course, be defined in the samemanneras in optical spectroscopy, i.e. by A = v0f2~v; two lines v1 and v2 (v0 = (v1
+
v2) /2) of about equal intensities can just be resolved and measured separately when their frequencies differ by (v1 - v2) = 2~v.Microwave spectroscopists, however, prefer to consider the line-width, ~v, itselfas a measure ofresolution instead ofthe quantity A. With conventional spectrometers ( except maser spectrometers and some of special design), there is an inevitable line-broadening effect, the Doppler broadening, which produces line-widths given by:
~v
Doppler =3·58xl0-7xJMTv0 (2)where 1.\1 = molecular weight. In the frequency region near 20 kMcfsec, for example, the Doppler widths, ~v, lie between about 15 and 30 kc/sec. In high resolution work, the aim is to reduce the observed line- widths to thislimit. The gas pressure is, therefore, lowered to a value (less than about 3 X 10⁻³ mm ofmercury for the 20 kMcfsec region) at which collision- broadening may be neglected. Of course, this is incompatible with the requirement for optimum intensity, since the peak absorption coefficient diminishes with decreasing pressure as soon as collision-broadening becomes comparable with, or smaller than, the Doppler width (at pressures below about 20 fL ofmercury). In general, lowering ofthe gas pressure alone will not suffice for the Doppler limit to be reached; other line-broadening effects must also be avoided. These are:
Line-broadening by wall collisions-By using X-band absorption cells in the 20 kMcfsec region and K-band cells in the 40 kMcfsec region, this broaden- ing effect is made smaller than the Doppler broadening.
Saturation broadening-Power levels in the absorption cell of the order 1 mW, such as are used for the detection of extremely weak lines at high gas pressure, would cause strong saturation broadening at the low pressure necessary for high resolution work, and produce line-widths larger than the Doppler width. For this reason, the power entering the absorption cell must now be reduced to a few f-L W.
Frequency fluctuations of the radiation source-These should be eliminated by frequency stabilization by means of a quartz controlled oscillator. This is considered tobe indispensable for high resolution work.
Modulation hroadening-As is well-known, modulation of the radiation is used in order to attain high sensitivity. The modulation produces a line- broadening, the magnitude of which depends on the modulation fi·equency.
With the frequently-used Stark effect modulation of 100 kcfsec, for example, it is impossible to reduce the 1ine-widths, ~v, to below 100-200 kc/sec; that means that, in the 20 kMcfsec region~ the Doppler Iimit cannot be reached with this modulation frequency. A 10 kcfsec modulation, on the other hand, gives no detectable line-broadening compared with the Doppler width for the above frequency region. Of course, the siruplest way to avoid modulation broadening is to use no modulation at all; in order to get a su:fficiently high sensitivity in this case, superheterodyne reception should be used.
159
W. MAlER Accuracy of frequency determinations
As regards the accuracy offrequency determinations, one can say that the absorption line frequencies can be measured with an accuracy of about one- tenth of their line-width; that means an accuracy better than
±
10 kcfsec for well resolved and narrow lines. In order to realize this high accuracy (which means measuring the frequency to 1 part in 3 X 10⁶ for a line at 30 kMcfsec), thesource must be frequency-stabilized and the stabi1izing quartz oscillator must be continuously controlled, by comparison with frequency standards ofan accuracy better than 1 part in 108 • The limit of 3 X I0-7 given above is then determined by the accuracy ofthe interpolation oscillator or receiver, which is apart of any frequency measuring or AFC system, and interpolates the absorption line frequency between the discontinuous har- monics of the quartz frequency.General prog,ress since 1959
After these general remarks concerning the three principal properdes of a microwave spectrometer, let us now consider the progress in experimental technique as described in the papers published since 1959.
Stark modulation spectrometer
The standard type of high-performance Stark modulation spectrometer now covers the frequency range from about 8 kMcfsec to about 40 kMcfsec with quartz-stabilized k1ystrons or backward-wave oscillators as radiation sources. Backward-wave oscillators offer the advantage ofwide-range single- control tuning: Rudolph236 has described a spectrometer using three back- ward-wave tubes (carcinotrons) which can be interchanged within a few minutes and which cover the frequency range 8-37·5 kMcfsec continuously without a gap. In addition, the tubes permit very convenient operation:
tuning of these oscillators is effected by simply varying the voltage of the delay line contained in the tube, no mechanical tuning being necessary.
Normally, the Stark modulation frequencies (square wave) lie between 10 and 120 kcfsec. Modulation near 100 kcfsec is preferably used in order to attain the highest possible sensitivity. However, it seems that, with a modulation frequency of about 30 kc/sec, the loss in sensitivity is only small whilst the improvement in resolution compared with that at 100 kcfsec modulation is remarkable. This is because, with this modulation frequency, the additional broadening by modulation is only a small fraction of the Doppler broadening for lines in the 20-30 kMc/sec region. The above spectrometer236 employs 30 kcfsec modulation and detects an OCS-line of
ocmin. 300oK = 1·1 X 10-9 cm-1 at -80 ° with a signal-to-noise ratio of about 5. This sensitivity seems tobe characteristic of a good Stark modula- tion spectrometer. Line-widths of ~v
=
40 kcfsec have been obtained with the spectrometer236 at -80o,
and with gas pressures near 3 p. of mercury for lines having an absorption coe:fficient ocpeak, aoooK>
I0-7 cm-1 •In order to achieve such a high resolution, frequency stabilization of the radiation sources and cooling of the absorption cell are indispensable. On account of the vapour pressures necessary for detecting the 1ines, the low temperature limit customarily used lies at about -80°. As regards fre- quency stabilization, progress has been made in stabilizing the source with
160
MICROWAVE SPECTROSCOPY
respect to a reference cavity by introducing modulation into the microwave discriminator circuit. Suchsystems have been described by Dymanus28 and by Bruin and Van Ladesteyn10• While the short-time stability (decisive for the elimination ofline-broadening due to fluctuations in the frequency ofthe source) of such circuits is excellent, the long-time stability is that of the reference cavity, i.e. not so good. For this reason, a different AFC-system is frequently preferred: the microwave source is then locked with the harmonics of a quartz-controlled secondary standard, cj., for instance, the papers of Zimmerer123 and Rudolph236.
As regards the detector which receives the radiation transmitted through the absorption cell, the well-known crystal diode is still in use. I ts noise figure is, practically, that of the spectrometer, and sets the limit of sensitivity.
In order to obtain the highest possible sensitivity, the most efficient practice is still to select the best crystal from as large a batch of crystal diodes as possible. Ohl et al. 93 describe a special treatment of the crystals which markedly improves their efficiency as mixers and generators of harmonics.
Their usefulness for the improvement of sensitivity is not so clearly pro- nounced.
The properties which characterize the crystal diode as an electrical device are its noise figure and its conversion gain ( often designated as conversion loss). The values for these two quantities which are to be found in the literature differ considerably, and are sometimes ambiguous. Credit is therefore, especially due to Long180 and to Dymanus and Bouwknegt141,
who have clarified certain points in their papers. The first of these180 com- pares the data of commercially-available crystal diodes, and shows how the specifications of the manufacturers should be used for calculating the electri- cal effect of the diode as part of a microwave spectrometer. The paper of Dymanus and Bouwknegt1u relates exclusively to the well-known 1 N 26 crystal rectifier. The authors have made noise figure and gain measure- ments for this diodedown to power levels as low as 1 J.LW, i.e. under conditions found when operating a microwave spectrometer at high resolution.
Other microwave spectrometers
The above survey indicates the present status of experimental technique in microwave spectroscopy as regards the most widely used spectrometer in this field, the Starkmodulation transmission spectrometer. Other types of microwave spectrometers may be mentioned only very briefly as follows:
Video transmission spectrometer-The simple video transmission spectrometer has remained the preferred spectrometer for spectroscopy in the frequency range above 100 kMcjsec. Stark modulation has also been applied144 for frequencies up to 170 kMcfsec; however, it was not used as a means of improving the sensitivity of the spectrometer, but on1y to study the Stark patterns of the lines in order to identify the transitions.
Cavity spectrometer-There has been renewed interest in the cavity spectro- meter, partly in connection with the prob1ems of intensity measurements
23•27
•28
•142
• partly in connection with the beam maser spectrometer5•223
• It seems that the two types ofmicrowave spectrometers, the transmission spectro- meter and the resonance (cavity) spectrometer, are equivalent as regards sensitivity, resolution and accuracy. The sensitivity of both types can be
L-PAC 161
W. MAlER
markedly improved by employing Stark modulation, and still higher sensitivity can be attained by using superheterodyne reception instead of crystal rectification of the microwave power. The Stark modulation cavity spectrom.eter described by Dymanus28 has, it is true, a more homogeneous Stark field, and, therefore, distinctly sharper Stark satellite lines, than a Starkmodulation transmission spectrometer of conventional design. How- ever, with Stark cells ofthe parallel-plate type, the same homogeneity can also be achieved with the transmission spectrometer. As far as can be seen, the cavity spectrometer is tobe preferred only for special purposes. For standard spectroscopic work, i.e. looking for and measuring lines in a frequency range as wide as possible, it has the decisive disadvantage that several cavities are necessary to cover a frequency range of, for example, 10-40 kMcfsec, and that not only the oscillator but also the cavity has tobe tuned. This makes the operation of the spectrometer distinctly more cumbersome.
Maser spectrometers-Finally, we have to mention the maser spectrometers, several types of which have been employed for spectroscopic work in recent years. Perhaps it will be useful to distinguish between two methods of opera ting a maser spectrometer.
In the first instance, there are the spectrometers which use an absorption cell of conventional design and take advantage ofthe possibilities given by ''pumping'' asecond transition whichhasonelevelcommon with the transition to be studied. I t is possible, in this way, to enlarge considerably the difference in population, and thus to enhance the line intensity. This method can be used suceessfully for the very weak lines below ,..., 100 Me/sec by pumping in the cm wave region108• Another way is to pump the (weak) transitiontobe studied and to observe another, much stronger, transition which has one Ievel common with the first220• The authors call their procedure the "three- level technique". All the spectrometers which use pumping of a second transition in the above or a similar manner may, perhaps, be described most simply as "double-resonance spectrometers".
The other type of maser spectrometer is the "molecular-beam maser spectro- meter". I t is an apparatus quite different from the conventional microwave transmission spectrometer, and uses a parallel beam of molecules and a high-Qcavity148• It may be operated essentially as a sort of cavity spectro- meter whose chief advantage is only the extremely low line-width (A_v,..., 5 kcfsec for lines near ""20 kMc/sec). The sensitivity of such a beam maser spectrometer at frequencies above ,..., 10 kMcfsec is distinctly lower than that of a conventional transmission spectrometer223• Therefore, in this region of the spectrum, this type of spectrometer is of interest on1y for specialsturlies requiring extremely high resolution, such as, for example, in the investiga- tion of extremely small hyperfine splittings (e.g. purely magnetic hyperfine interactions between nuclear spin and molecular rotation) of strong lines113 ,114, 210 •238 • I t seems that a great improvement in sensitivity could be attained without loss of resolution if the apparatus were operated as a maser oscillator or as a nearly-oscillating maser amplifier214•
The future development ofmaser spectrometers will be of great interest to microwave spectroscopists. However, there seems no doubt that the maser spectrometer will remain a special purpose instrument which will be extremely valuable for work requiring the highest resolution, butthat it will never serve
162
OJ w
Substance N20
NH2CN HN03
S20 HDSe
N02Cl CH3SH
CH2(CN)2
HCHO
HCOF
HCO'NH2
No. qf isotopic species investigated 8(14N, 15N, 1s0, lSQ)
3(1H, 2D, 12C, 14N) 3(1H, 2D, HN, tsN, tGO)
2(160, a2s, a4S) 5("6Se, 77Se, 78Se, 80Se, 82Se)
2 (14N, 160, ascl, a7Cl) 3(1H, 2D, 12C, 32S, ßv-valuc)
5(1H, 2D, 12C, tac, 14N, tsN)
5(1H, 2D, 12c, tac, tso, tsO)
2 (tH, 2D, 12c, tsO)
IO(tH, 2D, 12c, 14N, tsN)
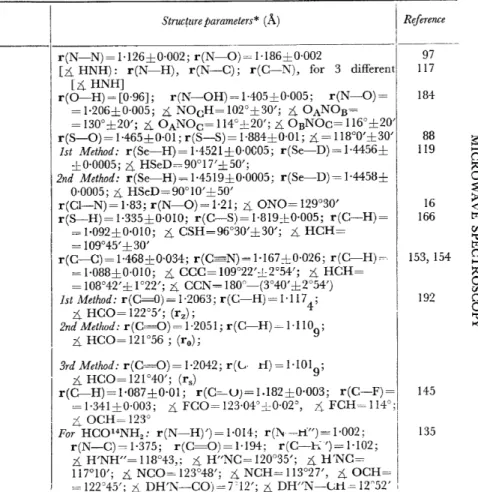
Table 1. Structure parameters
Struc(ure parameters* (Ä) I Reference I _____ _
r(N-N) = 1·126±0·002; r(N-0) =I ·186±0·002
[Li HNH): r(N-H), r(N-C); r(C-N), for 3 different [Li HNH]
r(O-H) = [0·96]; r(N-OH) = 1·405±0·005; r(N-0) =
= 1·206±0·005; Li NOcH= 102°±30'; Li OANOB=
= 130o±20'; Li OANOc= 114°±20'; Li OBNOc= 116°±20' r(S-0)= 1-465±0·01; r(S-S)= 1·884±0·01; Li= 1 18°0'±30' Ist Method: r(Se-H)=1·4521±0·0C05; r(Se-D)=1·4456±
±0·0005; Li HSeD=90°17'±50';
2nd Method: r(Se-H)=1·4519±0·0005; r(Se-D)=1·4458±
0·0005; Li HSeD=90°10'±50'
r(C1-N) = 1·83; r(N-0) = 1·21; Li ONO= 129°30' r(S-H)= 1·335±0·010; r(C-S)= 1·819±0·005; r(C-H)=
= 1·092±0·010; Li CSH=96°30'±30'; Li HCH=
= 109°45' ±30'
r(C-C)= 1·468±0·034; r(C N)= 1·167±0·026; r(C-H)=
= 1·088±0·010; 4 CCC= 109°22'±2°54'; 4 HCH=
= 108°42' ± J022'; 4 CCN= 180°-(3°40' ±2°54') Ist Method: r(C=0)=1·2063; r(C-H)=1·117
4;
Li HCO= 122°5'; (r2 ) ;
2nd Method: r(C=O)= 1·2051; r(C-H)= 1·1109; 4 HC0=121°56; (r0 );
13rd Method: r(C=0)=1·2042; r(G· rl)=1·101 9;
97 117 184
88 119
16 166
153, 154
192
r(C-H)=1·087±0·01; r(C=-UJ=I.182±0·003; r(C-F)=J 145 I
4HC0=121°40'; (rs)
=1·341±0·003; Li FC0=123·04°~c:0·02°, ;i FCH=114°;1
. Li OCH= 123° I
For HC014NH2 : r(N-H)')=l·014; r(~~.ti")=1·002; I 135 r(N-C)= 1·375; r(C=0)=1·194; r(C-h ')= 1·102;
Li H'NH"= 1 18°43,; Li H"NC= 120°35'; Li H'NC=
117°10'; Li NC0=123°48'; Li NCH=113°27', 4 OCH=
= 122~45'; Li DH'N-C0)=7'12'; Li DH"N-Gtl-= 12"52' I
~ ~
0 :;d 0
~
tTl
\fl
"d tTl 0 ~
~ 0
\fl
0 0
""C
-<
contd.
Substance No. qf isotopic species investigated HCONH2 IO(IH, 2D, 12c, 14N, 1sN, 16Q)
HCOOH 3(1H, 2D, 12C, 1s0)
HCOOCH3 9(1H, 2D, uc, lBC, 16Q, lBQ)
-
~ CH3-CH2F l2(1H, 2D, uc, laC)
CH3-CH2-CH3 6(1H, 2D, 12c, tsq
CH3-COF 8(1H, 2D, 12c, 13C, 160, lBQ)
Tablc 1
Structure parameters* (Ä)
For HCO 15NH2 : r(N-H')= 1·014; r(N-H")= 1·001;
r(N-C)=1·376; r(C=0)=1·192; r(C-H")=l·l03;
4 H'NH"= 119°3'; .zS_ H"NC= 120°38'; 4 H'NC= 117°9';
4 NCO= 123°48'; 4 NCH= 113°1'; .4 OCH= 123°11';
4 DH'N-C0)=6°43'; 4 DH"N-CH= ll018' (H'1ies trans to aldehyde-H; H"lies cis to aldehyde-H)
Riference
r(C-H)=l·092±0·01; r(C=0)=1·237±0·002; r(C-0)= I 185
=1·312±0·002; r(O-H)=0·96l±0·01; 4 OCO=
12°57'±15'; 4HC0=120°58'±15'; 4 COH=107°50'±10' r(C=0)=1·200±0·01; r(C-O)carboxyt=l·334±0·01; I 21
r(C-H)carboxyt= 1·101±0·01; r(C-O)methoxyl= 1·437±
0·01; r(C-H)methyt=1·086±0·015; 4 OC0=125°52'±P;
4 HCOcarboxyl=109ol8'±1°; 4 COC=l14°47'±1°;
4 HCH= 110°40' ± 1 °30'
r(C-C)= 1·533; r(C-F)= 1·379; r(C(1)-H)= 1·094; 124 r(Cc2)-H(a))= 1·092; r(Cc2)-H(5))= 1·098; 4 CCF=
= 109°27'; 4 C(2)C(1)H= 111 °17'; 4 Cc1)C(2)H(a)= 110°6';
4 Cc1)C(2)H(s)= 110°10'
r(C-C)=1·526±0·002; 4 CCC=112°24'±12'; CH2-group: I 177 r(C-H) = 1·096±0·002; 4HCH= 1 06°6' ± 12'; CH3-groups:
r(C-H(s))= 1·089±0·009; r(C-H(a))= 1·094;
r(C-H)av.= 1·091±0·01; 4 H(a)CH(a)= 107°18';
4 H(a)CH(s)= 108°6'; 4 HCHav.= 107°42' ± 1°;
4 CCH(s)=111o48'±1°; 4 CCH(a)=ll0°42'
Assuming symmetrical CH3-group: r ( C-C) = 1·503 ± 0·003; 99 r(C-F)=l·348±0.·015; r(C=0)=1·181±0·01; 4 CCF=
=110'018'±1°; 4 CC0=128°21'±lo; r(C-H)=l·084±
0·003; 4 CCH= I 09°30' ± 1 o
Assuming asymmetrical CH3-group: r ( C-C) = 1· 502; r( C-F)=
=
1·343; r(C=O)= 1·185; 4 CCF= 110°44'; .zS_ CCO==
127°54'; r(C-H)in-plane= 1·082; r(C-H)out-of-plane= 1·096~ CCHin-plane= 110°24'; 4 CCHout-of-plane= 108°48';
~ HCHin-plane= 110°51' ,:i HCHout-of-plane= 107°16'
~
~
~t:z::l :;tl
...
Ci)
c..n
'U.IOJ.a'UVVR
CH3-COCN
CH3-SiH2F
CH3-SiHF2
CH2=CH-SiH3
CH2=CHF
CH2=CHCI
CH2=CHCN
CF2=CHC1 CH:=C-CHO
CH2=C=0 CH3-0-CH3
'U\ .il.ll..' .!U") -..., \\....I' '-R' "'-"' 'lo,..AJI.' ..,,._.u .. l
ß(lH, an, uc, tac, 14N, 1s0, tsO)
6(1H, 2D, 12c, 2ssi, 2DSi, aosi)
4(1H, 2D, 2ssi, 29Si, aosi)
11
3(1H, t2C, tac)
9(1H, 2n, 12c, tac, ssc1, s7CJ)
6(1H, 2n, 12c, tsc, 14N, tsN)
2(1H, 12C, 35C1, 37Cl) 15(1H, 2D, 12c, 1ac, 160, 1s0)
5(1H, 2D, 12c, 1sc, 160, 1s0) 2(1H, 2D, uc, tso)
J.I.\"'-A . . L L A J - J l . ' U ' ' V - ' V ' . . , l _ V ' 'V''V"V"' .u.\"'-"' .."_.,.,, .." ..,...,. ... .._l_...." "<o.P'-"' ~\._... --~
= 1·192±0·01; r(C-Cl)= 1·789±0·005; Li CCH=
110°21'± 10'; Li CCO= 127°5'± 10'; Li CCC1= 112°39'±30' Li CCN=[180°]; r(C=O)= 1·226±0·005; r(C-H)= 1·086±
±0·005; r(C-N) = 1·164±0·005; r(Cmethyl-Ccarbonyl) =
1-490±0·01; r(Ccarbonyl-Ccyanide)= 1·466±0·01; Li HCH=
108°44'±30'; Li CmethylCO= 124°3'± 1o; t .. CCC=
114°50'± I o
r(Si-C)= 1·849±0·005; r(Si-F)= 1·597±0·005; r(Si-H)=
= 1·477±0·005; r(C-H)= 1·099±0·005; Li HSiH=
110°0'±30'; Li CSiH=112°28'±1°30'; Li HCH=108°29'±
±30'; .zS_CSiF=l08°53'±30'
r(Si-C)=1·840±0·01; r(Si-F)=1·580±0·008; r(Si-H)=
1·471±0·01;r(C-H)=1·094±0·005; Li FSiF=107°6'±30';
Li CSiH=l15°32'±1o; Li CSiF=109°22'±30'; Li HCH=
108°32' ± 30'
r(C=C)=1·347; r(Si-C)=1·852); r(Si-H)=1·475;
r(C-H)erans=l·097; r(C-H)cis=1·097; r(C-H)=1·094;
Li SiCC= 122°53'; Li HSiH= 108°42'; Li CCHtrans= 120°38';
Li CCHcis= 120°18'; Li CCH= 117°59'
Li HCH=[l20°]; Li CCH=[120°]; r(C(1)-H)=1·075±
±0·005; r(C=C)=1·337±0·002; r(C(2)-H)=1·080±
0·005; r(C-F)=l·344±0·002; Li CCF=l21°±12' r(C(l)-H)= 1·079; r(C(2)-H\2)) = 1·07 8; r(C(2)-H(a)) =
1·09;o r(C-C)=l·33
2; r(C-C1)=1·726; Li CCH(2)=
=119°32'; Li CCH(a)=121°1'; Li HCH=119°27';
Li CCC1= 122° 18'; Li CCH(1) = 123°49'; z5_ HCC1= 113°53' r(C:=N)=l·l637; r(C-C)=1·425; r(C=C)=1·3389;
r(Cc1)-H) = l·0863; Li CCC= 122°37'; Ä HCC= 12Jü44' [r(C=C)]: r(C-F), 4 FCF, r(C-Cl), for 2 different
[r(C=C)]
r(C-Hmethynyl) = 1·0553±0·001; r(C-H)aidehyde= 1·1C:64±
±0·001; r(C==C)= 1·2089±0·001; r(C-C) = 1·4446±0·001;
r(C=0)=1·2150±0·001; Li CC0=123°47'±10'; Ä CCC=
=178°24'±10'; Ä CCHaldehyde=113°54'±10';
Li CCHmethynyl= 180o0'
r(C-H)=r(C-D)= 1·083; Li HCH= Li DCD= 122°35';
r(C=C)= 1·314±0·01; r(C=O)= 1·161±0·01 Assuming 3-fold symmetry for CH3-groups: r(C-0) = 1·417;
r(C-H)= 1·093; Li COC= 11P37'; Li HCH= 109°51'
68
171
171
194
90 164
19
59 18
20 60
~ 1-1
0 :;d 0
~
~
r.n ~
0
~
0 U1
0 0
~
contd.
Substance CH3-S-CH3 CH3-CO-CH3 CH2-CH2-CH2
'-0-'
HC=CH
""'-/
CH2
HC
;:; /3""-
CJ) HC4 2N
I II HCii ICH
'\-6/
N CH3-GeH3
(CH3 ) 3CH
(CH3 ) 3SiH
No. of isotojJic species irwestigated 4
2(1H, 2D, 12C, löQ)
4(1H, 2D, 12C, 160, 180)
4(1H, 2D, 12C)
Table 1
Structure parameters* (Ä) I Reference r(C-8)=1·800±0·002; r(C-H)=1·098±0·004; 2). CSC= 1 152
=98°54'±12'; 2). HCH=109°8'±20'
' r(C=0)=[1·215±0·005]; r(C-C)=1·515±0·005; r(C-H)=l 111
=1·086±0·01; 2). HCC=110°16'; 2). CCC=l16°7'
r(C-C)=1·549±0·003; r(C-0)=1·449±0·002; I 224 r(C(a)-H)= 1·091±0·002; r(Ü(ß)-H)= 1·100±0·003;
2).CCC=84°33'±1'; 2). COC=91°59'±7'; 2). CCO=
9J044'±3'; Li HC(a)H=ll0°18'±10'; 2). HC(ß)H=
110°44'±3'
r(C-C)=1·515; r(C=C)=1·300; r(C-H)methylene= 61
= 1·087±0·004; r(C-H)vinyl= 1·070; Li HCH=
= 114°42'± 10'; 2). CvinylCvinylH= 149°55'
2(1H, 2D, 12C, 14N) \ Assuming planar ring: r(C(1)-N(2))=1·34; r(N(2)-C(a))=1·34;1 206 r(Cc3)-C(4)) = 1·39; r(Cc1>-H) = 1·09; r(C(a)-H) = 1·085;
r(Cc4)-H)=1·08; Li NCN=120°; Li CNC=121o;
4 N(2)C(a)H= I20o24'; Li NCC= I 19°36'; Li CCC= 116°48'
25(1H, 2D, 12C, 13C, 70Ge, 72Ge, 74Ge, 76Ge) I Ist Method: r (C-H) = 1·089±0·005; r(Ge-H) = 1·534±0·0051 71 r(C-Ge)= I ·9453±0·005; 4 HCH= 108°14' ±30';
4 HGeH= 108°38'±30'
2nd Method: r(C-H)= 1·083±0·005; r(Ge-H)= 1·529±0·005;
r(C-Ge)= 1·9453±0·005; 4 HCH= 108°25'±30';
4 HGeH= 109°15'±30'
6(1H, 2D, 12C, 13C) I Assuming H atoms of CH3-groups are equidistant: r(C-C) = 178
=1·525±0·001; 4 CCC=l11°9'±6'; r(Ctertiary-H)=
= 1·108±0·001; r(Cmethyt-H(s))= 1·100±0·003;
4 CCH(s)= 109°24'± 18'; r(Cmethyr-H(a))= 1·092;
Li H(a)CHca>= 108°30'; Li H(a)CHcs)= 107°54'
11(1H, 2D, 120, 13C, 2ssi, 29Si, aosi) I r(C-Si)=1·868±0·002;r(Si-H)=1·489±0·001;r(C-H)== 196
=1·095±0·002; 4 CSiC=110°l0'±12'; 4 HCH=
107°56'±14'
*
Assumed va1ues are given in square brackets.~
~ -
trj ?0MICROWAVE SPECTROSCOPY
as a wide range spectrometer of the type necessary for structural determina- tions, etc., in molecular physics.
RESULTS CONCERNING MOLECULAR STRUCTURES In the years 1959 and 1960, the structure parameters of about forty molecules have been determined. Table .J contains the results for those cases where the rotational constants of a sufficient number of isotopic species have been available for the structure parameters to be determined. In addition, some other molecules have been included, for which only one parameter
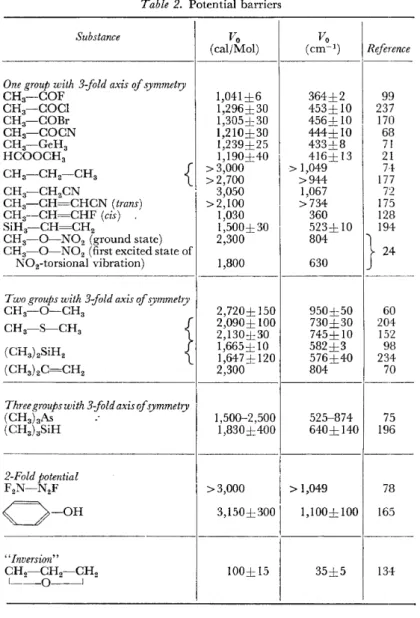
Table 2. Potential barriers
Substance Vo
(caljMol)
One group with 3-fold axis of symmetry
CH3-COF 1,041±6
CH3-COCI 1,296±30
CH3-C0Br 1,305±30
CH3-COCN 1,210±30
CH3-GeH3 1,239±25
HCOOCH3 1,190±40
CH3-CH2-CH3
{
> 3,000>2,700 CH3-CH2CN
I 3,050 CH3-CH=CHCN (trans) >2,100
CH3--CH=CHF (cis) 1,030
SiH3-CH=CH2 1,500±30
CH3- 0 - N 02 (ground state) 2,300 CH3- 0 - N 02 (first excited state of
N02-torsional vibration) 1,800
T wo groups with 3-:fold axis of symmetry
CH3-0-CH3 2,720± 150
CH3-S-CH3 f 2,090± 100
}
2,130±30(CH3 ) 2SiH2 1,665±10
L 1,647 ± 120
(CH3 ) 2C=CH2 2,300
Three groups with 3-fold axis of symmetry
(CH3 ) 3As 1,500-2,500
(CH3 ) 3SiH 1,830±400
2-Fold potential
F2N-N2F >3,000
0 - 0 H 3,150±300
"Inversion"
CH2-CH2-CH2 100± 15
~----0--l
167
(cm-Vo 1 )
364±2 453±10 456±10 444±10 433±8 416±13
>1,049
>944 1,067
>734 360 523± 10 804 630 - - - - -
950±50 730±30 745±10 582±3 576±40 804
525-874 640±140
>1,049 1,100±100
35±5
Refe rence
9 23 17 6 7 2 7 17 7 17 12 19 } 2 - -
9 7 0 8 I 1
"!
7 2 5 8 4 4
6 0 4 2 8 4 0 20
15 9 23 7
7 19
7 16
13 5 6
8 5
4·
W. MAlER
value had tobe assumed in order to calculate the others from the available rotational constants.
Besides the determination of very accurate values for molecular structure p:1rameters, the determination of low potential barriers for internal rotation has become one ofthe most important and useful contributions ofmicrowave spectroscopy to the investigation of molecular properties. Table 2 contains the results in this field which have been published since the beginning of 1959.
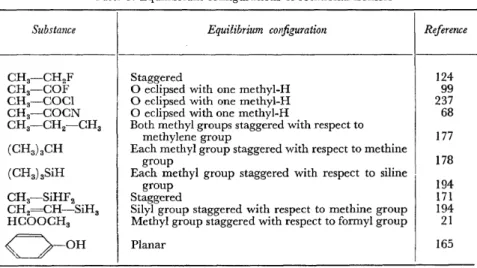
Table 3. Equilibrium configurations of rotational isomers
Substance
CH3-CH2F CH3-COF CH3-COC1 CH3-COCN CH3-CH2-CH3 (CH3 ) 3CH (CH3 ) 3SiH CH3-SiHF2
CH2=CH-SiH3
HCOOCH3
0--0H
Equilibrium configuration Reference
Staggered 124
0 eclipsed with one methyl-H 99
0 eclipsed with one methyl-H 237
0 eclipsed with one methyl-H 68
Both methyl groups staggered with respect to
methylene group 177
Each methyl group staggered with respect to methine
group 178
Each methyl group staggered with respect to siline
group 194
Staggered 171
Silyl group staggered with respect to methine group 194 Methyl group staggered with respect to formyl group 21
Planar 165
Table 4(a). Dipolemoments ofmolecules which arelinear or symmetric tops
Substance
Linear moleculcs DCl
DBr DI
OH radical { HCN
FCN HC==CF
Symmetrie tops Re03F CH3-GeH3
(CH3 ) 3CD (CH3 ) 3SiH (CH3)aAs (CH3 ) 3NBF3 CF3Cl
1-t (D)
1·12±0·04 0·83±0·02 0·445±0·02 1·65±0·25 2·1±0·4 2·986±0·002 1·68±0·05 0·75±0·01
0·85±0·05 0·635±0·006 0·132±0·001 0·525 0·86±0·02 .-..5
0·499±0·002
168
Reference
12 12 12 232 225 47 209 217
84 71 178 196 75 198 229
MICROWAVE SPECTROSCOPY
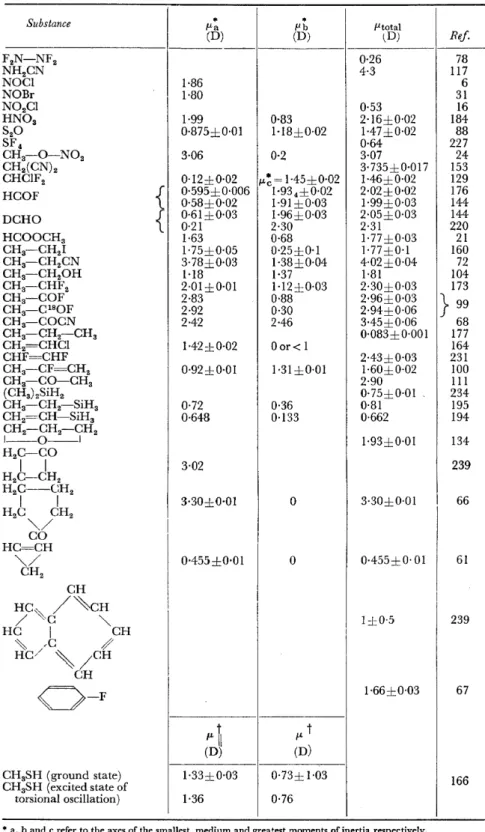
Table 4(b). Dipolemoments ofmolecules which are symmetric tops
Substance
I
P.a (D) * (D) flb * fltotal (D) Ref.F2N-NF2 0·26 78
NR2CN 4·3 117
NO Cl 1·86 6
NOBr 1·80 31
N02Cl 0·53 16
HN03 1·99 0·83 2·16±0·02 184
S20 0·875±0·01 1·18±0·02 1·47±0·02 88
SF 4 0·64 227
CH3-0-N02 3·06 0·2 3·07 24
CH2(CN)2 3·735±0·017 153
CHClF2 0·12±0·02 I"~= 1·45±0·02 1·46±0·02 129
HCOF
{
0·595±0·006 1·934±0·02 2·02±0·02 1760·58±0·02 1·91±0·03 1·99±0·03 144 DCHO
{
0·61±0·03 0·21 2·30 1·96±0·03 2·05±0·03 2·31 144 220HCOOCH3 1·63 0·68 1·77±0·03 21
CH3-CH21 1·75±0·05 0·25±0·1 1·77±0·1 160
CH3-CH2CN 3·78±0·03 1·38±0·04 4·02±0·04 72
CH3-CH20H 1·18 1·37 1·81 104
CH3-CHF2 2·01±0·01 1·12±0·03 2·30±0·03 173
CH3-COF 2·83 0·88 2·96±0·03
} 99
CH3-C180F 2·92 0·30 2·94±0·06
CH3-COCN 2·42 2-46 3·45±0·06 68
CH3-CH2-CH3 0·083±0·001 177
CH2=CHCl 1-42±0·02 Oor< 1 164
CHF=CHF 2·43±0·03 231
CH3-CF=CH2 0·92±0·01 1·31±0·01 1·60±0·02 100
CH3-CO-CH3 2·90 111
(CH3) 2SiH2 0·75±0·01 234
CH3-CH2-SiH3 0·72 0·36 0·81 195
CH2=CH-SiH3 0·648 0·133 0·662 194
CH2-CH2-CR2
l - - 0 - - l 1·93±0·01 134
H2C-CO
I I 3·02 239
H2C-CH2
H2C--CH2
I I 3·30±0·01 0 3·30±0·01 I 66
H2C CH2
~/
CO HC=CR
~/ 0·455±0·01 0 0·455±0· 01 61
CH2
CR
HC~
/"\.eH/ c ~ 1±0·5 239
HC I CH
~ / ,c /
HC/ ' / C R
0-F
CH 1·66±0·03 67fLt
l"t(D) (D)
CR3SH (ground state) 1·33±0·03 0·73± 1·03 166
CR3SH (excited state of
torsional oscillation) 1·36 0·76
* a, band c refer to the axes of the smallest, medium and greatest moments ofinertia respectively.
t \1 and J.. respectively refer to the directions parallel and perpendicular to the axis of internal rotation.
169
W. MAlER
In measuring the potential barrier to internal rotation, it is often possible to determine from the microwave spectrum the exact molecular configuration für the equilibrium positions of the movable group. There are several different methods, and the results are assembled in Table 3.
Y et another field of molecular physics for which microwave spectroscopy gives information not attainable by other methods is the determination of dipole moments by means ofthe Stark effect ofthe rotational spectra. There are two advantages of the microwave spectroscopic method compared with the usual dielectric method. Firstly, the Stark effect gives the components of the dipole moment related to the axes of inertia of the molecule. That means that, in molecules of low symmetry, for which the orientation of the dipole moment within the molecule is not given by the symmetry, this orientation can be deduced from the values of the dipole components.
Secondly, very small dipole moments can be measured reliably andaccurately by this means. Table 4 contains the results ofmicrowave spectroscopic dipole moment determinations which have been published since the beginning of 1959, and gives numerous examples of the advantages claimed for this method.
Abstracts are indicated by the fetter A.
1959 Bibliography
1 I. C. Baird and G. R. Bird. Bult. Am. Phys. Soc., Ser. ll, 4, 68 (1959) (A)
2 J. G. Baker, D. R. Jenkins, G. N. Kenney and T. M. Sugden. Meeting Handbook, 4th Meeting on Molecular Spectroscopy, Bologna (1959) (A)
3 I. G. Baker. Bult. Am. Phys. Soc., Ser. 11, 4, 290 (1959) (A)
4 A. Battaglia, A. Gozzini and E. Polacco. Nuovo cimento, 14, 1076 (1959)
5 Y. Beers. Rev. Sei. Instr., 30, 9 (1959)
6 E. L. Beeson, Q. Williams and T. L. Weatherly. Bult. Am. Phys. Soc., Ser. II, 4, 291 (1959) (A)
7 W. S. Benedict and C. D. Kaplan. J. Chem. Phys., 30, 388 (1959)
8 L. A. Blyumenfel'd and V. V. Volvodski. Soviel Phys. JEPT, 2, 365 (1959)
9 L. C. Brown and P. M. Parker. Tabfes qf Asymmetry Parameter Function, Departmental publication, Ohio State University (1959)
1
°
F. Bruin and D. Van Ladesteyn. Physica, 25, 1 (1959)11 C. A. Burrus. J. Chem. Phys., 30, 976 (1959)
12 C. A. Burrus. J. Chem. Phys., 31, 1270 (1959)
13 H. E. Bussy and G. Birnbaum. Rev. Sei. Instr., 30, 800 (1959)
14 J.-L. Calais. Quantum Chemistry Group, Uppsala (1stJune 1959)
15 D. Christensen. Spectrochim. Acta, 15, 767 (1959) (A)
16 L. Clayton, Q. Williams and T. L. Weatherly. J. Chem. Phys., 30, 1328 (1959)
17 L. Clayton, Q. Williams and T. L. Weatherly. J. Chem Phys., 31, 554 (1959)
18 C. C. Costain andJ. R. Morton. J. Chem. Phys.; 31, 389 (1959)
19 C. C. Costain and B. P. Stoicheff. J. Chem. Phys., 30, 777 (1959)
20 A. P. Cox, L. F. Thomas and J. Sheridan. Spectrochim. Acta, 15, 542 (1959)
21 R. F. Curl. J. Chem. Phys., 30, 1529 (1959)
22 V. E. Derrand S. ]. Gallagher. Bult. Am. Phys. Soc., Ser. II, 4, 455 (1959) (A)
23 H. A. Dijkerman, C. Huiszoon and A. Dymanus. Appl. Sei. Research, BS, 1 (1959)
24 W. B. Dixon. Spectrochim. Acta, 15, 767 (1959) (A)
25 J. M. Dowling and C. C. Costain. Spectrochim. Acta, 15, 767 (1959) (A)
26 H. Dreizier and H. D. Rudolph.
z.
Naturforsch. 14a, 758 (1959)27 A. Dymanus. P~ysica, 25, 859 (1959)
28 A. Dymanus. Rev. Sei. Instr., 30, 191 (1959)
29 A. Dymanus. Phys. Rev., 116, 351 (1959)
170