The impact of CO 2 on inorganic carbon supply and pH homeostasis in
Corynebacterium glutamicum
Inaugural-Dissertation zur
Erlangung des Doktorgrades
der Mathematisch-Naturwissenschaftlichen Fakultät der Universität zu Köln
vorgelegt von
Katja Meike Kirsch aus Saarbrücken
Köln, 2014
Berichterstatter:
Prof. Dr. Reinhard Krämer Prof. Dr. Ulf-Ingo Flügge
Tag der Disputation: 14.03.2014
Zusammenfassung
Bei dem Actinobacterium C. glutamicum handelt es sich um ein Bodenbakterium, das stark in der Biotechnologie genutzt wird, vor allem für die Produktion von L-Glutamat und L-Lysin. Ein wichtiger Aspekt bei der industriellen Fermentation mit hohen Zelldichten ist die Bildung großer Mengen CO
2. Da in C. glutamicum CO
2die Versorgung mit anorganischem Kohlenstoff ebenso beeinflusst wie den internen pH-Wert, wurden beide Aspekte in dieser Arbeit untersucht. Für die ausreichende Versorgung mit anorganischem Kohlenstoff ist die ß-Carboanhydrase Bca vor allem bei niedrigem externen pH essentiell, denn die Umwandlung von CO
2zu Hydrogencarbonat (HCO
3-) ist entscheidend, damit es als Substrat für die Carboxylierung von PEP und Pyruvat zur Verfügung steht. Obwohl Bca-Aktivität auch zu einer beschleunigten Protonenbildung führt, scheint die pH-Homöostase durch das Enzym nicht beeinflusst zu sein. Auch erhöhte CO
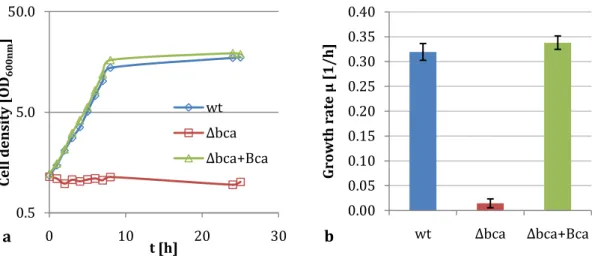
2-Konzentrationen in der Zuluft haben keinen wachstumshemmenden Effekt und führten nur zu kurzen Effekten in Bezug auf pH-Homöostase. Ein Fehlen von Bca führt zu einem Wachstumsdefizit der Deletionsmutante C. glutamicum Δbca. Dieses kann durch die heterologe Expression von Genen ausgeglichen werden, die für ein cyanobakterielles Hydrogencarbonat-Aufnahmesystem kodieren, genannt SbtAB.
Obwohl diese Komponente des Kohlenstoff-konzentrierenden Systems aus
Synechocystis sp. PCC 6803 anorganischen Kohlenstoff in C. glutamicum bereitstellen
kann, sind die positiven Auswirkungen auf den Wildtyp gering und beinhalten erhöhte
Wachstumsraten auf Glukose und zum Teil auf Pyruvat. Die Aktivität von SbtAB konnte
mit radiochemisch markiertem Hydrogencarbonat bestimmt werden. Zur Untersuchung
der pH-Homöostase in C. glutamicum wurde ein Fluoreszenz-basiertes System zur
online-Detektion entwickelt, das das ratiometrische GFP-Derivat pHluorin nutzt. Die
Dynamik des Homöostaseprozesses konnte bestimmt werden, und die Ergebnisse
zeigen die Fähigkeit von C. glutamicum, zwischen pH 6 und 8,5 effektiv pH-Homöostase
zu betreiben. Verschiedene Komponenten, die an der pH-Homöostase beteiligt sind,
wurden mit den entsprechenden Deletionsmutanten untersucht. Das Fehlen beider
Endoxidasen der Atmungskette führt zum Kollaps der pH-Homöostase, während das
Fehlen nur einer Komponente die Homöostasefähigkeit nicht beeinflusst. Das Fehlen der
F
(1)F
(O)ATPase hat keine Auswirkung auf die pH-Homöostase in C. glutamicum.
Abstract
The actinobacterium C. glutamicum is a soil bacterium which is extensively used in
biotechnology, especially in the production of L-glutamate and L-lysine. An important
aspect of industrial scale fermentation processes with high cell densities is the
formation of large amounts of CO
2. Since CO
2is assumed to influence inorganic carbon
provision as well as the internal pH of C. glutamicum, both aspects were investigated in
this study. For a sufficient supply with inorganic carbon, the ß-type carbonic anhydrase
Bca is essential, especially at low external pH values, since conversion of CO
2to
bicarbonate (HCO
3-) is crucial before it can serve as a substrate for PEP and pyruvate
carboxylation reactions. Although Bca activity also leads to an accelerated proton
formation, the pH homeostasis seems not to be affected by this enzyme. Also, elevated
CO
2in the supply air did not lead to impaired growth and showed only short term effects
on pH homeostasis. A lack of Bca leads to a growth deficit of the deletion mutant
C. glutamicum Δbca. This can be compensated by the heterologous expression of genes
encoding a cyanobacterial system for bicarbonate import, called SbtAB. Although this
component of the carbon concentrating mechanism of Synechocystis sp. PCC 6803 is able
to provide inorganic carbon in C. glutamicum, there were only slight benefits observed in
C. glutamicum wild type, including elevated growth rates on glucose and partly on
pyruvate. The activity of SbtAB could be determined in uptake measurements using
radio-labelled bicarbonate. The impact of SbtAB on pH homeostasis is negligible. To
investigate the pH homeostasis of C. glutamicum, a fluorescence based assay for online
detection of the intracellular pH was established using the ratiometric GFP variant
pHluorin. The dynamic of the homeostasis process was determined and the results show
the ability of C. glutamicum to perform effective pH homeostasis at external pH values
from 6 to 8.5. Various possible components of the pH homeostasis machinery were
observed by determination of the pH homeostasis capacity of the according deletion
mutants. A complete lack of both branches of terminal oxidases of the respiratory chain
leads to collapse of the pH homeostasis, while the absence of only one branch does not
affect the ability to perform pH homeostasis. Also the absence of the F
(1)F
(O)ATPase has
no effect on the of pH homeostasis in C. glutamicum.
Abbreviations
ATP Adenosine triphosphate Bca ß-type carbonic anhydrase
BCIP 5-Bromo-4-chloro-3-indolyl phosphate BSA Bovine serum albumine
CA Carbonic anhydrase
CCCP Carbonyl cyanide m-chlorophenyl hydrazone CCM Carbon concentrating mechanism
cdm Cell dry mass CO
2Carbon dioxide cpm Counts per minute
CTAB Cetyltrimethylammonium bromide DNA Deoxyribonucleic acid
EDTA Ethylenediaminetetraacetic acid EYFP Enhanced Yellow Fluorescent Protein GFP Green Fluorescent Protein
H
2CO
3Carbonic acid HCl Hydrochloric acid HCO
3-Bicarbonate
HEPPS 3-[4-(2-Hydroxyethyl)-1-piperazinyl]propane sulfonic acid HPLC High Pressure Liquid Chromatography
IPTG Isopropyl β-D-1-thiogalactopyranoside
K
+Potassium
K
2HPO
4Dipotassium phosphate kDa Kilodalton
KH
2PO
4Potassium dihydrogen phosphate KP
iPotassiumphosphate buffer, inorganic MES 2-(N-morpholino)ethanesulfonic acid MOPS 3-(N-morpholino)propanesulfonic acid
Na
+Sodium
NaOH Sodium hydroxide NBT Nitro blue tetrazolium OD Optical density
OPA o-phtaldialdehyde/borate/2-mercapto-ethanol PCR Polymerase chain reaction
PEP Phosphoenolpyruvate pH
iInternal pH
PTS Phosphotransferase system PVDF Polyvinylidene fluoride
SbtAB Sodium-bicarbonate-transporter A and B
SDS Sodium dodecyl sulfate
TAE Tris-acetate-EDTA TBS Tris buffered saline TC Total counts
TCA Tricarbonic acid
Contents
1. Introduction ...1
1.1 The model organism Corynebacterium glutamicum ... 1
1.2 CO
2and the role of inorganic carbon in bacteria ... 2
1.2.1 The hydration of CO
2and its impact on proton homeostasis ... 2
1.2.2 The role of CO
2in inorganic carbon provision ... 3
1.3 Carbonic anhydrases ... 5
1.3.1 The catalytic reaction mechanism ... 5
1.3.2 Classification and functions of carbonic anhydrases ... 6
1.3.3 The Carbonic anhydrases of C. glutamicum ... 7
1.4 Cyanobacterial bicarbonate importers ... 8
1.5 Bacterial pH homeostasis ... 8
1.5.1 The importance of pH regulation ... 8
1.5.2 Mechanisms of pH homeostasis ... 9
1.6 Thesis objectives ... 11
2. Materials and Methods ... 12
2.1. Bacterial strains and culture conditions ... 12
2.1.1. Bacterial strains and plasmids ... 12
2.1.2. Culture conditions ... 15
2.1.3. Culture media and buffers ... 15
2.1.4 Growth experiments ... 16
2.2. Molecular biology techniques ... 17
2.2.1 Polymerase Chain Reaction (PCR) and product purification ... 17
2.2.2 Cloning of PCR fragments ... 19
2.2.3 Transformation of E.coli cells ... 20
2.2.4 Isolation of plasmid DNA and sequence analysis ... 20
2.2.5 Transformation of C. glutamicum cells ... 20
2.3. Uptake measurements ... 21
2.3.1 Cultivation prior to uptake measurements ... 21
2.3.2 Radiochemical detection of bicarbonate uptake ... 21
2.4. Determination of the intracellular pH ... 22
2.5. Protein biochemistry techniques ... 24
2.5.1. Gene expression for protein synthesis and cell disruption ... 24
2.5.2 SDS-Polyacrylamide gel electrophoresis (SDS-PAGE)... 24
2.5.3 Western blot analysis ... 25
2.6 Analytical methods ... 26
2.6.1 Lysine detection via HPLC analysis ... 26
2.6.2 Determination of osmolality ... 26
3. Results ... 27
3.1. The carbonic anhydrase Bca is essential in C. glutamicum ... 27
3.1.1 C. glutamicum ∆bca is not able to grow at atmospheric CO
2... 27
3.1.2 The C. glutamicum ∆bca phenotype is caused by the lack of Bca ... 28
3.1.3 The impact of bca overexpression in wild type cells is negligible ... 30
3.2 Heterologous expression of a cyanobacterial bicarbonate importer in C. glutamicum ... 34
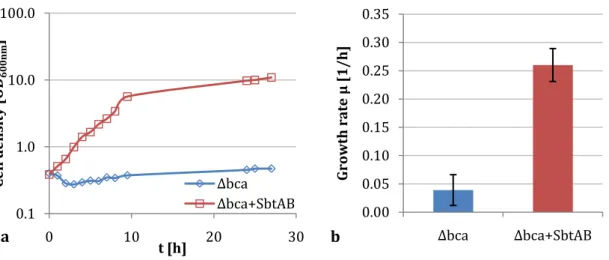
3.2.1 SbtAB can restore growth of the C. glutamicum ∆bca strain ... 34
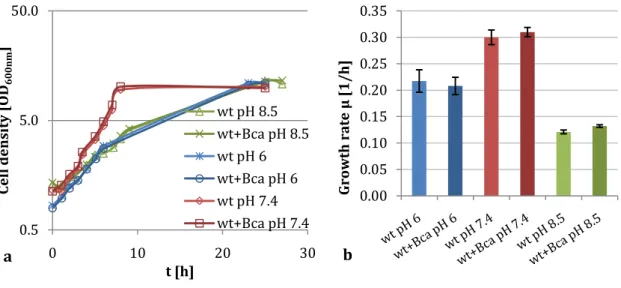
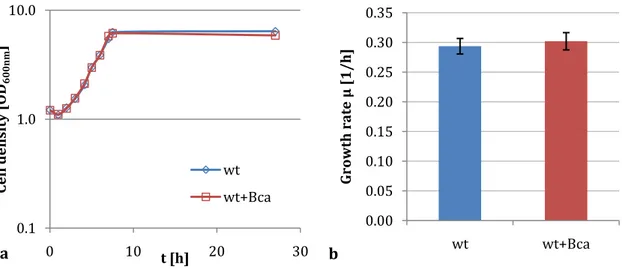
3.2.2 SbtAB has only slight impact on C. glutamicum wild type cells ... 39
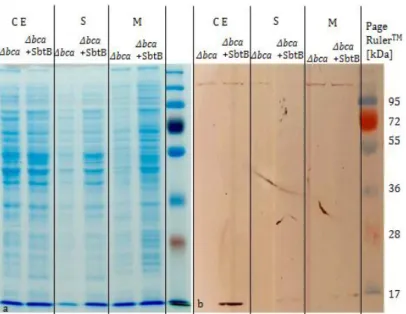
3.2.3 The activity of SbtAB in C. glutamicum is difficult to display ... 44
3.2.4 SbtAB has no influence on the lysine yield in production strains ... 47
3.3 The pH homeostasis capacity of C. glutamicum ... 49
3.3.1 A method for online pH
imeasurement was established ... 49
3.3.2 The pH homeostasis in C. glutamicum is hardly affected by CO
2... 52
3.3.3 Bca and SbtAB do not interfere with pH homeostasis ... 53
3.3.4 Wild type cells perform pH homeostasis over a wide pH range ... 55
3.3.5 The process of pH homeostasis relies on the function of the respiratory chain ... 56
3.3.6 The F
(1)F
(O)ATPase is not involved in pH homeostasis ... 60
4. Discussion ... 62
4.1 Inorganic carbon supply in C. glutamicum ... 62
4.1.1 The impact of CO
2on the physiology of C. glutamicum ... 62
4.1.2 Inorganic carbon supply in C. glutamicum Δbca and the role of Bca in pH
homeostasis ... 64
4.1.3 Inorganic carbon supply in C. glutamicum wild type ... 65
4.2 The impact of bicarbonate import via SbtAB ... 68
4.2.1 Consequences of additional bicarbonate in C. glutamicum ... 68
4.2.2 Possible alternatives to SbtAB ... 70
4.2.3 A model of inorganic carbon provision ... 71
4.3 The pH homeostasis machinery of C. glutamicum ... 73
4.3.1 The potential and possible limitations of the established pH
idetection method ... 73
4.3.2 The role of the respiratory chain ... 74
4.3.3 A possible involvement of the F
(1)F
(O)ATPase ... 75
4.3.4 Other putative components of the pH homeostasis machinery of C. glutamicum ... 76
5. Literature ... 78
1
1. Introduction
1.1 The model organism Corynebacterium glutamicum
The first description of the Gram-positive soil bacterium Corynebacterium glutamicum dates back to 1957 (Kinoshita, 1957). The GC-rich bacterium belongs to the family of Mycobacteriaceae which is part of the order of Actinomycetales. It is immobile, rod- shaped and its name refers to its typical club-like form (coryne [greek]: club). As C. glutamicum is non-pathogenic, it serves as a model organism for closely related pathogenic mycobacteria like Mycobacterium leprae, Mycobacterium tuberculosis and Corynebacterium diphteriae (Minnikin, 1982; Stackenbrandt, 1997). It was discovered during the search for amino acid producing bacteria. Since then, C. glutamicum has been used extensively in industrial amino acid production.
Due to large efforts in metabolic engineering, C. glutamicum has become the most relevant organism for industrial L-lysine production with about 1.5 Mt/a. The L- glutamate production with C. glutamicum nowadays reaches a market size of almost 2.5 Mt/a (Becker & Wittmann, 2012). For example, a completely rationed lysine producer derived from a non-producing wild type strain was successfully designed in 2011 (Becker et al., 2011). While L-lysine plays an important role in animal nutrition in industrial farming processes, L-glutamate is a popular flavour enhancer in convenience food. Further amino acids that are produced using C. glutamicum include L-methionine (Bolten et al., 2010) and L-tryptophan (Ikeda, 2006). Production of the diamine cadaverine is also possible using C. glutamicum (Mimitsuka et al., 2007). Above, biofuels (Blombach et al., 2011; Inui et al., 2004; Smith et al., 2010), organic acids (Litsanov et al., 2012) and vitamins (Vertes et al., 2012) can be produced by C. glutamicum. Another biotechnological application of C. glutamicum which is of great economical importance is the production of various nucleotides, which serve for example as flavour enhancers and whose fermentative production has already been described in 1966 (Demain et al., 1966).
Despite this huge impact of C. glutamicum in the field of biotechnology, many aspects of
its physiology are still to be explored. Hence, not only strain improvement but also
fundamental research in this field is still of interest. The study in hand contributes to
2
this task by investigating physiological aspects of central importance. These are inorganic carbon supply and intracellular pH as well as basic mechanisms of proton homeostasis of C. glutamicum in general. All of them are basic physiological parameters that interfere with numerous cellular processes.
1.2 CO
2and the role of inorganic carbon in bacteria
1.2.1 The hydration of CO
2and its impact on proton homeostasis
Industrial scale fermentations in bioreactors using C. glutamicum are performed at extraordinary high cell densities (Knoll et al., 2007). Under aerobic growth conditions, this leads to strongly elevated CO
2concentrations of > 20 % due to the metabolic activity of the cells. This phenomenon shows up in particular at the bottom of large scale fermenters with volumes up to 750 m
3, where elevated hydrostatic pressure leads to an increased solubility of CO
2in the medium (Hermann, 2003). Also, local pH shifts of the medium occur during fermentation processes due to insufficient stirring (Kelle, 2005).
Earlier experiments in C. glutamicum indicate a failure of pH homeostasis at an external pH of 6 and high CO
2levels in the supply air (Follmann, 2008). Additionally, it has been reported that elevated CO
2concentrations lead to an enhanced transcription of acid stress genes (Baez et al., 2009). The underlying relation might be the proton formation during hydration of CO
2in aqueous solution (Figure 1.1). It has to be noted that the first step which leads to the formation of carbonic acid (H
2CO
3) is not energetically favourable.
CO
2+ H
2O (H
2CO
3) HCO
3-+ H
+Figure 1.1: Hydration of CO2. If CO2 is dissolved in aqueous solution, carbonic acid (H2CO3) is generated as a highly unstable intermediate. The weak acid dissociates to bicarbonate (HCO3-) and a proton (H+)(Mostafa & Gu, 2003).
Gaseous CO
2is able to enter the cell passively by diffusion via the cell membrane. As a
consequence, the inner and outer concentrations are in equilibrium. The solubility of
CO
2changes dependent on temperature, hydrostatic pressure and above all the pH of
the solution (Onken & Liefke, 1989). In an acidic surrounding, CO
2is the major form
3
while at an alkaline pH most of the emerging CO
2is available as bicarbonate (HCO
3-).
Two aspects of CO
2are likely to cause negative effects on the pH homeostasis in C. glutamicum. On the one hand, the emerging protons from the hydration reaction intensify acidic stress at low external pH values. On the other hand, CO
2is known to cause an elevated permeability of cell membranes, called the “anaesthetic effect”. This phenomenon might affect the proton gradient of the membrane and thereby interfere with pH homeostasis (Baez et al., 2009; Sears & Eisenberg, 1961). Especially at low external pH values and high cell densities causing elevated CO
2concentrations, these factors may lead to a collapse of pH homeostasis in C. glutamicum.
1.2.2 The role of CO
2in inorganic carbon provision
Under neutral pH conditions, C. glutamicum is able to tolerate high CO
2concentrations that occur during large scale fermentations (Bäumchen et al., 2007). This is remarkable, since usually CO
2has a noxious effect on microorganisms on various levels (Ballestra P., 1996; Garcia-Gonzalez et al., 2007; Spilimbergo & Bertucco, 2003) and has been used in food preservation long-since (Dixon & Kell, 1989). In contrast, C. glutamicum profits from elevated CO
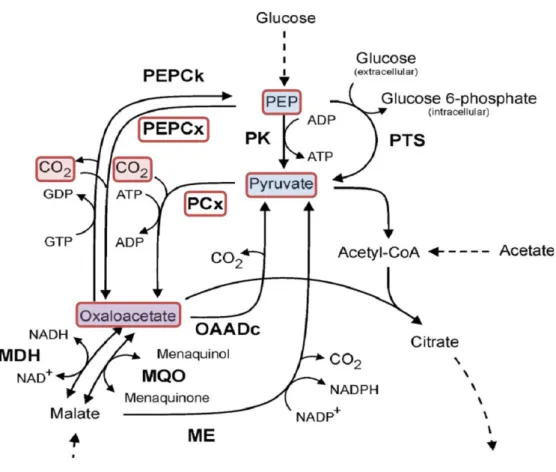
2levels especially at the beginning of fermentation processes. Inorganic carbon in its hydrated form of carbonate is added to the medium (personal note, Evonik Industries AG). The underlying reason for this observation may be the fact that inorganic carbon is required in carboxylation reactions like phosphoenol-pyruvate (PEP) and pyruvate carboxylation to perform gluconeogenesis, replenish TCA cycle intermediates and synthesise amino acids (Kronberg, 1966; Peters-Wendisch et al., 1997; Peters- Wendisch et al., 2001). The central significance of these reactions is represented by the PEP-pyruvate-oxaloacetate node pictured in Figure 1.2. Emanating from the oxaloacetate generated in the carboxylation reactions, the amino acid aspartate is formed which is the precursor molecule for the synthesis of asparagine, threonine, methionine, isoleucine and lysine. Although carboxylation and decarboxylation reactions seem to be in equilibrium during growth on glucose in wild type cells (Marx et al., 1996;
Petersen et al., 2000), there are possible scenarios that enhance the need for external supply with inorganic carbon. Such conditions may be growth at low cell densities when the metabolic activity is still low, growth on gluconeogenic carbon sources such as pyruvate, lactate, acetate and glutamate (Gerstmeir et al., 2003; Kramer et al., 1990;
Netzer et al., 2004)or also in lysine producing strains.
4
Figure 1.2: Pyruvate, PEP, oxaloacetate and malate conversions in C. glutamicum (modified, (Netzer et al., 2004)). Solid arrows are marking reactions of the pyruvate kinase (PK), dashed arrows represent glycolysis, acetate activation and tricarboxylic acid cycle reactions. PTS, phosphotransferase system; PEPCk, PEP carboxy kinase; PEPCx, PEPcarboxylase; PCx, pyruvate carboxylase; OAADc, oxaloacetate decarboxylase; MDH, malate dehydrogenase; MQO, malate:quinine oxidoreductase; ME, malic enzyme. The coloured blocks highlight the carboxylation reactions of PEP and pyruvate catalysed by PEPCx and PCx, which lead to the formation of oxaloacetate.
In this context, it has to be noted that the actual substrate for the involved enzymes
seems to be bicarbonate (Giordano et al., 2003; Mitsuhashi et al., 2004; Norici et al.,
2002; Okino et al., 2008), which points out the importance of an efficient hydration of
CO
2as displayed in the equation in Figure1.1. The reversible conversion from CO
2to
HCO
3-includes the formation of H
2CO
3as an unstable intermediate, a reaction that
proceeds fairly slowly. In fact, this step is catalysed in vivo by a well described
ubiquitous class of zinc metalloenzymes called carbonic anhydrases (CA, E.C.4.2.1.1),
(Meldrum & Roughton, 1933; Stadie, 1933).
5
1.3 Carbonic anhydrases
1.3.1 The catalytic reaction mechanism
The central role of carbonic anhydrases (CAs) is represented by their appearance in all domains of life. They are divided into three major classes called α-, β-, and γ-CAs. All classes evolved divergently and vary in sequence and structure (Hewett-Emmett &
Tashian, 1996). Nevertheless, they all share a common active site containing a zinc ion involved in catalysis (Lindskog, 1997). The enzymatic conversion of CO
2is a two-step mechanism that is based on a nucleophilic attack on CO
2by a zinc-bound hydroxy-group (OH
-) leading to bicarbonate formation, followed by regeneration of the active centre through ionisation of the now zinc-bound water (Lindskog, 1997). Figure 1.3 (a) displays the enzymatic conversion as well as the regeneration reaction. A crucial step is the replacement of bicarbonate by a water molecule, while the following proton transfer is the rate limiting step. Most CAs possess a k
cat> 10
4/s. Hence, this step requires a proton shuttle residue (PSR) to transfer protons to the final buffer in the solution.
Usually, this is the His-64 residue of the active centre (Northrop & Simpson, 1998). This reaction step is shown in Figure 1.3 (b).
a
b
Figure1.3: Conversion of CO2 at the active site zinc ion of CAs. The first step includes a nucleophilic attack by the zinc-bound hydroxide on CO2. In a second step, the active site is regenerated by ionization of the zinc-bound water and the release of an H+ion (a). To perform regeneration of the active centre via water ionisation, transfer of H+ to the proton shuttle residue (PSR) is necessary, before protons can be translocated to the actual buffer substance (B)(b)(Tripp et al., 2001).
Although this reaction mechanism is common to all classes of carbonic anhydrases, the
variations in their molecular structures are remarkable and many functions are
described so far.
6
1.3.2 Classification and functions of carbonic anhydrases
While mammalian α-CAs representing the best described group, β-, γ-CAs are mostly found in algae, bacteria and archaea. Especially the β-class has been detected in plants, algae and bacteria, showing various structures. A classification including a fourth δ-class has been discussed years ago (Tripp et al., 2001). Examples of the different structures are displayed in Figure 1.4.
Figure 1.4: Ribbon diagrams of the varying structures of the three different CA-classes (modified, (Tripp et al., 2001)). Each colour represents one monomer in the respective molecule. The active site zinc ions are displayed as red spheres. A, α- class human isozyme II; B, β-class CA from the red algae Porphyridium purpureum; C, β-class CA from the pea plant Pisum sativum; D, β-class CA from the archeon Methanobacterium thermoautotrophium; E, β-class CA from the bacterium Escherichia coli; F, γ-class CA from the archeon Methanosarcina thermophilia.
The physiological functions of CAs are diverse (Henry, 1996; Rowlett et al., 2002; Smith
& Ferry, 2000) and their activity is known to be pH dependent (Cronk et al., 2001). For
example, an involvement in lipid biosynthesis has been described as well as a role in
photosynthesis related processes (Hoang & Chapman, 2002; Igamberdiev & Roussel,
2012; Lynch et al., 1995). In one case, a function in oxidative stress response was
postulated for a β-class CA in Saccaromyces cerevisiae (Götz et al., 1999). The oxygen-
sensitive phenotype of a ∆nce103 mutant was rescued by MscaI, a β-class CA from
Medicago sativa. Unlike Mscal, the Bca-like NCE103 shows no CA activity in the CO
2-
based standard assay (Wilbur & Anderson, 1948). However, this observation was
refuted later on (Clark et al., 2004). CAs are of great medicinal interest as a suitable
target for common groups of antibiotics (Lopez et al., 2011; Nishimori et al., 2010;
7
Supuran, 2011). Above, they have been shown to enhance the activity of a bicarbonate importer in Xenopus oocytes (Schueler et al., 2011) and serve anaplerotic functions in Chlamydomonas reinhardtii mitochondria (Giordano et al., 2003). These examples underline the central importance of this group of enzymes in carbon metabolism.
1.3.3 The Carbonic anhydrases of C. glutamicum
Sequence analysis of the wild type strain C. glutamicum ATCC 13032 (Abe, 1967) revealed the existence of two carbonic anhydrase encoding genes called bca (cg2954) and gca (cg0155), belonging to the β- and γ-class, respectively (Mitsuhashi et al., 2004).
While transcription of the gca gene was not detectable and the deletion mutant did not behave different from the wild type, the bca gene is mainly expressed during exponential growth as well as during lysine production and a ∆bca deletion mutant possesses a distinct phenotype. C. glutamicum ∆bca shows a severe growth deficit at atmospheric CO
2concentrations. Growth can be restored by cultivation at 5 % CO
2in the supply air and by heterologous expression of the CA encoding pca gene from Porphyridium purpureum (Mitsuhashi et al., 2004). These findings point towards the role of CAs in inorganic carbon supply. Dependency on the accelerated hydration of CO
2catalysed by carbonic anhydrases to provide sufficient amounts of inorganic carbon appears likely. Since the influence of the gca gene seems negligible, the bca gene product Bca (Beta-typecarbonic anhydrase) is assumed to be the relevant carbonic anhydrase for C. glutamicum. Since its activity leads also to an accelerated proton formation, the deletion mutant C. glutamicum ∆bca was expected to show better pH homeostasis at elevated CO
2concentrations compared to the wild type. However, such an effect could not be observed (Follmann, 2008, unpublished). Nevertheless, elucidation of this connection needs further investigations. Also, the impact of the provided bicarbonate is of great interest in this context. Since this essential substrate cannot permeate the membrane like CO
2, the necessity of Bca activity for its provision seems obvious.
Creating an alternative way for its provision is a possible strategy to examine this aspect.
The heterologous expression of a bicarbonate importer derived from an autotrophic
organism is a possible strategy.
8
1.4 Cyanobacterial bicarbonate importers
The growth of many photosynthetic organisms depends on carbon concentrating mechanisms (CCMs) since the central enzyme for carbon fixation, the Ribulose-1,5- bisphosphatcarboxylase/oxygenase (RuBisCO), shows a very low substrate affinity for CO
2(Kaplan & Reinhold, 1999). If the external pH is high, CO
2mainly occurs in its hydrated form of HCO
3-, which can be converted back into CO
2in the carboxysomes by carbonic anhydrases (Price et al., 1992). Hence, bicarbonate importers are important for carbon supply in these organisms (Price et al., 2008; Price, 2011). In the extensively studied cyanobacterial model organism Synechocystis sp. PCC 6803 (Grigorieva &
Sestakov, 1982), two HCO
3-importers are encoded of which one has been identified as a Na
+/HCO
3--symporter. According to this function, it has been named SbtA (Sodium- bicarbonate-transport A)(Shibata et al., 2002). SbtA is encoded by the slr1512 gene.
Transcriptional analyses revealed an elevated expression during alkaline stress (Summerfield & Sherman, 2008). This up-regulation of bicarbonate import makes sense at elevated pH values, since under these conditions bicarbonate is the most prominent form of inorganic carbon available. Also, the topology of SbtA has recently been described (Price et al., 2011). Located next to slr1512 is slr1513, the gene encoding SbtB, a periplasmic protein of unknown function. Both genes show similar expression patterns (Summerfield & Sherman, 2008). Hence, SbtB might be a crucial part of the functional transport system.
1.5 Bacterial pH homeostasis
1.5.1 The importance of pH regulation
In bacteria, an efficient pH homeostasis is essential to survive changing proton concentrations of their environment, since energy driven processes depend on a stable electrochemical proton gradient along the membrane for ATP generation. In aerobic organisms like C. glutamicum, this proton motive force is about 200 mV (Kashket, 1985;
Mitchell, 1973). The fact that the external pH of the medium alters the bacterial
metabolism has been known long-since (Gale & Epps, 1942), but the many ways of pH
regulation in acidophilic, neutrophilic and alkalophilic bacteria are still not fully
9
understood. However, basic mechanisms have been described in detail earlier (Booth, 1985).
1.5.2 Mechanisms of pH homeostasis
A passive mechanism of pH regulation is the buffering capacity of the cytoplasm which has been determined for a number of bacteria (Booth, 1985). A regulation of the intracellular pH via proton consuming decarboxylation of amino acids is described as part of acidic stress response (Gale, 1946) and many examples for this function can be found (Castanie-Cornet et al., 1999; Iyer et al., 2003; Kashiwagi et al., 1991; Senouci- Rezkallah et al., 2011). Above, urease activity to produce alkalising ammonium, as well as membrane alterations and DNA repair mechanisms contribute to pH regulation (Cotter & Hill, 2003). However, no such mechanism has been described in C. glutamicum yet (Follmann, 2008).
Another aspect of pH regulation is the influence of cation/proton-antiporters. An involvement of sodium and potassium in alkaline and acidic stress response has long been discussed, since both play a role in maintenance of the proton motive force (Booth, 1985). In recent years, many examples for the involvement of both cations and Na
+(K
+)/H
+-antiporters in pH homeostasis have been described (Casey & Condon, 2002;
Chapman et al., 2006; Epstein, 2003; Kitko et al., 2010; Krulwich et al., 2009; Quinn et al., 2012). In C. glutamicum, the potassium channel CglK is known to be essential at acidic pH (Follmann et al., 2009a). Also, two Mrp-type K
+(Na
+)/H
+-antiporters can be found in C. glutamicum and a role in alkaline pH homeostasis is discussed (Follmann, 2008).
The most likely players of pH regulation are proton pumps that can actively transfer H
+via the membrane. Of central importance in this context is the F
(1)F
(O)ATPase, which
generates ATP using the electrochemical proton gradient. If the external pH is high,
proton influx via ATPase activity is crucial to maintain a neutral intracellular pH
(Barriuso-Iglesias et al., 2006; Barriuso-Iglesias et al., 2013; Bender et al., 1986; Maurer
et al., 2005; Padan et al., 2005; Sturr & Marquis, 1992). Also, a reverse function to export
protons at acidic stress is possible and induction of the F
(1)F
(O)ATPase-operon by acidic
pH has been reported in Streptococcus, Lactococcus and Lactobacillus (Koebmann et al.,
2000; Kuhnert et al., 2004; Kullen & Klaenhammer, 1999; Martin-Galiano et al., 2001). In
10
C. glutamicum, an involvement in alkaline stress response has been described (Barriuso- Iglesias et al., 2006), while a reverse function in acidic stress response seems unlikely (Koch-Koerfges et al., 2012). Proton export via the respiratory chain as part of pH homeostasis at acidic conditions is another possible scenario, which has not been taken into account yet. In C. glutamicum, two branches of proton exporting terminal oxidases exist (Bott & Niebisch, 2003). Especially the bc1-aa3-supercomplex with its ability to transfer 6 H
+/2 e
-bears great potential to be involved in pH regulation. Figure 1.5 gives an overview of the postulated mechanisms for pH homeostasis in C. glutamicum with emphasis on the involvement of CO
2.
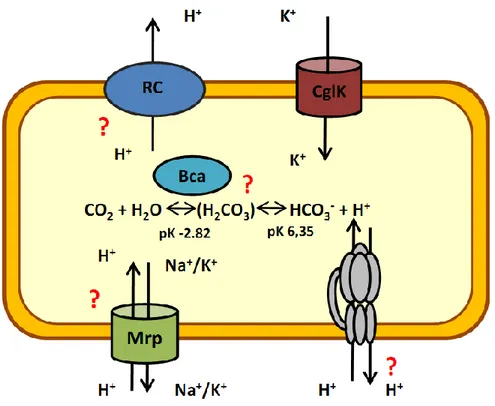
Figure 1.5: Components involved in pH homeostasis in C. glutamicum. Potassium import via CglK was shown to be essential at acidic pH (Follmann et al., 2009a). It is not clear to what extend Bca activity contributes to proton formation and pH homeostasis. While the respiratory chain (RC) might be used for proton export under acidic stress, the F(1)F(O)-ATPase (displayed in grey colour) is part of alkaline stress response and may be involved in proton export at acidic pH. Also, the role of the cation/proton-antiporters (Mrp) postulated in C. glutamicum is not clear yet.
Abbreviations: CglK, C. glutamicum K+ channel; RC, Respiratory chain.
The above figure illustrates the many aspects of pH regulation that are still unclear in
C. glutamicum. Hence, investigation on the various candidates responsible for proton
homeostasis is important. Understanding pH homeostasis is also basic to estimate the
influence of CO
2in this context, since it is not clear to which extend its hydration
interferes with proton homeostasis of the cell.
11
1.6 Thesis objectives
This work aims to give a better understanding of inorganic carbon metabolism and pH homeostasis in C. glutamicum. First of all, the examination of the carbonic anhydrase Bca and its influence on cellular processes is central to this. A second approach examines the possible benefits of bicarbonate import. An ideal scenario includes an optimised supply with inorganic carbon on the one hand and a better pH homeostasis at high CO
2concentrations on the other hand. If import of bicarbonate shifts the balance of the CO
2hydration reaction towards the educts, the negative influence of CO
2on pH homeostasis is believed to be less severe since proton formation is attenuated at the same time.
Hence, the potential of bicarbonate import for strain improvement by elevating the lysine yield is also of interest. A third topic is the profound investigation of pH homeostasis in C. glutamicum.
The experiments will include a deeper physiological characterisation of the C. glutamicum ∆bca mutant, a strain which lacks the active ß-type carbonic anhydrase Bca. Also, a test for possible benefits in carbon supply via overexpression of the bca gene in the wild type as well as a precise examination of the influence of Bca on pH homeostasis will be performed. To investigate benefits of elevated bicarbonate levels in C. glutamicum, heterologous expression of a bicarbonate importer is necessary. For this purpose, the SbtA transporter from Synechocystis sp. PCC 6803 will be tested in C. glutamicum. Since SbtA mediated bicarbonate uptake might also elevate the lysine yield in production strains, this will be measured as well. To investigate pH homeostasis, one aim is the establishment of a tool for online detection of the intracellular pH (pH
i).
Once such a system based on pH sensitive fluorescence proteins can be established, investigations towards the dynamics of pH homeostasis in general can be performed.
Online pH
imonitoring might be used to shed light on the influence of CO
2on proton
homeostasis and to characterise various components of pH homeostasis in
C. glutamicum.
12
2. Materials and Methods
2.1. Bacterial strains and culture conditions
2.1.1. Bacterial strains and plasmids
For cloning procedures, the E. coli strain DH5α (Grant et al., 1990) was used. All C. glutamicum strains in this work are based on the wild type strain ATCC 13032 (Abe, 1967), with the exception of the C. glutamicum ∆bca strain which was provided by Kyowa Hakko Bio Co., LTD. and the production strain DM1933, which was provided by Evonik Industries AG. Table 2.1 gives an overview of all used bacterial strains.
Table 2.1: List of bacterial strains, used in this study. Explanations towards the features of the strains are given in the “Genotype” row.
Strain Genotype Origin
E. coli DH5 α mcr
endA1 subE44 thi-1 λ
-recA1 gyrA96 relA1 deoR ∆(lacZYA-argF) U196 φ80DlacZ
∆m15mcrA ∆(mmr hsdRMS mcrBC)
(Grant et al., 1990)
C. glutamicum
ATCC 13032 ATCC 13032 wild type (Abe, 1967)
∆F
1F
OATCC 13032 with a deletion of the atpBEFHAGDC genes encoding F
(1)F
(O)-ATP synthase
(Koch-Koerfges et al., 2012)
∆qcr
ATCC 13032 with a deletion of the qcrCAB genes encoding the cytochrome bc1-aa3 branch of the respiratory chain
(Koch-Koerfges et al., 2013)
∆cydAB
ATCC 13032 with a deletion of the cydAB genes encoding the cytochrome bd branch of the respiratory chain
(Koch-Koerfges et al., 2013)
DOOR ATCC 13032 with a deletion of the cydAB and qcrCAB genes (Devoid Of Oxygen Respiration)
(Koch-Koerfges et al., 2013)
DM 1933 DM 1730 (lysC
T3111-pyc
P4585-hom
V59A-∆pck), Evonik Industries AG
13
2x(lysC
T3111-asd-dapA-dapB-ddh-lysA-lysE)
∆bca
Kyowa Hakko strain with a deletion of the bca gene encoding the carbonic anhydrase Bca
Kyowa Hakko Bio Co., LTD.
∆gca
Kyowa Hakko strain with a deletion of the gca gene encoding the carbonic anhydrase Gca
Kyowa Hakko Bio Co., LTD.
All strains were stored as glycerol cultures at -80°C using Roti®-Store tubes (Carl Roth
GmbH & Co. KG, Karlsruhe). The C. glutamicum strains mentioned in this work were
always equipped with the according pEKEx2-based plasmids. An overview of all
constructs is given in Table 2.2.
14
Table 2.2: List of plasmids, used in this study. All plasmids were amplified in E. coli and used for expression in C. glutamicum.
Plasmid name Properties Origin
pEKEx2 Km
R, lac promoter, oriV
E.c., oriV
C.g., Expression vector
(Eikmanns et al., 1991) pGM1
Plasmid encoding the sequence for the fluorescence dye pHluorin (ratiometric)
(Miesenböck et al., 1998) pEKEx2_EYFP pEKEx2 with the sequence encoding
the fluorescence protein EYFP (Faust, 2011)
pEKEx2_pHluorin
pEKEx2 with the sequence encoding the fluorescence protein pHluorin derived from the pGM1 plasmid
This work
pEKEx2_EYFP_Bca_Strep
pEKEx2_EYFP with the sequence encoding the carbonic anhydrase Bca from C. glutamicum and a Strep-tag
This work
pEKEx2_EYFP_SbtAB_Strep
pEKEx2_EYFP with the sequence encoding the SbtAB construct from Synechocystis sp. PCC 6803 and a Strep-tag
This work
pEKEx2_pHluorin_Bca_Strep
pEKEx2_pHluorin with the sequence encoding the carbonic anhydrase Bca from C. glutamicum and a Strep-tag
This work
pEKEx2_pHluorin_SbtAB_Strep
pEKEx2_pHluorin with the sequence encoding the SbtAB construct from Synechocystis sp. PCC 6803 and a Strep-tag
This work
pEKEx2_SbtA
pEKEx2_pHluorin with the sequence encoding the bicarbonate importer SbtA from Synechocystis sp. PCC 6803
Ines
Ochrombel
15
2.1.2. Culture conditions
E. coli cells were cultivated on solid LB complex medium (Sambrook, 1989) plates containing 1.5 % agar. For liquid cultures, 5 ml LB-medium was used. The cultivation was performed at 37 °C. Liquid cultures were shaken on an agitator at 125 rpm.
C. glutamicum pre-cultures were grown on BHI complex medium (Brain-Heart-Infusion, Oxoid Thermo Scientific, Hampshire, UK) either on solid plates containing 1.5 % agar or in liquid cultures of 10 ml. Pre-cultures of the C. glutamicum DOOR mutant were cultivated on BHI complex medium containing 0.2 M MOPS and 22 mM glucose. Cells were cultivated at 30 °C. Liquid cultures were shaken at 125 rpm with the exception of cultures treated with elevated CO
2concentrations in the supply air. In this case, no agitation was possible due to technical reasons.
2.1.3. Culture media and buffers
Main cultures that were used in the described experiments were grown in CgXII minimal medium with modifications depending on the experimental setup. The basic composition was as follows:
CgXII minimal medium
(NH
4)
2SO
420 g/l
Urea 5 g/l
K
2HPO
41,6 g/l
KH
2PO
41 g/l
MOPS 42 g/l
MgSO
40.25 g/l
CaCl
20.01 g/l
Protocatechuic acid 0.03 g/l
Biotin 0.2 mg/l
Trace elements solution 1 ml/l Trace elements solution
FeSO
4x7H
2O 10 g/l MnSO
4xH
2O 10 g/l
ZnSO
41 g/l
CuSO
4x5H
2O 0.2 g/l
NiCl
2x6H
2O 20 mg/l
16
As organic carbon sources, either 5.5 mM (corresponding to 1 % w/v) glucose or 50 mM pyruvate were used.
If a pH below 7 or above 7.5 was required, 0.2 M MES or 0.2 M HEPPS instead of 0.2 M MOPS were used, respectively. During media preparation the pH was set using 10 M NaOH and 5 M HCl.
2.1.4 Growth experiments
All growth experiments were performed in 500 ml Erlenmeyer shaking flasks containing 50 ml liquid culture. For the selection of cells carrying the desired pEKEx2 plasmids, kanamycin was added to a final concentration of 50 mg/l. To induce gene expression via the lac promoter, 0.1 mM IPTG were used in the experiments. Cultures were incubated at 125 rpm and 30 °C. If cultures were treated with additional CO
2in the supply air, they were grown in custom made glass tubes (Figure 2.1) in a culture volume of 25 ml at 30 °C.
Figure 2.1: Glass vessels for CO2 supplementation. The sterile filtered air/CO2-mixture was lead into the culture via thin glass tubes. The culture volume for optimal mixing was 25 ml.
As a growth parameter, the cell density was determined photometrically at a wavelength
of 600 nm. Derived from the monitored growth curves, the growth rate µ [1/h] for
exponential growth stages was determined using Microsoft Excel (Microsoft
Corporation, Redmond, WA, USA).
17
2.2. Molecular biology techniques
2.2.1 Polymerase Chain Reaction (PCR) and product purification
To amplify the pHluorin encoding DNA sequence, the pGM1 plasmid (Miesenböck et al., 1998) was used as DNA template. In case of the bca sequence encoding the carbonic anhydrase Bca, genomic DNA from C. glutamicum was used. The DNA template for amplification of the slr1512-slr1513 region encoding the SbtAB construct was genomic DNA from Synechocystis sp. PCC 6803. The PCR reaction was performed using the Phusion
®High-Fidelity-PCR system (Thermo Scientific, Fisher Scientific Germany GmbH, Schwerte, Germany) with HF-buffer as recommended by the supplier. A typical reaction mix consisted of the following components:
H2O ad 50 µl
Template-DNA 0,5-3 µl
5x HF-buffer 10 µl
dNTP mix 10 mM 1 µl Forward primer 10 µM 2.5 µl Reverse primer 10 µM 2.5 µl
DMSO 1.5 µl
Phusion
®Polymerase 0.5 µl
A typical program for amplification included the following steps:
98 °C, 2 min Initial denaturation 98 °C, 15 s Denaturation
50 °C, 15 s Oligonucleotide binding 72 °C, 1-2.5 min Elongation
72 °C, 5 min Final elongation Repetition of steps 2-4 30-35 x
8 °C, ∞ Short term storage
The oligonucleotides that were used as primer molecules in the PCRs were synthesised
by Eurofins MWG Operon (Eurofins MWG Operon AG, Ebersberg, Germany) and are
listed in Table 2.3.
18
Table 2.3: List of oligonucleotides, used for PCR and control sequencing in this study. All samples were stored as a 100 µM aqueous solution at -20 °C.
Oligonucleotide
name Properties Sequence
pHluoforBam (5’superecBam)
pHluorin encoding, forward
5’GGGATCCAGGAGGAATTAACCATGAGTAA AGGAGAAGAACTTTTC
pHluorevBam (3’superecBam)
pHluorin encoding,
reverse 5’GGGATCCTTATTTGTATAGTTCATCCATGC
bcaASfKpnIYFP
bca encoding, first of
two possible
transcription starts, forward
5’TATGGTACCCATGACCTAAATGATTGTACT GACTGGC
bcaSTREPrKpnIYF
bca encoding with Strep- tag sequence, reverse
5’TATGGTACCTTATTTTTCGAACTGCGGGTG GCTCCAACCCACGTTCTTGCTAATTACAGGT TCAGTACGACC
slrRBSforKpnIYFP
sbtA encoding with ribosome binding site, forward
5’TATGGTACCAGGAGACAATTTACATTATG GA
slrSTREPrSacIYFP
sbtB encoding with Strep-tag sequence, reverse
5’TATGAGCTCTTATTTTTCGAACTGCGGGTG GCTCCAACAGCCCTCAGGGCCACA
pEKEx2for Sequencening primer
pEKEx2-mcs forward 5’ATCGGCTCGTATAATGTG pEKEx22for2 Sequencening primer
pEKEx2-mcs forward 5’GGCATACTCTGCGACATCG
pHluo.end.for
Sequencening primer, binds at the end of the pHluorin encoding sequence
5’TACCTGTCCTACCAATCTGCCCTTTCG
pEKEx2rev Sequencening primer
pEKEx2-mcs reverse 5’CCGCTTCTGCGTTCTGATTT
The integrity of plasmid DNA in E. coli or C. glutamicum was confirmed via PCR using the
EconoTaq
®Plus Green 2x Master Mix (Lucigen Corporation, Middleton, WI, USA)
19
according to manufacturer’s instructions. 1 µl per 10 µM oligonucleotide primer was added. With a sterile pipette tip, small amounts of colony material were transferred directly from the agar plate into the PCR mix. A typical example of the PCR program chosen for this so called “Colony-PCR” was as follows:
95 °C, 10-15 min Cell lysis and Initial denaturation 95 °C, 30 s Denaturation
50 °C, 30 s Oligonucleotide binding 72 °C, 1-3 min Elongation
72 °C, 7 min Final elongation Repetition of steps 2-4 30-35 x
8 °C, ∞ Short term storage
After completion of the PCR, the samples were analysed by agarose-gel electrophoresis using 1 % agarose in TAE buffer pH 8. For sizing of the DNA fragments, the GeneRuler
TM1 kb DNA ladder (Thermo Scientific, Fisher Scientific Germany GmbH, Schwerte, Germany) was used. DNA fragments that were to be used in cloning procedures were sliced out and purified using the “Nucleo Spin
®Gel and PCR Clean-up” kit (Macherey- Nagel GmbH und Co. KG, Düren, Germany) or the “High Pure PCR Product Purification Kit” (Roche Diagnostics Deutschland GmbH, Mannheim, Germany) according to manufacturers’ instructions.
2.2.2 Cloning of PCR fragments
To introduce purified PCR fragments into the pEKEx2 plasmid, both gene fragment and
vector DNA were incubated with the according restriction enzymes. In case of the
pHluorin encoding fragment, this was BamHI, KpnI was chosen for the bca fragment,
while the SbtAB encoding fragment was flanked by KpnI and SacI restriction sites. All
enzymes were purchased from Thermo Scientific (Fisher Scientific Germany GmbH,
Schwerte, Germany) in the FastDigest
®version. Samples containing the plasmid were
additionally treated with the thermo-sensitive alkaline phosphatase FastAP (Fisher
Scientific Germany GmbH, Schwerte, Germany) to prevent recirculation of the vector
molecules. Reactions were performed at 37 °C for 30 min, followed by a purification step
via agarose gel electrophoresis.
20
After purification, ligation was performed using T4 DNA ligase (Fisher Scientific Germany GmbH, Schwerte, Germany) in a total volume of 15 µl as recommended by the supplier. After inactivation for 10 min at 65 °C, the ligation mix was used for E. coli transformation.
2.2.3 Transformation of E.coli cells
Chemical-competent E. coli cells were prepared as described by Inoue et al (Inoue et al., 1990). 100 µl cell suspension were transformed with approximately 5 µl ligation mix or 100 ng plasmid-DNA by incubation on ice for 30 min, followed by a heat shock at 42 °C for 45 s. Afterwards, cells were again incubated on ice for 2 min. 500 µl LB medium was added and the cell suspension was incubated for 30-60 min at 37 °C in 1.5 ml tubes at 500 rpm. Cells were then spread on LB-agar plates and incubated at 37 °C for about 16 h.
2.2.4 Isolation of plasmid DNA and sequence analysis
Plasmid-DNA was isolated from E. coli cells with the “Nucleo Spin
®Plasmid” (Macherey- Nagel GmbH und Co. KG, Düren, Germany) or the “High Pure Plasmid Isolation Kit”
(Roche Diagnostics Deutschland GmbH, Mannheim, Germany) according to manufacturers’ instructions.
Control sequencing of the isolated plasmids was performed by GATC Biotech AG (Konstanz, Germany).
2.2.5 Transformation of C. glutamicum cells
C. glutamicum cells were made electro-competent as described earlier (Liebl et al.,
1989). For transformation, approximately 300-500 ng plasmid-DNA were added to 50 µl
cell suspension on ice. The transformation was performed with an electrical pulse of
2.5 kV, followed by immediate addition of 1 ml BHIS medium. After incubation for 1 h at
125 rpm and 30°C in a 15 ml tube, cells were spread on BHI-agar plates and further
incubated at 30 °C. After about two days, the occurring colonies were isolated and the
integrity of the inserted plasmids was checked via Colony-PCR.
21
2.3. Uptake measurements
2.3.1 Cultivation prior to uptake measurements
Wild type cells of C. glutamicum equipped with a pEKEx2 plasmid with and without SbtAB were cultivated overnight in BHI complex medium with 50 mg/l kanamycin and 0.1 mM IPTG. If the C. glutamicum ∆bca+SbtAB strain was used, the overnight cultures were additionally supplied with 10 % CO
2. Prior to conduction of a measurement cells were transferred into 25 ml CgXII minimal medium with 5.5 mM glucose, pH 8.5 at a starting OD of 1. Both C. glutamicum wild type and ∆bca+SbtAB cultures were grown at atmospheric CO
2. Uptake measurements were started when the cultures had reached an OD of about 5 in case of the wild type and 2 in case of the C. glutamicum ∆bca+SbtAB strain.
2.3.2 Radiochemical detection of bicarbonate uptake
Uptake measurements with wild type cells were performed at 30 °C in a water bath using glass tubes and a magnetic stirrer, while C. glutamicum ∆bca+SbtAB cells were incubated in 25 ml Erlenmeyer flasks on an agitator at 125 rpm and 30 °C. In the latter case, uptake was monitored during further growth. This growth of C. glutamicum ∆bca+SbtAB at atmospheric CO
2concentrations was used as an indicator for the functionality of SbtAB. Each 25 ml pre-culture was separated in two and one sample was treated with 50 µM CCCP to uncouple any membrane potential and thereby serve as a negative control for bicarbonate uptake. All cultures were spiked with 100 µM
14
C labelled bicarbonate (NaH
14CO
3). At defined time points, 500 µl of the culture were
filtered via a glass fibre filter (Merck Millipore, Billerica, MA, USA) followed by an
immediate washing step using 2 x 2.5 ml CgXII medium pH 8.5. The filter was placed in a
tube containing 3.8 ml scintillation cocktail which had been alkalised by addition of
50 µl/3.8 ml 10 M NaOH. The use of alkaline pH values throughout the experiment was
essential to prevent bicarbonate loss by CO
2formation. After incubation for at least
three hours to avoid quenching effects by un-dissolved filter residues, the samples were
analysed in the scintillation counter LS 6500 (Beckman Coulter Inc., Brea, CA, USA). The
bicarbonate uptake at each defined time point was calculated using the following
equation:
22
uptake [nmol HCO
3-/mgDW] =(cpm(cell
(tx))*n HCO
3-[nmol])/(cpm(TC
(t0))*OD*V
sample[ml]*0,36mg/ml)
DW: dry weight, Cpm: counts per minute, TC: total counts in the sample, OD: optical density, t: time
The uptake rate v was determined by extrapolation of the resulting graph.
2.4. Determination of the intracellular pH
In order to measure the intracellular pH of C. glutamicum, the pH sensitive GFP derivate pHluorin (Miesenböck et al., 1998) was used. Prior to each measurement, 10 ml pre- culture were washed and transferred into 50 ml CgXII minimal medium supplemented with 5.5 mM glucose at pH 7.4 without MOPS buffer. Selection of plasmid carrying cells was ensured with 50 mg/l kanamycin. Expression of the pHluorin-containing pEKEx2 plasmids was performed using 0.1 mM IPTG. After cultivation for about three hours, the cells had reached an OD between 5 and 7. This value was chosen since it corresponds to sufficient amounts of pHluorin in the culture to ensure precise detection. In case of the DOOR mutant, 50 ml pre-cultures were washed and transferred into 50 ml CgXII minimal medium three hours prior to the experiment, since growth of the mutant on minimal medium was rather poor.
The intracellular pH of the whole culture was determined with the Aminco
Bowmann
®Series 2 Luminescence Spectrometer (SLM Instruments, Urbana, IL, USA) by
monitoring excitation scans from 350 nm to 480 nm with a scan rate of 8 nm/s. This rate
corresponds to a time of 17 s per spectrum. pHluorin possesses two excitation maxima
at 396 nm and 468 nm and the ratio 396 nm/468 nm is pH dependent. The chosen
emission wavelength was 505 nm and the intracellular pH was calculated based on a
calibration curve. This curve was determined using cultures of pHluorin expressing
C. glutamicum cells that were treated with 0.25 % CTAB to equalise the inner and outer
pH by uncoupling of the membrane potential. The signal strength is represented in the
measuring voltage applied for signal amplification. Since this parameter interferes with
23
the accuracy of the calculated pH values, an additional correction factor was implicated as well. Usually, a voltage below 800 V was ensured to gain reproducible raw data.
Prior to measurement, the 50 ml cultures were transferred into a 100 ml custom made small bioreactor. The vessel was equipped with inlets for acid and base as well as aeration, and a pH electrode. The temperature was kept at 30 °C with a water jacket.
Cells were lead through a sample loop including a half-micro flow-through quartz glass cuvette (Starna GmbH, Pfungstadt, Germany), which was placed in the spectrometer for fluorescence detection. The remaining time in the loop was 21 s, corresponding to a flow rate of 18 ml/min.
To shift and regulate the external pH, 1 M KH
2PO
4and 1 M K
2HPO
4were used.
Controlling and monitoring of the external pH was performed using a regulation program written by Arthur Reuter from the in-house electronics department. The aeration unit was equipped with a two-way mixing system for ambient air and CO
2, so various CO
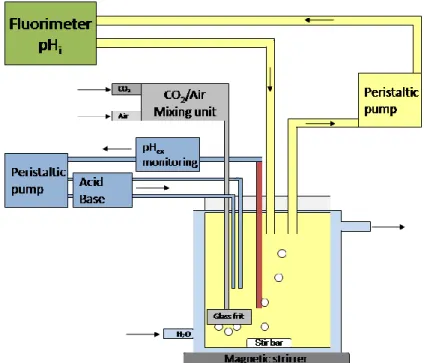
2concentrations could be applied. Optimal mixing and aeration were ensured by a magnet stirrer and a glass frit at the end of the air pipe. Figure 2.2 shows a sketch of the experimental setup.
Figure 2.2: Setup for pHi measurements. The culture is kept in a small bioreactor equipped with aeration, pH control, mixing unit and a water jacket. It enables a constant flow through the sample loop for pHluorin fluorescence detection.
24
The duration of a pH homeostasis measurement was usually 30-40 min. For the first 10 minutes, a stable pH of 7.4 was adjusted before a rapid shift towards an acidic or alkaline pH was performed. After the pH shift, the culture was further monitored for 15- 20 min. The raw data gained from these measurements consist of a number of excitation spectra monitored over time. From each spectrum, the 396 nm and 468 nm intensity values were used to calculate the ratio which then was used to derive the according pH from the calibration curve. Hence, one pH value was monitored every 17 s.
2.5. Protein biochemistry techniques
2.5.1. Gene expression for protein synthesis and cell disruption
To induce overproduction of proteins in C. glutamicum, cells were grown in 50 ml BHI complex medium spiked with 50 mg/l kanamycin and 0.1 mM IPTG for about 16 hours.
After centrifugation, the cell pellet was resuspended in 2 ml buffer containing 50 mMTris*HCl pH 7.4 and 100 mM NaCl. Also, the protease inhibitor “Roche cOmplete Mini, EDTA-free” (Roche Diagnostics Deutschland GmbH, Mannheim, Germany) was added according to manufacturer’s instructions.
Cell disruption was performed with 600 µl of the sample in 1.5 ml screw cap vials with 400 µl glass beads using the homogeniser FastPrep™ (Thermo Scientific, Fisher Scientific Germany GmbH, Schwerte, Germany) at maximum speed for 3 x 45 s. In between the homogenisation steps, cells were chilled on ice for 5 min. To gain crude extracts of the cytoplasm, the samples were centrifuged at 14,000 rpm and 4 °C for 30 min. Further centrifugation of the crude extract in the Optima™ TLX Ultracentrifuge (Beckman Coulter Inc., Brea, CA, USA) at 4 °C and 80,000 rpm in the TLA 120.2 rotor for 20 min was performed to isolate the membrane fraction if desired.
2.5.2 SDS-Polyacrylamide gel electrophoresis (SDS-PAGE)
Prior to gel electrophoresis, the protein concentration of the samples was determined.
For crude extracts, the Bradford method (Bradford, 1976) was applied using the “Roti
NanoQuant
®” reagent (Carl Roth GmbH & Co. KG, Karlsruhe). For samples containing the
isolated membrane fraction, the amino-black-staining (Schaffner & Weissmann, 1973)
25
was used. In both cases, calibration curves were determined using dilutions of Bovine Serum Albumine (BSA).
The denaturing gel electrophoresis was performed based on the protocol described earlier (Laemmli, 1970) with a separation gel matrix containing 12 % acrylamide. The protein amount per sample was about 20-30 µg. Prior to the analysis, samples were mixed with 4x loading buffer (20 % glycerol, 8 % SDS, 400 mM Tris*HCl pH 6.8, 10 mM EDTA, 100 µM ß-mercapto-ethanol, bromo-phenol-blue) and incubated for 5 min at 95 °C. Each gel was prepared in two replicates. After electrophoresis at 175 V, one gel was stained with Coomassie brilliant blue dye for protein visualisation (Sambrook, 1989), while the second one was used for immuno-blotting (Towbin et al., 1979) via Western Blot analysis.
2.5.3 Western blot analysis
Transfer of proteins from the gel matrix to a PVDF membrane (Immobilon P 0.45 µm,
Merck Millipore, Billerica, MA, USA) was conducted using the semi-dry blot method
(Kyhse-Andersen, 1984) at 12 V (~ 70 mA) for 45 minutes. Afterwards, for blocking of
free binding sites, the membrane was incubated in 3 % milk powder diluted in TBS
buffer (50 mM Tris*HCl pH 7.4, 0.9 % NaCl). The same milk powder-buffer was used for
incubation with the mouse-anti-streptag
®antibody (StrepMAB-Classic, Iba GmbH,
Göttingen, Germany; dilution of the antibody 1:10,000) for the detection of the Strep-
tagged proteins. After three washing steps with TBS buffer, incubation with the
secondary antibody (1:10,000 goat-anti-mouse with alkaline phosphatase conjugation,
Sigma-Aldrich, St. Louis, MO, USA) was performed. Both antibodies were incubated for
1 h at room temperature. Visualisation of tagged proteins was based on the reaction of
BCIP with NBT, catalysed by the alkaline phosphatase which results in staining of the
according bands (McGadey, 1970).
26
2.6 Analytical methods
2.6.1 Lysine detection via HPLC analysis
The lysine concentration in the medium supernatant was analysed with the EliteLaChrom System from VWR/Hitachi in combination with the pump system L-2130, the column thermostat 2300 and the fluorescence detector L-2485.
Samples were derivatised using OPA reagent (o-phtaldialdehyde/borate/2-mercapto- ethanol, Thermo Scientific, Fisher Scientific Germany GmbH, Schwerte, Germany) and the resulting fluorescence was detected using an excitation wavelength of 230 nm and an emission wavelength of 450 nm. As reversed-phase pre-column, the Multospher 4x40 mm (CS Chromatographie-Service GmbH, Langerwehe, Germany) was used. The reversed-phase main column was the NucleoDur
®RP18 125x4 mm model (Macherey- Nagel GmbH & Co. KG, Düren, Germany). Elution was performed using a gradient of buffers A (40 mM sodium acetate, 0.06 % sodium azide, 5 % (v/v) methanol/acetonitrile 1:1) and B (50 % acetonitrile, 50 % methanol). Lysine concentrations used for calibration were 10 µM, 50 µM, 100 µM and 250 µM. The peak areas representing the amount of lysine were calculated with the applied HPLC-software.
2.6.2 Determination of osmolality
The osmolality of aqueous solutions was measured with the osmometer “Osmomat 030”
(Gonotec GmbH, Berlin, Germany). Calibration solutions of 0.1-1.2 osmol/kg were used
and samples were analysed as recommended by the manufacturer.
27
3. Results
3.1. The carbonic anhydrase Bca is essential in C. glutamicum
3.1.1 C. glutamicum ∆bca is not able to grow at atmospheric CO
2Basic to the investigations towards the influence of the ß-type carbonic anhydrase Bca was confirmation of the C. glutamicum ∆bca growth phenotype (Mitsuhashi et al., 2004) also in the C. glutamicum ∆bca Kyowa Hakko strain. For this purpose, the deletion mutant was compared to the C. glutamicum ATCC 13032 wild type strain at various CO
2concentrations on solid BHI medium. The results displayed in Figure 3.1 confirm the growth phenotype. At atmospheric 0.04 % CO
2, the C. glutamicum ∆bca strain is not able to grow. As displayed in Figure 3.1, this growth deficit can be overcome by elevated CO
2levels in the supply air.
Figure 3.1: Growth of C. glutamicum wild type and ∆bca on solid BHI complex medium. Since both strains were equipped with a pEKEx2_EYFP plasmid, 50 µg/ml kanamycin were added to the medium for selection. Displayed is the growth at 30 °C after 16 h incubation at 10 % CO2 (left) and 0.04 % CO2 (right). (a), (b), (c): three replicates of the C. glutamicum ∆bca strain, (d): C. glutamicum wild type.