Research Collection
Master Thesis
Heuristics for the design of low-carbon districts in the tropics
Author(s):
Bosova, Anastasiya Publication Date:
2020-06-15 Permanent Link:
https://doi.org/10.3929/ethz-b-000448508
Rights / License:
In Copyright - Non-Commercial Use Permitted
This page was generated automatically upon download from the ETH Zurich Research Collection. For more information please consult the Terms of use.
Anastasiya Bosova
Heuristics for the design of low-carbon districts in the tropics
Master Thesis
ITA – Architecture and Building Systems Swiss Federal Institute of Technology (ETH) Zurich
Examiner:
Prof. Dr. Arno Schl¨uter Supervisor:
Dr. Jimeno Fonseca Singapore, June 15, 2020
Abstract
Low-carbon urban design strategies suggest that energy performance of a district can be influenced by altering the urban form. Such strategies are the most effective at the early stages of low-carbon development projects. However, there exists a lack of early-stage design heuristics for urban practitioners, addressing parameters that largely influence energy performance of a district. The literature quantifying the interdependence be- tween urban design parameters and energy performance at the district level is limited.
The current study aims to fill in this knowledge gap by exploring relationships and quantifying trade-offs between district energy performance and such design parameters as typology, land use, density, district compactness and site coverage. About 10’000 energy simulations are conducted to assess the performance of various district designs in the tropical context of Singapore, considering high-density mixed-use urban setting.
The simulation results are analyzed using statistical techniques (ANOVA, regression) to derive design heuristics with respect to studied design parameters, in order to inform decision-makers in the early urban design stages.
The regression model shows that the variability of carbon and energy performance is mostly explained by land use mix: changing land use from mostly retail to mostly res- idential would decrease the operational CO2-intensity by a factor of two. The impact of density is much smaller but statistically significant: a decrease in the floor area ratio from ten to four reduces the operational CO2-intensity by 8%. The influence of district compactness as well as typology is negligible (below 2% impact on the operational CO2- intensity).
Increasing the accuracy of the energy simulation and adopting more realistic district designs can be considered as immediate further extensions to this research. The frame- work developed in this study can serve as a basis for future energy-driven urban design studies.
Acknowledgements
In the beginning of a thesis you don’t know what to do, later – how to do it, and finally – how to do it in time. I would like to express my gratitude to those people who have assisted me along this bumpy but exciting road.
First and foremost, my supervisor Dr. Jimeno Fonseca, a brilliant researcher with a heart full of curiosity and a head full of inspiring ideas. His expertise helped to lay a foundation of this work and guided me through it. Every talk with him would lift me up and inspire to push forward. I am incredibly lucky to have been supervised by such talented and motivating person.
Next, I would like to express my gratitude to Prof. Dr. Arno Schl¨uter for giving me a chance to pursue my thesis in Singapore and providing an exciting topic for it. He supported and encouraged me during the important milestones of this thesis, as well as contributed with a valuable feedback. Moreover, Prof. Schl¨uter is a person who in- spired me to pursue Master in Integrated Building Systems 4 years ago, after I visited his lecture ”Energy in Buildings” as a Bachelor student in Environmental Engineering.
From that point in time, my fascination with Architecture and Building Systems was sparked. Having a chance to re-read my motivation letter recently, I found out that I was applying for this Master program with a clear goal in mind: to pursue my thesis in Singapore, at the Future Cities Laboratory (FCL), being a part of the MuSES project.
After I was accepted, I completely forgot about this goal but life has led me to this point anyway. It is truly fascinating – dreams come true if they are meant to come true.
I am very grateful to the whole MuSES team – Zhongming Shi, Gabriel Happle, Shan- Shan Hsieh – for their helpful input and feedback. Especially, many thanks to Zhongming for sharing his knowledge of energy-driven urban design. Next, I would like to thank Kateryna Konieva who helped to generate my first geometries. Also many thanks to Dr. Aurel von Richthofen for providing me with insights into Singapore-specific urban practice and giving competent feedback on the experimental design of this study. Fi- nally, I’d like to thank Reynold Mok who helped to make my thousands of simulations run smoothly.
Special thanks to Emanuel Riegelbauer, my class- and flatmate, for being my sparring partner during the lockdown, when both of us appeared to be locked at our Singaporean home with the thesis projects. Our intellectual discussions definitely enriched this work.
Finally, I would like to express endless gratitude to my fianc´e, Dimitar Popov, who supported and encouraged me not only during this thesis, but whole period of my stud- ies at ETH. Without him it wouldn’t have been possible to reach this point. Thank you for always believing in me and sitting through the late nights by my side.
Contents
List of Acronyms . . . vi
List of Figures . . . ix
List of Tables . . . xi
1 Introduction 1 1.1 Motivation and problem statement . . . 1
1.2 Objectives of Research . . . 2
1.3 Thesis Outline . . . 2
2 Literature Review 3 2.1 Low-carbon urban design guidelines . . . 3
2.1.1 Guidelines for low-carbon or low-energy city planning . . . 3
2.1.2 Guidelines for high environmental quality . . . 4
2.1.3 Performance indicator frameworks . . . 5
2.1.4 Examples of low-carbon development projects . . . 5
2.1.5 Low-carbon urban design guidelines: Summary . . . 6
2.2 Energy-driven urban design . . . 7
2.2.1 Definition . . . 7
2.2.2 Energy-driven urban design constraints: State-of-the-art . . . 7
3 Methodology 13 3.1 Context . . . 13
3.1.1 Climate conditions . . . 13
3.1.2 Urban setting . . . 13
3.2 Experimental design . . . 14
3.2.1 Scenario parameter matrix . . . 14
3.2.2 Workflow . . . 19
3.2.3 District designs . . . 19
3.3 Energy performance simulation . . . 28
3.4 Data analysis . . . 31
3.4.1 Energy and carbon performance assessment . . . 31
3.4.2 Statistical analysis . . . 32
4 Results 34 4.1 Case Study 1 . . . 34
4.1.1 One-way ANOVA . . . 34
4.1.2 Two-way ANOVA . . . 42
4.1.3 Regression . . . 55
4.2 Case Study 2 . . . 61
4.3 Case Study 3 . . . 65
5 Discussion 68
5.1 Relationship between urban form and performance indicators . . . 68
5.1.1 Land use mix . . . 68
5.1.2 Density . . . 68
5.1.3 District compactness . . . 69
5.1.4 Typology . . . 69
5.1.5 Height profile . . . 71
5.1.6 Site coverage . . . 71
5.1.7 Best-performing scenarios . . . 72
5.2 Heuristics for the design of low-carbon districts . . . 73
5.2.1 Explanatory power of the regression model . . . 73
5.2.2 Use cases . . . 73
5.3 Limitations and future studies . . . 74
6 Conclusion 77
Appendices 78
A Literature Review 79
B Methodology 83
C Results 100
List of Acronyms
ABS Absolute
AC Air Conditioning ANOVA Analysis Of Variance
BCA Building And Construction Authority BCL Building Cell Length
BH Building Height CEA City Energy Analyst COP Coefficient Of Performance DCS District Cooling System EUI Energy Use Intensity
EDUD Energy-Driven Urban Design
FA Floor Area
FAR Floor Area Ratio
GIS Geographic Information System GFA Gross Floor Area
HVAC Heating, Ventilation, Air-Conditioning HDB Housing And Development Board NTU Nanyang Technological University
NE North-East
NW North-West
NOF Number Of Floors
OFF Office
PV Photovoltaic
PI Proportional Integral
%RES Renewable Energy Share RES Residential
RET Retail
SC Site Coverage
SE South-East
SoW South-West
STD Standard
SW Street Width
TOD Transit-Oriented Development URA Urban Redevelopment Authority WWR Window-to-wall ratio
List of Figures
2.1 Examples of TOD: Density is focused around a transit corridor [1]. . . 4 2.2 A model of simulation based urban form generation and optimization
modeling for energy-driven urban design [2]. . . 8 2.3 Three categories of typological methods (a) generic targets with repetitive
contexts, (b) actual built form for both targets and contexts; and (c) hybrid targets with repetitive contexts [3,4,5,6]. . . 10 3.1 Scenario parameter matrix (full version in the Appendix, Figure B.1). . . 14 3.2 Central areas of Singapore and Macau. . . 15 3.3 Examples of the building footprints in the dense districts of Singapore:
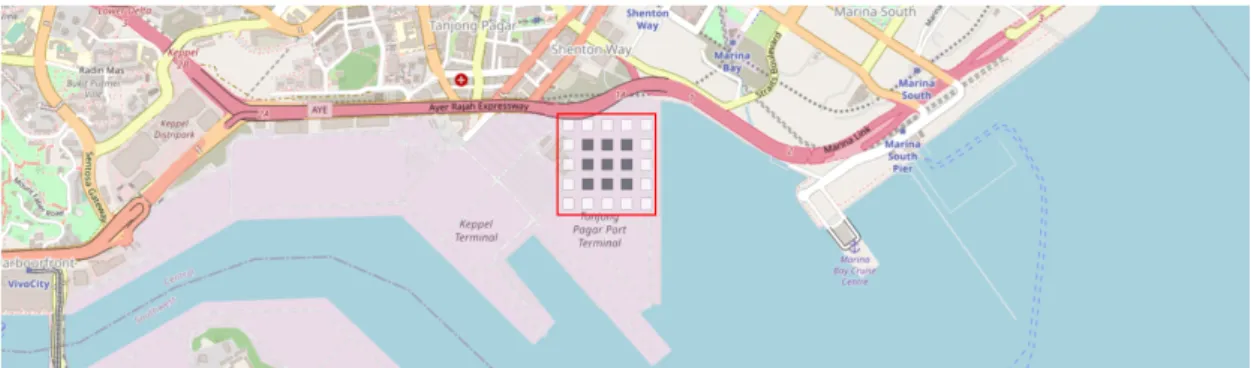
Tampines, Jurong Lakeside and One-North (from left to right) [7]. . . 16 3.4 Hypothetical district location: Tanjong Pagar, Singapore. Dark-grey:
target buildings. White: surroundings. [8,9] . . . 20 3.6 Building cell: building footprint area calculation. . . 20 3.5 Case Study 1: District designs with homogeneous height profile, examples
for FAR = 10 and SW = 15.4 m. Dark-grey: target buildings. Light-grey:
surroundings. . . 21 3.7 District design for different FAR. . . 22 3.8 District design for constant FAR, but different street widths. . . 22 3.9 Case Study 2: District designs with heterogeneous height profile for square
typology. Highest buildings marked in yellow. . . 26 3.10 District design for constant FAR and street width, but different site cov-
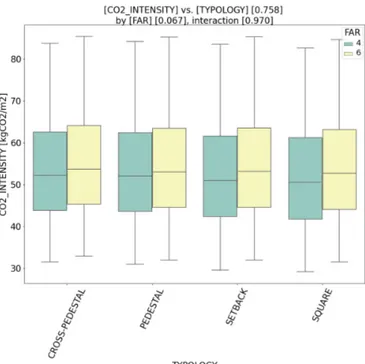
erages. . . 27 4.1 Boxplots for land use mix vs. performance indicators. Annualized values. 35 4.2 Boxplots for typology vs. performance indicators. Annualized values. . . . 37 4.3 Boxplots for FAR vs. performance indicators. Annualized values. . . 38 4.4 Boxplots for street width vs. performance indicators. Annualized values. . 39 4.5 Comparison of annual PV generated electricity between square and cross
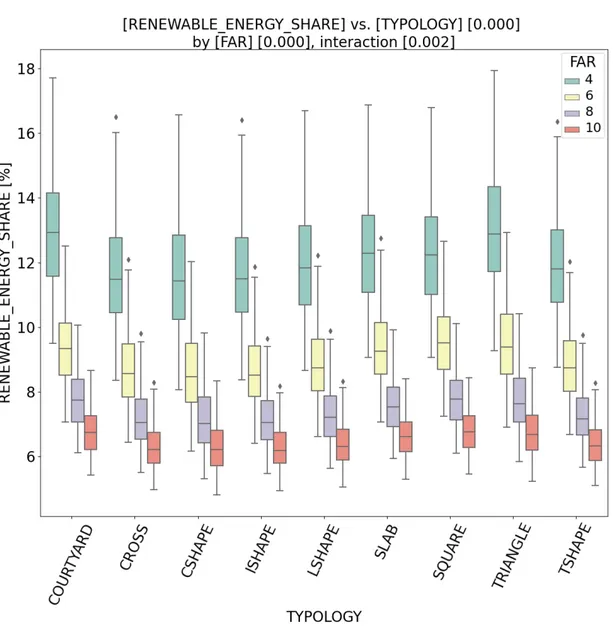
typologies for different FAR and SW. . . 40 4.6 Two-way ANOVA. Absolute CO2-emissions vs. land use grouped by FAR. 42 4.7 Two-way ANOVA. Renewable energy share vs. typology grouped by FAR. 43 4.8 Two-way ANOVA. Renewable energy share vs. FAR grouped by street
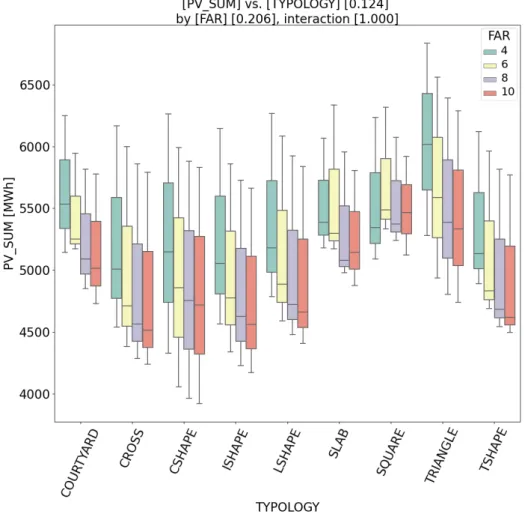
width. . . 44 4.9 Two-way ANOVA. PV potential vs. typology grouped by street width. . . 45 4.10 Two-way ANOVA. PV generated electricity vs. typology grouped by FAR. 46 4.11 Comparison of annual PV generated electricity for ”multilevel” typologies
for different FAR and SW. . . 47
4.12 Comparison of ”multilevel” typologies and square for CO2-intensity. FAR-
based view. Annualized values. . . 48
4.13 Comparison of ”multilevel” typologies and square for CO2-intensity. SW- based view. Annualized values. . . 48
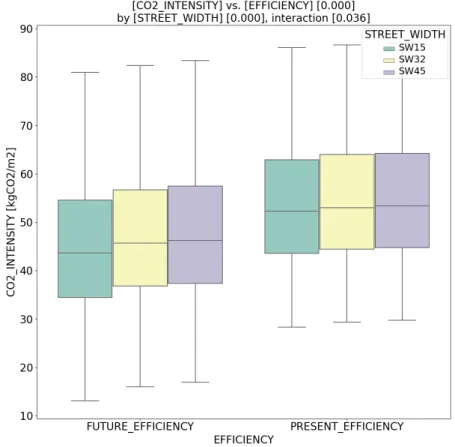
4.14 Impact of increased PV cell efficiency on CO2-intensity: typology-based view. . . 49
4.15 Impact of increased PV cell efficiency on CO2-intensity: SW-based view. . 50
4.16 Impact of increased PV cell efficiency on CO2-intensity: FAR-based view. 50 4.17 Sun path for Singapore (a) and Bangkok (b) created with help of Grasshop- per [10,11]. . . 52
4.18 Impact of location change on the annual PV potential of square typology. 52 4.19 Impact of location change on PV potential: FAR-based view. . . 53
4.20 Impact of location change on renewable energy share: FAR-based view. . 54
4.21 Impact of location change on CO2-intensity: FAR-based view. . . 54
4.22 Boxplots for different height profiles vs. performance indicators. Annual- ized values. . . 62
4.23 Influence of typology, FAR and SW on CO2-intensity (left) and PV po- tential (right) of different height profiles. Annualized values. . . 64
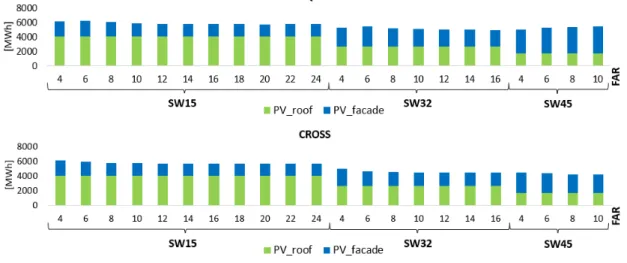
4.24 Case Study 3: Breakdown of annual PV potential for different FAR and SW. . . 65
4.25 Boxplots for different site coverages vs. performance indicators. Annual- ized values. . . 66
A.1 Generic typologies used by Natanian et al. [4]. . . 79
A.2 Experimental design of Martins et al. [12]. . . 80
A.3 District shapes from the study of Kaempf et al. [13]. . . 80
A.4 Generic building patterns used by Shi et al. [6]. . . 81
A.5 Adapted for Singapore, generic building patterns used by Shi et al. [6]. . . 81
A.6 Generic block typologies used by Zhang et al. [14]. . . 82
A.7 Vernacular building typologies of Macau [15]. . . 82
B.1 Full scenario parameter matrix for one typology. . . 84
B.2 Examples of building typologies in Singapore [16,17,18,19]. . . 85
B.3 Examples of building typologies in Singapore [20,21,22,23,24]. . . 86
B.4 Examples of building typologies in Singapore [25,26]. . . 87
B.5 Dimensions of the building footprints. . . 88
B.6 Dimensions of the building footprints for typologies with podium. . . 89
B.7 Downtown Core, existing development. Corona shape: towers surround a market [7]. . . 93
B.8 Marina Bay, planned development [27]. Stairs shape. . . 93
B.9 Orchard Road. Pyramid shape with apex on the edge [7]. . . 94
C.1 Final energy use intensity. Square typology, SW15, FAR = 4, RES:RET:OFF = 0.6:0.1:0.3. . . 100
C.2 Final energy use intensity. Square typology, SW15, FAR = 10, RES:RET:OFF = 0.6:0.1:0.3. . . 100
C.3 Final energy use intensity. Square typology, SW45, FAR = 4, RES:RET:OFF = 0.6:0.1:0.3. . . 101
C.4 Final energy use intensity. Triangle typology, SW15, FAR = 4, RES:RET:OFF = 0.6:0.1:0.3. . . 101
C.5 Boxplots for FAR≤16 (SW45 exluded) vs. performance indicators. An-
nualized values. . . 102
C.6 Boxplots for FAR≤24 (SW32, SW45 exluded) vs. performance indicators. Annualized values. . . 103
C.7 Comparison of annual PV generated electricity for different typologies, FAR and SW. . . 104
C.8 Two-way ANOVA. Energy use vs. land use mix grouped by FAR. . . 105
C.9 Two-way ANOVA. Renewable energy share vs. land use mix grouped by FAR. . . 105
C.10 Two-way ANOVA. Absolute CO2-emissions vs. FAR grouped by street width. . . 106
C.11 Two-way ANOVA. Energy use vs. FAR grouped by street width. . . 106
C.12 Two-way ANOVA. Renewable energy share vs. typology grouped by street width. . . 107
C.13 Two-way ANOVA. CO2-intensity vs. typology grouped by street width. . 107
C.14 Two-way ANOVA. Absolute CO2-emissions vs. typology grouped by street width. . . 108
C.15 Two-way ANOVA. Energy use vs. typology grouped by street width. . . . 108
C.16 Two-way ANOVA. Absolute CO2-emissions vs. land use mix grouped by typology. . . 109
C.17 Comparison of ”multilevel” typologies and square for CO2-intensity. FAR- based view (FAR less than 14, SW15). Annualized values. . . 110
C.18 Impact of increased PV cell efficiency on absolute CO2-emissions: typology- based view. . . 111
C.19 Impact of increased PV cell efficiency on absolute CO2-emissions: street width based view. . . 111
C.20 Impact of increased PV cell efficiency on absolute CO2-emissions: FAR- based view. . . 112
C.21 Impact of increased PV cell efficiency on renewable energy share: typology- based view. . . 112
C.22 Impact of increased PV cell efficiency on renewable energy share: street width based view. . . 113
C.23 Impact of increased PV cell efficiency on renewable energy share: FAR- based view. . . 113
C.24 Impact of location change on PV potential: SW-based view. . . 114
C.25 Impact of location change on renewable energy share: SW-based view. . . 114
C.26 Impact of location change on renewable energy share: SW-based view. . . 115
C.27 Impact of location change on CO2-intensity: land use based view. . . 115
C.28 Regression: predicted vs. actual values for Model 1. . . 116
C.29 Regression: predicted vs. actual values for Model 2. . . 117
C.30 Total annual PV potential of various heterogeneous height profiles. . . 123
C.31 Annual PV potential on the roofs of various heterogeneous height profiles. 123 C.32 Annual PV potential on the facades of various heterogeneous height profiles.124 C.33 Influence of typology, FAR and SW on energy use (left) and EUI (right) of different height profiles. Annualized values. . . 125
C.34 Influence of typology, FAR and SW on renewable energy share (left) and absolute CO2-emissions (right) of different height profiles. Annualized values. . . 126
List of Tables
3.1 Architecture database: input values. . . 29 3.2 Air-conditioning database: input values. . . 30 4.1 Regression coefficients for Model 1. Performance indicator: CO2-intensity
[kgCO2/m2/a]. Baseline: square typology, SW15, FAR=4, BALANCED land use. . . 56 4.2 Regression coefficients for Model 1. Performance indicator: absolute CO2-
emissions [tCO2/a]. Baseline: square typology, SW15, FAR=4, BAL- ANCED land use. . . 57 4.3 Regression coefficients for Model 1. Performance indicator: EUI [kWh/m2/a].
Baseline: square typology, SW15, FAR=4, BALANCED land use. . . 58 4.4 Regression coefficients for Model 1. Performance indicator: Energy use
[MWh/a]. Baseline: square typology, SW15, FAR=4, BALANCED land use. . . 59 4.5 Regression coefficients for Model 1. Performance indicator: Renewable en-
ergy share [%]. Baseline: square typology, SW15, FAR=4, BALANCED land use. . . 60 B.1 Dimensions of a single building contained in the district from the case
study 1, for SW = 15.4 m. . . 89 B.2 Dimensions of a single building contained in the district from the case
study 1, for SW = 31.8 m. . . 89 B.3 Dimensions of a single building contained in the district from the case
study 1, for SW = 45.4 m. . . 90 B.4 Dimensions of pedestal and cross-pedestal typologies from the case study
1, for SW = 15.4 m. . . 90 B.5 Dimensions of pedestal and cross-pedestal typologies from the case study
1, for SW = 31.8 m. . . 90 B.6 Dimensions of pedestal and cross-pedestal typologies from the case study
1, for SW = 45.4 m. . . 91 B.7 GFA of different segments of setback building typology. . . 91 B.8 Dimensions of three segments of setback typology from the case study 1,
for SW = 15.4 m. . . 91 B.9 Dimensions of three segments of setback typology from the case study 1,
for SW = 31.8 m. . . 91 B.10 Dimensions of three segments of setback typology from the case study 1,
for SW = 45.8 m. . . 92 B.11 Centered pyramid: number of floors for different height categories. . . 95
B.12 Pyramid shape with apex on the edge: number of floors of for different
height categories. . . 95
B.13 Stairs shape: number of floors for different height categories. . . 95
B.14 Corona shape: number of floors for different height categories. . . 95
B.15 Centered pyramid: building heights for different height categories. . . 96
B.16 Pyramid shape with apex on the edge: building heights of for different height categories. . . 96
B.17 Stairs shape: building heights of for different height categories. . . 96
B.18 Corona shape: building heights of for different height categories. . . 96
B.19 Dimensions of a single building contained in the district from the case study 3, for site coverage 0.7. . . 97
B.20 Dimensions of a single building contained in the district from the case study 3, for site coverage 0.9. . . 97
B.21 Indoor comfort database: the CEA default values for various building uses [8]. . . 97
B.22 Internal loads database: the CEA default values for various building uses [8]. . . 98
C.1 Regression coefficients for Model 2. Performance indicator: CO2-intensity [kgCO2/m2/a]. Baseline: square typology, SW15, FAR=4, RES:RET:OFF = 0.3:0.4:0.3. . . 118
C.2 Regression coefficients for Model 2. Performance indicator: absolute CO2- emissions [tCO2/a]. Baseline: square typology, SW15, FAR=4, RES:RET:OFF = 0.3:0.4:0.3. . . 119
C.3 Regression coefficients for Model 2. Performance indicator: EUI [kWh/m2]. Baseline: square typology, SW15, FAR=4, RES:RET:OFF = 0.3:0.4:0.3. . 120
C.4 Regression coefficients for Model 2. Performance indicator: Energy use [MWh/a]. Baseline: square typology, SW15, FAR=4, RES:RET:OFF = 0.3:0.4:0.3. . . 121
C.5 Regression coefficients for Model 2. Performance indicator: Renewable en- ergy share [%]. Baseline: square typology, SW15, FAR=4, RES:RET:OFF = 0.3:0.4:0.3. . . 122
C.6 Case Study 3. Performance indicators for site coverage = 0.45. . . 127
C.7 Case Study 3. Performance indicators for site coverage = 0.70. . . 127
C.8 Case Study 3. Performance indicators for site coverage = 0.90. . . 127
Introduction
1.1 Motivation and problem statement
More than 50% of the world’s population resides in urban areas. This percentage is expected to grow to more than 70% by 2050, with a particular growth occurring in the cooling-dominated regions of Asia. Nowadays cities are estimated to cause over 70% of global carbon dioxide emissions, the building sector being responsible for more than a half of those. In order to meet global climate goals stated in the Paris Agreement, the energy intensity of the building sector needs to improve on average by 30% by 2030.
To follow this trajectory of a sustainable development, low carbon solutions are to be deployed in the way cities are designed and operated. [28,29,30]
Despite emerging need for planning low-carbon cities, there exists a lack of low-carbon urban design guidelines as argued in several recent studies. Li et al. [15] claimed, that en- ergy performance research and its connection to urban design parameters, as well as the related guidelines had not been heavily addressed in literature. Hachem-Vermette et al.
[31] stated, that comprehensive design guidelines are lacking specifically in the domain of high-energy performance mixed-use neighbourhoods. Additionally, the importance for architects to have a guidance, such as which design parameters can potentially in- fluence building energy performance in their urban district, has been demonstrated by Samuelson et al. [32] in the context of high-rise multifamily housing in megacities.
Urban design not only affects the energy performance of the buildings, but also in- fluences the performance of energy supply systems. For example, the potential of har- vesting solar energy on the building facades is constrained in the high-density compact areas, where tall buildings cause significant amount of shading on other building surfaces [2]. Energy-driven urban design is a recently introduced concept that addresses such in- teractions between the urban form and the energy supply systems, aiming to decrease energy demand and achieve higher energy performance i.e. increase the efficiency of the energy system as well as enhance the renewable energy share. It mostly operates at the district scale. However, given the novelty of this research field, the studies that quantify energy performance and carbon emissions at the district level are still limited. Since the quantification of this relationship is lacking, the knowledge is insufficient to derive design heuristics. [2,15,31]
Such heuristics addressing design parameters, that make a large impact on district energy performance, would be helpful for urban practitioners at the early design stages of low- carbon projects, when energy-driven design strategies are the most effective [31,32,33].
Design heuristics would facilitate early design stages in several ways [34]:
• Providing shortcuts or rules-of-thumb, that would help urban practitioners to nav- igate in the problem space in order to achieve low-carbon solutions for the project;
• Limiting the range of possible favorable solutions, and therefore eliminating the
need for exhaustive search;
• Providing quantification of energy performance and operational carbon emissions of district for different sets of input design parameters, that could be used for benchmarking.
1.2 Objectives of Research
The objectives of this thesis are:
1. Quantify the effects of urban design parameters on the operational carbon emis- sions of district energy systems in Singapore.
2. Derive heuristics for the design of low-carbon districts in a tropical climate.
1.3 Thesis Outline
Following the introduction, the second chapter contains a literature review consisting of 2 sections. The first section studies existing design guidelines for low-carbon or low- energy districts. The second section addresses the concept of the energy-driven urban design. It also investigates the existing classifications of urban form and reviews the studies of energy-driven urban design that are using building or block typologies.
The third chapter addresses the methodology of the current study, explaining exper- imental design as well as the workflow used in the experiment. In particular, energy simulation and the assumptions behind the models are addressed.
The results of the experiments are presented in the fourth chapter, followed by the discussion and the conclusions.
Literature Review
2.1 Low-carbon urban design guidelines
The lack of low-carbon urban design guidelines has been argued in several recent stud- ies. Li et al. [15] claimed, that energy performance research and its connection to urban design parameters, as well as the related guidelines had not been heavily addressed in literature. Hachem-Vermette et al. [31] stated, that comprehensive design guidelines are lacking specifically in the domain of high-energy performance mixed-use neighbour- hoods. Additionally, the importance for architects to have a guidance, such as which design parameters can potentially influence building energy performance in their urban district, has been demonstrated by Samuelson et al. [32] in the context of high-rise mul- tifamily housing in megacities. It was suggested to use parametric simulation techniques to examine various potential design combinations in order to create pre-simulated design guidelines [32].
The first part of the literature review aimed to support or to reject the aforementioned statements by undertaking an extensive literature search using Google Scholar search en- gine [35]. The following keywords were used: low-carbon design, low-carbon urban design guidelines, low-carbon urban design, low-carbon city/neighbourhood/district, low-energy urban design guidelines, sustainable urban design guidelines and similar combinations of these terms.
As a result of the search, the reviewed literature could be divided into the following categories:
1. Urban design guidelines for low-carbon or low-energy cities/districts/development projects (Section 2.1.1);
2. Urban design guidelines to enhance environmental quality/resilience/outdoor com- fort in the cities (Section 2.1.2);
3. Indicator frameworks to evaluate carbon performance, sustainability or environ- mental quality performance of cities/districts/development projects (Section 2.1.3);
4. Examples of low-carbon development projects (Section 2.1.4).
2.1.1 Guidelines for low-carbon or low-energy city planning
There were only few sources found, that address low-carbon city planning in form of guidelines in one or another way. All of them geographically relate either to China [1,36,37] or to India [38,39], and introduce general approaches to low-carbon city plan- ning on a conceptual level.
These approaches include deployment of renewable energy technologies, energy conser- vation codes for buildings, reduction of building energy demand by incorporating passive solar design techniques, increase in energy efficiency of lighting, heating, ventilation and air-conditioning systems (HVAC) and so on [36,37,39]. These methods are discussed on
(a) Curitiba, Brazil (b) Guangzhou, China
Figure 2.1: Examples of TOD: Density is focused around a transit corridor [1].
a conceptual level, without giving a step-by-step guidance for early urban design stages.
With regard to urban form, in the reviewed guidelines it is only considered from one perspective namely as an important factor for CO2-emissions reduction in mobility sec- tor. With this goal, the concept of Transit-Oriented Development (TOD) is introduced [1,37]. The idea is to shorten trip lengths by creating the urban environment that pro- motes combining multiple destinations into one trip. This can be achieved by creating mixed-use and walkable districts, while concentrating density at major transit stations or corridors (Figure 2.1). The small mixed-use blocks are preferred to the typical single- use zones to increase pedestrian comfort and reduce the kilometers driven per capita.
Additionally, reduction in CO2-emissions associated with transportation can be achieved by limiting urban sprawl, as stated in Indian guidelines for low-carbon cities [38, 39].
Compact cities enable shorter trips, that can be taken by walking and cycling, and offer viability for public transport.
As for Singapore-related guidelines, the Building and Construction Authority (BCA) of Singapore issued a technology roadmap for super low energy buildings. The roadmap was focused on building level and examined a wide spectrum of emerging energy technolo- gies, exploring their feasibility in the tropical and dense urban context of Singapore. The strategies included passive measures to reduce building energy demand, active measures such as highly efficient HVAC systems, smart energy management systems to control the appliances, and deployment of renewable energy technologies with focus on PV. It was concluded that low-rise institutional buildings and schools have the highest potential to achieve zero or positive energy target. [40]
2.1.2 Guidelines for high environmental quality
In contrary to the reviewed guidelines for low-carbon city planning, some of the studied environmental quality guidelines contain quantitative description of the proposed ap- proaches. The quantitative guidelines are given in the form of simple ratios and indexes.
For example, sustainable building design guidelines for Hong Kong quantify building separation, building setback and site coverage of greenery to facilitate early designs of development proposals [41]. The objectives are to achieve better air ventilation, enhance
the environmental quality of urban areas, provide more greenery and mitigate the heat island effect. These points, with a focus on urban heat island effect mitigation, were also addressed in a catalogue of strategies to improve outdoor comfort in Singapore [42]. The proposed strategies not only enhance environmental quality, but also aim to mitigate climate change effects by reducing energy consumption and therefore carbon emissions of the urban areas. For example, mixed-use neighbourhoods are recommended to flatten the curve of district energy demand and to ensure higher efficiency of energy supply systems.
There also exist urban design guidelines, that specifically address resiliency of urban areas and treat the negative impacts of climate change on the cities. Climate resilience guidelines of New York aim to protect the city from climate change related hazards such as sea level rise and temperature increase. For instance, it is recommended to enhance outdoor comfort by increase the solar reflectance of surfaces by utilizing light-colored pavement, coatings and materials, in combination with shading [43]. Another example of such guidelines originates from Ho Chi Minh City in Vietnam, aiming to adapt the city to the climate change impact [44]. The proposed measures are divided into 4 sectors: ur- ban climate, urban flooding, urban energy and urban transport. As for the urban energy, very general strategies such as active energy generation with neighborhood-integrated photovoltaics are proposed.
2.1.3 Performance indicator frameworks
Some of the reviewed studies attempted to create holistic frameworks in order to evalu- ate low-carbon performance or sustainability in the cities.
Based on a comprehensive literature review and interviews with professionals, an indi- cator framework was proposed for Hong Kong and included such factors as: access to work, green design, building form and quality of building development, among others [45]. Particular attention was paid to urban design parameters such as density and height profile of the buildings, to avoid canyon effect that traps heat within the narrow spaces between the buildings.
Another framework attempted to introduce a holistic low-carbon city indicator system, providing weighing factors and benchmarking values for each parameter based on a lit- erature review [46]. The following indicators were included: proportion of renewable energy [%], energy intensity [MJ/USD], CO2-emissions intensity [ton/person], carbon productivity [USD/ton of CO2-emissions] etc.
2.1.4 Examples of low-carbon development projects
The last group of the reviewed studies provided examples of planned or existing low- carbon districts in Asia. The examples included the Kai Tak Development in Hong Kong [47], Wuxi [48] and Hongqiao Business Community [49] in China. The description of the projects included the general strategies, the selected technologies and the urban form in terms of its impact on the transportation. Same concepts were deployed as dis- cussed in Sections 2.1.1 and 2.1.2: TOD, compact urban form, on-site renewable energy generation, highly efficient household appliances, enhanced pedestrian comfort and so on.
Taking more detailed look at the Kai Tak Development in Hong Kong, the following low carbon features of this neighbourhood are to be mentioned [47]:
1. Neighbourhoods that promote walking: high level of connection with surrounding neighbourhoods, car-free central square, open space besides the harbour.
2. Priority to bicycle networks.
3. High-quality transit: various transport infrastructure including railway, roads, tun- nel.
4. Mixed-use neighbourhoods: land use fulfilling various purposes including commer- cial, residential, institution, government etc.
5. Density matched to transit capacity.
6. Compact regions with short commutes.
Listed low-carbon features mostly refer to the mobility, meaning that urban form was considered only from the perspective of CO2-emissions reduction associated with trans- port, following concept of the TOD. Additionally, district cooling system was deployed in the Kay Tak Development, whereas all non-domestic buildings such as hotels, hospi- tals, shopping centres and government offices must connect to it [50].
Also in Hongqiao Low-Carbon Business Community urban form was only considered from the mobility perspective. The goal was to promote pedestrian comfort, bicycle networks and reduce overall commute [49].
The strategies for Wuxi development followed multi-scale approach from building sys- tems selection to power generation technologies, in order to reach 50% reduction of Wuxi’s carbon emissions. Urban form was not explicitly mentioned. Selected technolo- gies included [48]:
1. Power generation, heating and cooling: combined heat and power plants with biomass utilization, photovoltaic energy generation, heat pumps, passive cooling.
2. Building level: passive house and plus energy house design, LED lighting with daylight sensors, ventilation system with heat recovery.
3. Transport sector: electric vehicles, natural gas optimized engines, optimization of public transport flow.
4. Industry sector: efficient motors and burning systems, waste heat recovery, low carbon cement etc.
2.1.5 Low-carbon urban design guidelines: Summary
To sum up, the reviewed literature barely provided any quantified guidelines for early urban design stages. The existing low-carbon guidelines rather discuss and introduce general strategies on a very conceptual level, without giving a step-by-step guidance and providing heuristics for the urban practitioners. Some of the guidelines that address environmental quality of urban spaces have a higher level of detail, however, they are not directly aiming to optimize carbon performance of the development projects. More- over, urban form is only considered as a factor that influences CO2-emissions associated with mobility. To conclude, the lack of low-carbon urban design guidelines could be con- firmed. Additionally, the relation between the urban design parameters and the energy performance of the buildings was clearly underexplored in the reviewed literature.
2.2 Energy-driven urban design
The goal of this section is to introduce the concept of energy-driven urban design, focus- ing on the researched interdependencies between urban design parameters and energy performance. The studies with the building or block typologies are of particular interest to investigate existing classification systems for urban form. This section serves as a knowledge basis to develop the methodology of the current research project.
2.2.1 Definition
The concept of the energy-driven urban design was first defined in 2017 by Shi et al. [2].
Energy-driven urban design aims to provide urban configurations that decrease energy demand, while considering interdependencies between the energy systems and the ur- ban form for higher energy performance. The energy performance is a general concept that refers to the efficiency and the cost of the energy systems as well as the attained renewable energy ratio and the caused carbon emissions. The links between urban form and energy demand as well as the urban energy supply system are generalized as energy- driven urban design constraints. These constraints can be divided into active and passive ones. For example, passive energy-driven urban design constraints refer to the strategies such as orientation of the building to decrease the solar gain and the cooling demand of the building. Active constraints aim to increase the efficiency of the energy systems by manipulating the urban form: for instance, to maximize PV potential the district orientation must be changed.
Figure 2.2 shows a model proposed by Shi et al. of a simulation-based urban form gener- ation and optimization for energy-driven urban design at the district scale.It comprises a Data Collection step to define input design parameters, a Generation step to generate design prototype(s) and an Optimization step that couples energy simulation with an optimization. A potential software tool for such workflow was suggested to be the City Energy Analyst (CEA) [8].
The model, especially the Generation step, strongly relies on the energy-driven urban de- sign constraints, hence it is important to have an understanding of the interdependencies between the urban form and energy systems. [2]
2.2.2 Energy-driven urban design constraints: State-of-the-art
The existing research on energy-driven urban design (EDUD) constraints, namely the interdependencies between the urban form and energy systems performance, was re- cently extensively reviewed by Natanian et al. [4] and Shi et al. [6]. Additionally, further literature search was undertaken using following keywords and their combina- tions: energy-driven urban design, urban form, urban morphology, building/block typol- ogy, density, energy performance, energy demand, solar energy/potential, correlation, interrelation, interdependence. Within this research, there are two themes that are of a great importance for the development of the current study’s methodology:
1. The interdependencies between urban design parameters or typological parameters and energy performance of the buildings/districts.
2. The typological models and existing classification systems of the urban form used in the studies.
Figure 2.2: A model of simulation based urban form generation and optimization mod- eling for energy-driven urban design [2].
Interdependencies between urban design parameters and energy performance In 2019, Natanian et al. [4] reviewed 50 recent studies on the correlation between urban form indicators and environmental performance metrics. These included:
• Typological design parameters: shape factor, floor area ratio (FAR), site coverage, orientation.
• Urban design parameters: sky view factor, height-to-width (or aspect ratio), street width (or distance between the buildings), average building height.
• The environmental performance metrics: energy demand, PV generation, solar thermal yield, solar irradiation, daylight, wind flow, outdoor thermal comfort and urban heat island intensity.
The review of Natanian et al. [4] concluded, that the FAR and the building orientation were the most commonly used. Since one FAR can either correspond to a high-rise tower or to a low-rise perimeter block, it was usually coupled with a certain typological layout or other indicators such as site coverage. Urban form parameters would usually include the aspect ratio of the street section. However, same aspect ratio can be calculated for a wide street with thin high-rise towers as well as for a narrow street with thick low-rises.
For this reason, some of the reviewed studies used street widths and average heights of buildings separately as urban form indicators. Overall, there was a clear predominance
solar thermal). Few studies simultaneously explored the interrelations between urban form, energy consumption and environmental quality such as outdoor thermal comfort [51,52]. For instance, Cheng et al. [52] explored the relationship between urban form and solar potential with respect to three design criteria: openness at ground level related to pedestrian comfort, daylight availability and PV potential on building envelope.
Only few papers not just confirm correlation between certain parameters, but also de- scribe a magnitude of this effect and recommend optimal parameter combinations to achieve higher energy performance. However, any quantification of those interdependen- cies should be considered as climate- and context-specific, as well as highly depending on the research methodology and assumptions. Especially this holds for solar energy potential investigation, since the results are highly dependent on a location-specific sun path that is variable even within a single climatic zone. For this reason, only the fol- lowing studies based in Singapore and focused on tropical context are worth mentioning:
Hsieh et al. [53] aimed to provide urban planners with constraints from the perspec- tive of district energy performance by identifying trade-offs between urban density, land use and renewable energy share (%RES). The results showed that when the renewable energy share increases from 20% to 70%, the maximum achievable density (floor area ratio) decreases from 32.2 to 2.9. In this case the land use must be purely residential, because it has the lowest energy demand.
Shi et al. [6, 54, 55, 56] completed several studies on the interdependencies between urban design parameters and the energy system performance in the context of Singa- pore. In these studies, the abovementioned method of simulation based urban form gen- eration and optimization modeling for energy-driven urban design was applied [2]. For the transit-oriented mixed-use development in Singapore, with help of multi-objective optimization it was shown that the highest achievable RES of 30% requires maximizing residential to nearly 100%, while minimizing commercial and office use, as well as sac- rificing more than 70% of gross floor area (GFA) [54]. Further studies focused on the interdependencies between cost-effectiveness of district cooling systems (DCS) and such parameters as density, land use and design of street grids. It was stated, that to maxi- mize cost-effectiveness of the DCS, office ratio should be kept above 0.1, and residential ratio should be kept between 0.25 and 0.75. Additionally, higher density (FAR) was ad- vised to be spatially distributed in proximity to the DCS cooling plant along the piping network [56]. As for the street grid design, it was suggested that given the floor area ratio and land use ratios are homogeneously distributed across blocks, the block area shall be between 7,500 m2 and 16,000 m2. Also, the square-shaped blocks are preferred over rectangular-shaped ones [55]. Finally, using inventory of typical block typologies of Singapore, a method to estimate the photovoltaic penetration and capital costs of greenfield projects was proposed [6]. The maximum achievable renewable energy share was indicated for various combinations of input design parameters. For instance, the renewable energy share of more than 20% could be achieved with the maximum FAR of 4.6, site coverage between 0.6 and 0.8 and such building patterns as towers, podiums or shop houses.
Zhang et al. [57] investigated the relationship between generic block typologies and cooling demand in the tropical climate context. Relatively low and compact build- ings resulted into smaller energy use intensity: hybrid typologies composed of low-rise perimeter block and tower block would be preferable over a standalone high-rise, given
same density. A further study [14] investigated the impact of generic block typologies on solar energy harvesting potential in Singapore. However, the study was primarily for residential buildings with a floor area ratio of 3. It was shown that hybrid and courtyard typologies have twice the rooftop solar potential as well as twice higher reduction in CO2-emissions than other typologies.
Typological method in energy-driven urban design studies
The application of typological methods in the existing research is fundamental to the methodology development of the current study. Many simulation-based urban morpho- logical studies use typological methods to investigate energy efficiency and renewable energy potential, sensitivity or parametric urban performance analysis [4, 6]. These studies investigate districts that comprise targeted buildings (”targets”), performance of which is assessed, and surroundings (”context”), that serve as a source of shading. Shi et al. [6] reviewed simulation-based urban morphological studies and categorized their approaches into 3 groups (Figure 2.3):
Figure 2.3: Three categories of typological methods (a) generic targets with repetitive contexts, (b) actual built form for both targets and contexts; and (c) hybrid targets with repetitive contexts [3,4,5,6].
1. Generic building patterns with repetitive contexts (Figure 2.3a). Both targeted geometries of the study and the surroundings follow a repetitive pattern.
This method doesn’t reflect the complexity of the urban geometries as well as the vernacular building habits. [4,14,58,59]
2. Actual built form for both targets and contexts (Figure 2.3b). The actual built forms are classified based on various parameters such as density or building pattern. This method leads to more realistic results than the previous one, since it respects the vernacular habits. However, it significantly increases the computa- tional effort. [3,15,33,60,61,62,63].
3. Hybrid targets with repetitive contexts(Figure 2.3c). Simplified geometries that represent the vernacular urban form or building regulations are used. Usu- ally, the targeted geometries and the surroundings follow repetitive pattern too.
This method is a good compromise since it respects the vernacular habits, while requiring moderate computational effort. However, the repetitive geometries do not reflect the complexity of the surroundings. [5,64]
Use of the generic or hybrid patterns has advantages compared to the application of the actual built form, because it makes possible to simplify site-specific complications and achieve higher control over the analysis [4], which enhances further applicability degree and potential to generalize the conclusions. The examples of such studies are discussed below.
Natanian et al. [4] proposed a parametric approach to optimizing urban form, energy balance and environmental quality for the case of hot climate in Mediterranean context.
4 generic typologies were used: courtyard, scatter, slab and high-rise. The analysis was undertaken for 1 target building, surrounded by 8 neighbouring building in a repetitive way (see Appendix, Figure A.1). The size of a building block (80m x 80m) as well as the street width was assumed to be constant. The dynamic parameters included a combination of selected building and urban design inputs: distance between buildings, FAR (2, 4, 6 and 8) to alter the number of floors in each iteration, urban grid rotation, building use, window to wall ratio, glazing properties. As a result of the study, the outperformance of the courtyard typology in terms of energy balance was confirmed and found to be more distinct for low densities.
Generic typologies and repetitive contexts were also used by Zhang et al. [14], but the target was a building block containing several buildings. The simulations were con- ducted on six distinct block typologies in Singapore (see Appendix, Figure A.6). Some typologies showed better performance in terms of the building energy use efficiency and solar energy harvesting, as discussed in the previous section. Courtyard block composed of medium-rise buildings, as well as hybrid block composed of mixture between high-rise towers and medium-rise podiums showed higher reduction in CO2-emissions.
The study of Martins et al. [65] was conducted for tropical cities in Brazil and concen- trated just on one building typology (tower), but considered various design parameters such as FAR, site coverage, distance between the buildings and other. The target district contained 9 towers with varying aforementioned parameters, surrounded by 16 neighbor- ing towers (see Appendix, Figure A.2). Using a multi-objective optimization algorithm, the optimal parameter ranges were found, that maximize solar harvesting potential while minimizing undesirable solar heat gain and keeping sufficient indoor daylight levels. A similar study to maximize solar access of slabs arranged in Manhattan grid style was conducted by Kaempf et al. [13] for the city of Basel, using constrained evolutionary algorithms. There were no surroundings considered and the whole district containing 25 buildings was a subject to optimization in terms of its height profile only. As a result, a candidate solution maximizing solar access was found and compared to subjectively chosen district shapes of corona and stairs (see Appendix, Figure A.3). For a similar built volume, relative to the corona shape, a candidate solution yielded 8% improvement, and 22% improvement relative to the stairs shape.
The vernacular building typologies, derived from two sample mixed-use districts of Macau, were used in a study of Li et al. [15] to examine energy and carbon performance on both building and neighborhood level. One district represented a new waterfront de- velopment of Macau dedicated to tourism and gambling business, while another district
was a densely populated area with both residential and commercial uses. The geometries of these areas were extracted with help of a GIS platform. Then, the approach of Martin and March [66] was used to divide the building footprints into 3 groups: rectangle, court and cross. These three groups were further subdivided into 10 building typologies. As a result, at the building level, 10 vernacular building typologies such as pedestal, cross, triangle, L-shape etc. were used for further analysis (see Appendix, Figure A.7). At the neighborhood level, building typologies were grouped in a following manner: court and tower, two courts, compact podium tower and complex court/tower. Finally, the authors recommended to give preference to certain typologies at the building and the neighborhood levels. The building typology of setback was proven to maximize solar accessibility, followed by pedestal, court, and triangle. At the neighborhood level, the combination of an open court building and a tower showed the best performance in maximizing potential solar energy.
Finally, Shi et al. [6] proposed a novel approach to block-typology making, pointing out the flaws of the existing typological methods such as oversimplification of the con- text. First, 7 generic building patterns were derived from 6 generic urban forms proposed by Martin and March (see Appendix, Figure A.4) [66]. Then, the high-density areas of Singapore were examined to check the feasibility of the generic building patterns and to construct vernacular building blocks from the feasible building patterns of various density and site coverage (see Appendix, Figure A.5). Next, 18 constructed vernacular blocks typologies were used by Urban Block Generator, a parametric tool developed in Grasshopper [10], to randomly generate districts out of these blocks. Generated districts were further evaluated with the City Energy Analyst [8] to estimate the renewable en- ergy potential as well as capital costs of a greenfield project adapting generated district design. The advantages of the proposed method include the increased accuracy by modi- fying generic building patterns in accordance to the surveyed vernacular buildings in the relevant urban areas as well as the flexibility offered by the parametric design generation.
However, in this case the accuracy relies on the decisions of the urban designers in the verification and modification process of the generic building patterns. Also, this method (such as all vernacular typology-making approaches) is rather past-oriented because it heavily relies on existing vernacular habits and doesn’t include the possibilities of novel typologies, perhaps adapted from the developments in other cities, to be used in the greenfield projects.
In conclusion, there exists no general classification system of urban form that can be used in the energy-driven urban design studies. The choice of the typologies is highly context- and study-specific, be it generic or vernacular approach of urban form gener- ation. However, the reviewed typology-based studies share some common features, in particular related to the choice of considered design parameters. These are: density expressed as FAR, building or block dimension, building footprint. Often studies ad- ditionally consider distance between the buildings or street width, as well as the land use. As for the performance metric, most of the studies are focused on the solar energy harvesting potential and reduction of the building energy use.
Methodology
The methodological framework of this study can be summarized in the following steps:
1. Based on the literature review, determine experimental design: define scenario parameter matrix and district designs to be inspected (Section 3.2).
2. Conduct energy simulations using City Energy Analyst software [8] (Section 3.3).
3. Perform statistical analysis on the energy simulation results. Based on the statis- tical analysis, derive heuristics for early stages of low-carbon urban design (Sec- tion 3.4).
3.1 Context
3.1.1 Climate conditions
The study is placed in the cooling-dominated context of Singapore. Singapore is situ- ated near the equator and has a tropical hot-humid climate. There are high and uniform temperatures, abundant rainfall and high humidity all year round. Many of its climate variables, including temperature and relative humidity, do not show large month-to- month variation. Therefore, the space cooling load and the domestic hot water heating load in the buildings are nearly identical throughout the year. [67]
The annual irradiation in Singapore is 1636 kWh/m2 and shows little seasonal variation too. The share of diffuse radiation is around 55%, and the daily variability is high due to the frequently changing cloud coverage. As for the potential of photovoltaic installa- tions, the facades only receive an average of 43% of the annual irradiance on a horizontal surface due to the high sun path (lowest angle at solar noon is 65o from the normal).
As a result, taking mutual shading between buildings into account, only the upper part of high-rise buildings in high-density areas is recommended for PV installations. [68]
3.1.2 Urban setting
Singapore is a high-density city-state, with typical floor area ratios ranging from 3 to 25 in the high-density cells in the Singapore Master Plan. Except for floor area ratios, land uses are controlled in the Master Plan. The most common land uses in the high-density areas of Singapore include residential, retail and office use. Essentially, a high-density mixed-use setting is a common boundary condition for new development projects in Singapore. [14,54,69]
Further relevant boundary conditions related to the urban setting of Singapore will be mentioned in the following sections.
3.2 Experimental design
This section first presents a scenario parameter matrix that describes simulated scenarios with respect to the selected input design parameters. The choice of each parameter as well as the performance metrics is justified in the Section 3.2.1. Then workflow and applied tools are presented (Section 3.2.2). Finally, generated district geometries are described (Section 3.2.3).
3.2.1 Scenario parameter matrix
This section describes the input design parameters as well as the performance indicators that were chosen to explore the interdependence between the urban form and the per- formance of the district energy systems.
To quantify an effect of the urban form on the performance of district energy systems, various district design scenarios must be investigated. A district design can be char- acterised by different urban form indicators. For this study, there were 4 urban form indicators chosen, that most frequently showed correlation with energy performance in the previous energy-driven urban design studies (Section 2.2). They include building typology, density expressed as floor area ratio (FAR), compactness expressed as street width (SW) and land use mix. The district design scenarios are then evaluated with respect to the performance indicators such as operational energy use, carbon emissions and renewable energy share.
To group the design scenarios according to the chosen urban form indicators, a sce- nario parameter matrix was created. The matrix consists of 4 dimensions. Each one of them relates to a certain urban form indicator (typology, FAR etc.). In this way, each matrix entry corresponds to a district design scenario characterised by 4 urban form indicators and evaluated with respect to a certain performance indicator. The total number of scenarios reaches 9’126, considering all possible combinations of urban design parameters. A short matrix version is presented in Figure 3.1, please refer to a full version in the Appendix, Figure B.1. In the following sections, each dimension of the scenario parameter matrix as well as the performance metrics will be described in detail.
Figure 3.1: Scenario parameter matrix (full version in the Appendix, Figure B.1).
Building typology
As discussed in the literature review, form typologies are fundamental in energy-driven urban design studies [6]. The typologies can be distinguished at different scales such as building or block level. Since the aim of the current study is to derive heuristics for early urban design stages, it is important to consider the potential to generalize the results while developing the methodology of the study. As block typologies lead to a large amount of possible design combinations, it is difficult to draw conclusions and give recommendations that can be applicable for various boundary conditions. Either few design combinations must be chosen as in the study of Zhang et al. [14] (see Appendix, Figure A.6), or sophisticated parametric design tools must be applied like the Urban Block Generator in the experiment of Shi et al. [6]. For these reasons, the current study chooses building level as a typology unit to gain more control over the analysis and the interpretation of the results.
In Singapore, building typologies considered by urban designers in high-density settings usually include residential HDB as rectangular building or mixed-use tower of various shapes with podium as extruded plot. More sophisticated shapes are usually simplified into rectangles (Dr. Aurel von Richthofen, personal interview, March, 2020). However, such simplification may decrease the accuracy of building energy and carbon perfor- mance assessment. For instance, neglecting irregular facade geometries may not depict a real PV potential of the building. Hence, more comprehensive building typologies are to be considered in this study.
(a) Singapore [70] (b) Macau, China [71]
Figure 3.2: Central areas of Singapore and Macau.
As concluded from the literature review, there exists no common classification system for building typologies that is used as a basis for energy-driven urban design studies.
However, often researchers refer to a basic categorization of urban form developed in the 1970s by Martin and March [66]. This categorization divides the urban form into basic patterns such as slab, tower and cross. Using this as a starting point, recent studies of Shi et al. [6] and Li et al. [15] subdivided the basic patterns into more sophisticated building and block typologies by studying vernacular typologies that exist in the location of their case studies (Singapore and Macau respectively). Macau is a rapidly growing Asian city that lies within the tropics located at the southern coast of China [15, 72], making its context comparable to Singapore. In contrast to the Singapore-based study of Shi et al. [6], which operates at the block level, the Macau-based study of Li et al. [15]
is focused on the building level as a typology unit. 10 vernacular typologies of Macau were derived by the authors from two dense mixed-use districts of Macau (Appendix,
Figure A.7). These typologies included rectangle, courtyard, cross, triangle, I-Shape, L-Shape, C-Shape, setback, pedestal and cross-pedestal. High-density mixed-use setting allows to apply these building typologies to the current study given similar climatic and urban contexts of Singapore and Macau (Figure 3.2).
To verify the applicability of Macau’s typologies to Singapore, a survey of the build- ing footprints in the high-density areas of Singapore was conducted using Open Street Maps [9]. A list of the high-density areas was taken from the study of Shi et al. [6] and contained such districts as Downtown Core, Jurong Lakeside, One-North, Tampines. 6 out of 10 building footprints from the study of Li et al. [15] were present in these dis- tricts: I-Shape, C-Shape, L-Shape, rectangle (as square or slab), triangle, cross (Figure 3.3); as well as T-Shape highlighted by Shi et al. [6]. Remaining typologies excluding cross-pedestal could be spotted in other districts of Singapore: the examples are con- tained in the Appendix, Figures B.3, B.2, B.4.
The current study adopted 10 typologies introduced by Li et al. [15] given their suc- cessful verification in Singapore as well as their level of comprehension. The typology
”rectangle” was further subdivided into square and slab. Additionally, T-Shape typol- ogy from the study of Shi et al. [6] was included. In total, scenario parameter matrix (Figure 3.1) incorporated 12 typologies: square, slab, courtyard, T-Shape, I-Shape, L- Shape, C-Shape, cross, triangle, setback (multilevel building), pedestal (podium+tower), cross-pedestal (podium+tower as cross shape). Their dimensions will be discussed in the following section (Section 3.2.3).
The scenario parameter matrix doesn’t include different options of building orienta- tions since the buildings in Singapore are designed to minimize heat gain which results into positioning the longest sides of the facade facing North-South direction that receives less sunlight than East-West direction (Dr. Aurel von Richthofen, personal interview, March, 2020). Hence, the orientation of the building is determined by default following this rule.
Figure 3.3: Examples of the building footprints in the dense districts of Singapore:
Tampines, Jurong Lakeside and One-North (from left to right) [7].
Density
Singapore Master Plan prescribes the density expressed as floor area ratio (FAR) for new developments [69], making it a crucial boundary condition at the early urban design stages. Moreover, as discussed in the literature review, most of the studies on energy- driven urban design consider density expressed as FAR as an input parameter or a subject to optimization (see Section 2.2). The FAR is calculated as a ratio between the building gross floor area and the site area. The FAR norm of Singapore Master Plan, as surveyed by Shi et al. [54], lies between 3 and 25 for high-density areas. The current study adopts this range for FAR values, with minimum FAR equal to 4 and maximum FAR equal to 24, with a step change of 2: [4, 6, 8...22, 24].
Land use mix
Land use mix is another parameter that is controlled in the Master Plan of Singapore [69].
The common uses include office (OFF), residential (RES), retail (RET) and industrial.
Industrial use is not considered in the current study since it is less relevant for high- density context [54]. This study investigates all possible combinations of land uses with a step change of 0.1, assuming that there are always 3 types present in a mix, for instance RES:OFF:RET equal to 0.1:0.1:0.8, 0.2:0.1:0:7 and so on. The total number of land use mixes reaches 36 and is presented in the Appendix, Figure B.1.
To interpret the results, the land use mixes are grouped as follows:
• Mostly RES (≥0.5) with OFF (≥0.3): RES WITH OFF;
• Mostly RES (≥0.5) with RET (≥0.3): RES WITH RET;
• Mostly OFF (≥ 0.5) with RES (≥0.3): OFF WITH RES;
• Mostly OFF (≥ 0.5) with RET (≥ 0.3): OFF WITH RET;
• Mostly RET (≥0.5) with RES (≥0.3): RET WITH RES;
• Mostly RES (≥0.6), where RET≤0.2 and OFF ≤0.2: MOSTLY RES;
• Mostly OFF (≥ 0.6), where RET≤0.2 and RES ≤0.2: MOSTLY OFF;
• Mostly RET (≥0.6), where OFF ≤0.2 and RES ≤0.2: MOSTLY RET;
• Other mixes such as RES:OFF:RET = 0.4:0.3:0.3 or 0.4:0.2:0.2: BALANCED;
District compactness
Compactness is a major urban form parameter that affects the accessibility of solar energy in the built environment. District compactness can be assessed in different ways.
For instance, the indicators include volume-area ratio, site coverage, distance between the buildings. [33] Distance between the buildings is largely determined by the street width. If various scenarios regarding the street widths are considered for a district of fixed size, then larger streets would result into lower building footprint areas and higher distances between the buildings. In this case, street width serves as an indicator of compactness: the higher the street width, the lower the compactness level of the area.
Land Transport Authority of Singapore [73] distinguishes different categories of roads such as major roads or roads in residential areas, and provides their typical dimensions.
Based on this information, the current study adopts three categories of the street widths (SW): 15.4 m (SW15), 31.8 m (SW32) and 45.4 m (SW45).
Supply systems
The supply systems selection is constant for all scenarios and is not a subject to opti- mization. The chosen systems are known to contribute to the high energy efficiency and low carbon performance of the built environment, and they include:
• Type of cooling system: district cooling network (air-air). District cooling network is dedicated to centralized production of cooling services. It is an efficient way to supply cooling energy in the tropics, which may cut a half of electricity usage com- pared to other cooling systems. Especially, district cooling systems are applicable to the high density context. [6,50,74]
• Type of electrical supply system: PV produced electricity and grid electricity (Sin- gaporean consumer mix). Energy generation with PV is included into the technol- ogy roadmap for low-energy buildings by Singaporean Building and Construction Authority [40]. Usually roof areas are occupied with cooling tower installations that limit space availability for PV installations. However, since district cooling with centralized cooling plants is considered as supply scenario, the roof areas are freed up for solar panels.
• Type of hot water supply system: electrical boiler.
• Type of heating system: none.
Please refer to Section 3.3 for the detailed description of supply systems.
Performance indicators
The low-carbon city indicator system, that was mentioned in the literature review (Sec- tion 3.2.1), included such performance indicators as proportion of renewable energy [%], energy intensity [MJ/USD] and CO2-emissions intensity [ton/person]. This system is used on a bigger scale to compare carbon performance of the cities. Since the current study operates at the district scale, it adopts performance indicators that were used previously in Singapore-based energy-driven urban design studies [6,14,54,57]. These include:
• Operational carbon emissions intensity [kgCO2/m2/a] [14].
• Operational carbon emissions [tCO2/a] [14].
• Energy use intensity (EUI) [kWh/m2/a] [14,57]. Moreover, EUI is used for build- ing certification in Singapore [40,75].
• Energy use [MWh/a] [14].
• Renewable energy share (%RES) [%] [6,54].
Operational carbon emissions intensity is an indicator for carbon performance of the district. It is determined by the energy use of the district and the renewable energy share (%RES). Both relative and absolute values of carbon and energy performance are considered in the analysis. Please refer to Section 3.4.1 for the detailed calculation pro- cedure of the performance indicators.
In order to compare performance of different district designs, it is sufficient to con-
![Figure 2.2: A model of simulation based urban form generation and optimization mod- mod-eling for energy-driven urban design [2].](https://thumb-eu.123doks.com/thumbv2/1library_info/5342654.1681959/21.892.190.715.109.556/figure-model-simulation-generation-optimization-energy-driven-design.webp)


![Figure A.5: Adapted for Singapore, generic building patterns used by Shi et al. [6].](https://thumb-eu.123doks.com/thumbv2/1library_info/5342654.1681959/94.892.201.690.393.704/figure-adapted-singapore-generic-building-patterns-used-shi.webp)
