Implementation and applications of gas chromatography/
atmospheric pressure chemical ionization time-of-flight mass spectrometry in metabolomics
Dissertation
zur Erlangung des Doktorgrades der Naturwissenschaften (Dr. rer. nat.) an der Fakultät für
Chemie und Pharmazie der Universität Regensburg
vorgelegt von Christian J. Wachsmuth
aus Neustadt a. d. Donau im Jahr 2015
Diese Doktorarbeit entstand in der Zeit von April 2011 bis Januar 2015 am Institut für Funktionelle Genomik der Universität Regensburg.
Die Arbeit wurde angeleitet von Prof. Dr. Peter J. Oefner.
Promotionsgesuch eingereicht am 29. Juni 2015.
Für meine Eltern
“Nothing worth having comes easy.” Dr. Bob Kelso (Scrubs)
Danksagung
Zu guter Letzt freue ich mich, die letzte Seite noch voll zu machen und dabei zum Ab- schluss einer Vielzahl an Menschen zu danken. Denjenigen, die mich schon vor der Dissertation unterschützt haben und genauso den lieben Menschen, die während der Zeit des Promovierens hinzugekommen sind und mich begleitet haben.
An erster Stelle danke ich Prof. Dr. Peter J. Oefner, dass ich an diesem interessanten Thema arbeiten konnte und für die fachliche Begleitung und Unterstützung dabei. Ich habe den gewissen zugestanden Freiraum für eigene Ideen sehr zu schätzen gewusst genauso wie die Erfahrungen, die ich auf den zahlreichen Konferenzen sammeln durfte.
Des Weiteren gilt mein Dank Prof. Dr. Frank-Michael Matysik für die freundliche Übernahme des Zweitgutachtens sowie die stets äußerst kooperative und unkomplizier- te Art. Prof. Dr. Joachim Ruther und Prof. Dr. Joachim Wegener bin ich dankbar für die Übernahme der Drittprüferschaft bzw. des Prüfungsvorsitzes.
Ein herzliches „Vergelt’s Gott“ an Dr. Katja Dettmer-Wilde für die direkte Betreuung und Begleitung meiner wissenschaftlichen Pubertätsphase und den dabei weitergege- benen Chromatographie-Erfahrungsschatz. Darüber hinaus für die Vorbereitung auf das spätere „harte Arbeitsleben“, was mir sicherlich gut weiterhelfen wird.
Ich bin überaus froh gewesen, Magda Waldhier und Franzi Vogl am IFG als Wegbe- gleiterinnen gehabt zu haben. Vielen Dank euch beiden für das offene Ohr, die aufbau- enden Worte und Komplimente und den Glauben an mich. Magda danke ich insbeson- dere noch für die überaus bereitwillige Weitergabe ihres Wissens bei meinen ersten GC-MS Schritten, die abendlichen Wiener-Breaks und die Geduld mit mir. Franzi danke ich dafür, dass sie nach unzähligen Bachelorettes und Bachelors zur Konstante an meiner rechten Seite wurde und für ihr heiteres und liebenswertes Wesen.
Ebenso werde ich meinen Notduschen- und Tanz-Buddy Nadine Nürnberger und Märchentante Claudia Samol im Alltag vermissen. Nadine, du warst mir darüber hinaus eine hervorragende Ausbildungsleiterin für soziale Belange, stets an meiner Seite für gewünscht mal mehr und mal weniger tiefsinnige Gespräche und hast mir viele
Glücksmomente als Beifahrer beschert. Claudi, du fehlst mir wegen deiner treuen und liebenswerten Art und von niemandem sonst lass ich mir so gern Horrorgeschichten erzählen, die niemals passiert sind.
Inzwischen schon ein Weilchen her, aber nicht weniger herzlichen Dank an Dr. Martin Almstetter für die große Hilfe am Anfang meiner IFG-Zeit, die Aufnahme in die erlese- ne Jean-Pierre Runde und ein aufrichtiges „Sorry“ für die Sabotage deiner Laborarbei- ten durch das Verstecken der GC Crimp-Vials.
Sehr bedanken möchte ich mich auch bei den Mitgliedern der Proteomics-Gruppe. Allen voran bei Dr. Nadine Assmann für Gurkenbrote zum richtigen Zeitpunkt, Gesellschaft zu „ungewöhnlichen“ Bürozeiten und der anschließenden Heimfahrt, um mich vor Räu- bern und Verbrechern zu schützen. Insgesamt lässt mich das darüber hinweg sehen, dass ich das versprochene Borschtsch-Rezept niemals erhalten habe, werde es aber beim nächsten Wiedersehen erneut einfordern. Des Weiteren danke an die übrigen
„Proteomiker and friends“ Elke Perthen und Hans Simbürger für die gute Laune, Dr.
Jörg Reinders und Dr. Alex Riechers für viele Tipps und wissenschaftliche Zerstreu- ung, Dr. Yvonne Reinders für die Alkoholzufuhr in Kuchenform (der Rumkuchen bleibt legendär) und Niklas „Ramon“ Reinders fürs Teilen von Kinderbüchern auf langen Autofahrten.
Gerne erinnere ich mich auch an die NMR-ler Dr. Matthias Klein (danke für die ange- nehme gemeinsame Bürozeit), Helena Zacharias, meinen TuMet-Buddy Jochen Hochrein sowie Philipp Schwarzfischer. Ihnen bin ich insbesondere dankbar für Hil- festellungen im Zusammenhang mit Statistik und Prof. Dr. Wolfram Gronwald dazu noch für viele freundliche Ratschläge, seine große Hilfsbereitschaft und die gemeinsam geteilte Vorliebe für Kuchen aller Art.
Ferner besonders bedanken möchte ich mich bei allen Kooperationspartnern, vor allem von Bruker Daltonik (Bremen) und der Uni-Klinik Regensburg, den weiteren ehemaligen IFG-lern Carry Louis (für die Ananas-Vitamin/Zuckerschocks), Dr. Wenni Zhu, Dr.
Axel Stevens, Sophie Schirmer, Anja Thomas, Conny Feuchtinger, Sabine Botzler und Michaela Schröpfer, den noch recht „Neuen“ Lisa Ellmann und Trixi von Schlip- penbach, mit denen es zwar ein kurzes Vergnügen war aber sicherlich gut geworden wäre, sowie Dr. Inka Appel, Franziska Taruttis und Christian Kohler aus der Bioin-
formatik-Abteilung für ihre Hilfe. Dazu noch Jutta Schipka und Susanne Schwab für das eine oder andere nette Gespräch beim Essen und Eva Engl für Organisatorisches und den Schmetterling an meiner Tür. Allen weiteren Mitarbeitern und Ehemaligen des IFGs danke ich für jegliche Hilfe und das angenehme Klima in der Gruppe.
Ich hatte das Vergnügen, im Laufe meiner Zeit am IFG neben der im Zusammenhang mit einer Promotion immer wieder genannten vielen Arbeit und benötigten Ausdauer auch viele schöne Momente zu erleben. Deshalb werde ich mich auch mit Freude zu- rück erinnern und gerne die Verbindung zu den liebgewonnenen Menschen aufrecht- erhalten.
Danke an meine Freunde von außerhalb und meine Familie für die aufgebrachte Ge- duld, das offene Ohr und den ständigen Zuspruch. Der größte Dank überhaupt gebührt zuletzt meinen Eltern Karin und Herbert Wachsmuth für die große Unterstützung, den Zusammenhalt in schwierigen Phasen und das Gefühl, angenommen und geliebt zu werden, ganz egal, ob ich diese letzten Zeilen und somit die Dissertation jemals zu Ende gebracht hätte oder nicht.
I
1 Table of contents
1 TABLE OF CONTENTS ... I
2 ABBREVIATIONS AND ACRONYMS ... VI
3 MOTIVATION ... 1
4 BACKGROUND ... 6
4.1 METABOLOMICS ... 6
4.1.1 CHALLENGES ... 7
4.1.2 STRATEGIES ... 8
4.2 ESTABLISHED GC-MS APPROACHES IN METABOLOMICS ... 9
4.2.1 DERIVATIZATION STRATEGIES ... 10
4.2.1.1 MeOx‐TMS derivatization ... 10
4.2.1.2 Derivatization with alkyl chloroformates ... 12
4.2.2 GC STATIONARY PHASES ... 13
4.2.3 GC-MS WITH EI AND CI SOURCES ... 14
4.2.4 COMPREHENSIVE TWO-DIMENSIONAL GAS CHROMATOGRAPHY – TIME-OF- FLIGHT MASS SPECTROMETRY ... 16
4.3 ATMOSPHERIC PRESSURE CHEMICAL IONIZATION FOR GC-MS ... 18
4.3.1 FUNDAMENTALS ... 18
4.3.2 REVIEW OF GC(×GC)-APCI-MS APPLICATIONS ... 29
4.4 EXPERIMENTAL DESIGN AND DATA ANALYSIS IN METABOLOMICS ... 33
4.4.1 SETTING UP AN ANALYSIS ... 34
4.4.2 DATA ANALYSIS WORKFLOW ... 37
II 4.4.3 RECALIBRATION OF HIGH-RESOLUTION GC-APCI-TOFMS DATA AND
CALCULATION OF ELEMENTAL FORMULAS ... 39
4.5 IDENTIFICATION OF METABOLITES ... 41
4.5.1 GAS CHROMATOGRAPHY ... 41
4.5.2 MASS SPECTROMETRY ... 44
5 EXPERIMENTAL SECTION ... 47
5.1 MATERIALS ... 47
5.2 SAMPLE PREPARATION ... 48
5.2.1 PREPARATION OF CALIBRATION AND CELL CULTURE SAMPLES ... 48
5.2.2 METHOXIMATION–TRIMETHYLSILYLATION ... 49
5.2.3 METHYL CHLOROFORMATE/METHANOL DERIVATIZATION ... 50
5.3 INSTRUMENTATION ... 50
5.3.1 GC-APCI-TOFMS ... 50
5.3.2 MISCELLANEOUS ... 52
5.4 DATA ANALYSIS ... 52
5.4.1 SOFTWARE ... 52
5.4.2 CALIBRATION CURVES ... 54
5.4.3 RECALIBRATION OF MASS SPECTRA ... 54
5.4.4 CALCULATION OF ELEMENTAL FORMULAS ... 56
5.5 VALIDATION METHODS ... 59
5.5.1 ROC CURVE ... 59
5.5.2 BLAND-ALTMAN PLOT ... 61
6 INVESTIGATIONS ON THE EFFECTS OF CONTINUOUS WATER INFUSION ON APCI OF DERIVATIZED METABOLITES ... 62
6.1 INTRODUCTION ... 62
III
6.2 MATERIALS AND METHODS ... 63
6.2.1 MATERIALS ... 63
6.2.2 SAMPLE PREPARATION ... 63
6.2.3 GC-APCI-TOFMS ANALYSIS ... 64
6.2.4 CROSS-VALIDATION OF AMINO ACIDS ... 64
6.2.5 FEATURE EXTRACTION AND ALIGNMENT ... 65
6.3 RESULTS AND DISCUSSION ... 66
6.3.1 EFFECTS OF CONTINUOUS WATER INFUSION ON APCI MASS SPECTRA OF MCF AND MEOX-TMS DERIVATIVES ... 66
6.3.2 OPTIMIZATION OF WATER INFUSION RATE ... 68
6.3.3 METHOD EVALUATION VIA SPIKE-IN EXPERIMENT ... 70
6.3.4 EVALUATION OF FOLD CHANGES AND MASS AND ISOTOPE ACCURACY ... 74
6.3.5 ANALYSIS OF METABOLIC FINGERPRINTS OF CANCER CELL EXTRACTS ... 75
6.3.6 COMPARATIVE ANALYSIS OF CONTROL AND 17-DMAG-TREATED SAMPLE GROUPS ... 79
6.3.7 CROSS-VALIDATION OF DISCRIMINATING AMINO ACIDS ... 82
6.4 CONCLUSIONS ... 83
7 ASSESSMENT OF MATRIX EFFECTS IN GC-APCI-MS ... 85
7.1 INTRODUCTION ... 85
7.2 MATERIALS AND METHODS ... 86
7.2.1 SPIKE-IN EXPERIMENT ... 86
7.2.2 CO-ELUTING ANALYTE PAIRS ... 88
7.3 RESULTS AND DISCUSSION ... 89
7.3.1 SELECTION OF INTERNAL STANDARDS FOR QUANTIFICATION OF SPIKE-IN METABOLITES ... 89
IV 7.3.2 RECOVERY RATES OF 15 SPIKED METABOLITES IN THREE DIFFERENT
MATRICES ... 91
7.3.3 SLOPES OF CALIBRATION CURVES OF SIX ANALYTES IN THE PRESENCE OF CO- ELUTING COMPOUNDS ... 95
7.4 CONCLUSIONS ... 98
8 PERFORMANCE EVALUATION OF A REDESIGNED APCI SOURCE ...100
8.1 INTRODUCTION ... 100
8.2 MATERIALS AND METHODS ... 101
8.2.1 MATERIALS ... 101
8.2.2 INSTRUMENTATION ... 101
8.2.3 DATA ANALYSIS ... 104
8.2.3.1 FAMEs ... 104
8.2.3.2 Cell culture supernatant samples ... 104
8.3 RESULTS AND DISCUSSION ... 106
8.3.1 GC-APCI-HRTOFMS ANALYSIS OF FAMES WITH THE APCII AND II SOURCES ... 106
8.3.2 COMPARISON OF GC-APCI-HRTOFMS CALIBRATION CURVES ... 110
8.3.3 ANALYSIS OF CELL CULTURE SUPERNATANTS ... 114
8.4 CONCLUSIONS ... 123
9 DEVELOPMENT OF AN ENANTIOSELECTIVE QUANTITATIVE PROFILING METHOD FOR THE ONCOMETABOLITE D-2-HYDROXYGLUTARATE ...124
9.1 INTRODUCTION ... 124
9.2 METHODS ... 127
9.2.1 SAMPLE PREPARATION ... 127
9.2.2 ANALYTICAL APPROACHES ... 128
9.3 RESULTS AND DISCUSSION ... 131
V 9.3.1 SELECTION OF A SPECIFIC QUANTIFIER ION TRACE FROM APCI-TOFMS
VERSUS EI-QMS MASS SPECTRA ... 131
9.3.2 IONIZATION BEHAVIOR OF D/L-2-HG IN GC-APCI-TOFMS INFUSING WATER AS MODIFIER ... 135
9.3.3 METHOD VALIDATION ... 137
9.3.4 LACTONIZATION OF D/L-2-HG IN DERIVATIZED STANDARDS AND BIOLOGICAL SAMPLES ... 140
9.4 CONCLUSIONS ... 143
10 CONCLUSIONS AND PERSPECTIVES ...145
11 REFERENCES ...148
12 APPENDIX ...156
13 CURRICULUM VITAE ...186
14 PUBLICATIONS AND PRESENTATIONS ...187
14.1 PUBLICATIONS ... 187
14.2 ORAL PRESENTATIONS ... 189
14.3 POSTER PRESENTATIONS ... 190
15 SUMMARY ...191
16 ZUSAMMENFASSUNG ...194
VI
2 Abbreviations and Acronyms
(v/v) Volume/volume percent
[M+H]+ Protonated molecule of metabolite M
17-DMAG 17-Dimethylaminoethylamino-17-demethoxygeldanamycin
2-HG 2-Hydroxyglutarate
3-P-glycerate 3-Phosphoglycerate 5-HIAA 5-Hydroxyindoleacetate
Ala Alanine
AML Acute myeloid leukemia ANOVA Analysis of variance
AP Atmospheric pressure
APCI Atmospheric pressure chemical ionization APCI I First-generation APCI source
APCI II Second generation APCI source
APCI(+) Atmospheric pressure chemical ionization positive mode APCI/+H2O APCI with water infusion
APCI/-H2O APCI without water infusion
API Atmospheric pressure ionization APLI Atmospheric pressure laser ionization APPI Atmospheric pressure photo ionization
VII
Asn Asparagine
Asp Aspartate
AUC Area under the curve
CD Cyclodextrin
CI Chemical ionization
CID Collision-induced dissociation
Cys Cysteine
D/L-2-HG D and L enantiomers of 2-hydroxyglutarate
Da Dalton
DA-APLI Dopant-assisted atmospheric pressure laser ionization DA-APPI Dopant-assisted atmospheric pressure photo ionization DART Direct Analysis in Real Time
DB Database
DIP Direct Inlet Probe E. coli Escherichia coli
EI Electron ionization
EIC Extracted ion chromatogram ESI Electrospray ionization FAME Fatty acid methyl ester
FC Fold change
FDA Food and Drug Administration FDR False discovery rate
VIII FID Flame ionization detector
FMF Find Molecular Features
FN False negative
FP False positive
FPR False positive rate
FTICR Fourier transform ion cyclotron resonance
G6P Glucose-6-phosphate
GABA Gamma amino butyrate
GC Gas chromatography
GC×GC Comprehensive two-dimensional gas chromatography GLC Gas liquid chromatography
Gln Glutamine
Glu Glutamate
Gly Glycine
Glycerol-1-P Glycerol-1-phosphate
GSC Gas solid chromatography
HDA Heptadecanoate
His Histidine
HMDB Human Metabolome Database
HPLC High performance liquid chromatography HRTOF High-resolution time-of-flight
Hsp90 Heat-shock protein 90
IX IAS Ion activation stage
IDH Isocitrate dehydrogenase
Ile Isoleucine
IPT Isopentenyl phosphotransferase encoding gene
IS Internal standard
KEGG Kyoto Encyclopedia of Genes and Genomes
LC Liquid chromatography
Leu Leucine
LLOQ Lower limit of quantification LOD Limit of detection
logPoctanol/water Logarithm of partition coefficient LOQ Limit of quantification
LR Linear range
Lys Lysine
m/z mass-to-charge ratio
MCF Methyl chloroformate
Me Methyl
MeOx Methoximation
Met Methionine
MRM Multiple reaction monitoring
MS Mass spectrometry
MS/MS Tandem mass spectrometry
X
MSE Simultaneous acquisition mode of high and low collision energy spectra
MSn Tandem mass spectrometry
MSTFA N-methyl-N-(trimethylsilyl) trifluoroacetamide
NA Nonanoate
NAA N-acetylaspartate
NADP+/NADPH Nicotinamide adenine dinucleotide phosphate (oxidized and re- duced form)
NDA Nonadecanoate
netCDF Network Common Data Format
NIST National Institute of Standards and Technology NMR Nuclear magnetic resonance
NPAH Nitrated polycyclic aromatic hydrocarbon
Nval Norvaline
OH Hydroxy
Orn Ornithine
PAH Polycyclic aromatic hydrocarbon PBM Probability-based matching PBS Phosphate-buffered saline PCA Principal component analysis
PCF Propyl chloroformate
PDA Pentadecanoate
PFPP Pentafluorophenyl propyl
XI
Phe Phenylalanine
PLS-DA Partial least squares discriminant analysis ppm parts per million
ppmV parts per million by volume
Pro Proline
PTV Programmed-temperature vaporization PU E. coli double-mutant (PntAB-UdhA) strain qMS Quadrupole mass spectrometry
qTOF Quadrupole- Time-of-flight hybrid mass spectrometry R² Square of the linear regression coefficient R
RI Linear retention index
ROC Receiver operator characteristic RSD Relative standard deviation
Rt-DEXsa 2,3-di-acetoxy-6-O-tert-butyl-dimethylsilyl gamma CD doped into 14% cyanopropylphenyl/86% dimethyl polysiloxane
S/N Signal-to-noise ratio
SD Standard deviation
Ser Serine
SIL-IS Stable isotope-labeled internal standard SIM Selected ion monitoring
SP Stationary phase
SVM Support vector machines
TCA Tricarboxylic acid
XII
TDA Tridecanoate
Thr Threonine
TIC Total ion current
TMS Trimethylsilyl
TN True negative
TOCSY Total correlated spectroscopy
TOF Time-of-flight
TP True positive
TPR True positive rate
Trp Tryptophan
TSP Trimethylsilyl propanoic acid
Tyr Tyrosine
U-13C Uniform 13C-labeled U-2H Uniform 2H-labeled
UDA Undecanoate
ULOQ Upper limit of quantification UTI Urinary tract infection
Val Valine
VOC Volatile organic compound
wh Peak width measured at half the peak height
wt wild type
m mass error
1
3 Motivation
Metabolomics aims at the measurement of the largest possible number of metabolites in a single analysis. The ultimate goal is the identification and quantification of those that differ significantly between groups. Knowing the identity and quantity of discriminating metabolites allows the interpretation of metabolic changes in the context of metabolic pathways, which is essential for understanding the underlying biology.
Gas chromatography – electron ionization – mass spectrometry (GC-EI-MS) in combi- nation with a derivatization is a valuable tool in metabolomics due to high analytical reproducibility, low detection limits, and the availability of large mass spectral libraries that also include trimethylsilyl derivatives that are commonly used. Nevertheless, many derivatives of metabolites are not found in standard commercial libraries rendering the annotation of corresponding signals in the GC-MS chromatogram cumbersome. Ele- mental formulas can be calculated from the accurate mass of molecular ions as a first step towards the de-novo identification of unknown metabolites, but electron ionization causes strong fragmentation and does not always yield the molecular ion. Hence, soft ionization techniques, such as chemical ionization (CI), must be applied. In the 1970s, Horning et al. introduced atmospheric pressure chemical ionization (APCI) as a soft ionization technique for coupling GC to MS [1,2], but it was not widely used at that time because of the required expensive instrumentation and it did not reach maturity for commercialization. Another 30 years later, McEwen and McKay as well as Schiewek et al. continued the studies on APCI and developed independently ion sources suited for coupling mass spectrometry with both gas and liquid chromatography [3,4]. Their work led in 2008 to the introduction of commercially available APCI sources for GC-MS and their hyphenation with high-resolution mass analyzers to exploit such powerful features as accurate mass measurement and tandem mass spectrometry for the identification of unknowns. The great potential of high-resolution time-of-flight mass spectrometry (HRTOF-MS) in metabolomics is not only based on accurate mass measurement for
2
structural assignment of unknown species but also on the option to perform targeted quantification simultaneously. The latter benefitted from the introduction of the analog- to-digital converter, which led to a distinct increase in the dynamic range of TOFMS instruments [5]. This was highly needed as metabolites vary tremendously in their con- centration levels. Since GC-APCI-TOFMS has shown high detection sensitivity in initial studies [6], it appeared to be promising for quantitative metabolic profiling.
Prior to my master thesis in 2010 and this doctoral research work, there had been few reports on the use of GC-APCI-HRTOFMS. Reported applications included the identifi- cation of unknown compounds in pharmaceutical research [7], analysis of foodstuff [8], and metabolomics [9-11]. Its performance had not been compared to established GC- MS approaches. The technique had only been applied to study metabolite composition in human cerebrospinal fluid [9], but comparative metabolic fingerprinting of several sample classes had not been performed to that date. Furthermore, the outstanding quantitative capabilities of GC-APCI-HRTOFMS had only been demonstrated using metabolite standards [9,10] and not been used for metabolic profiling, i.e., the quantita- tive analysis of known metabolites, in biological specimens.
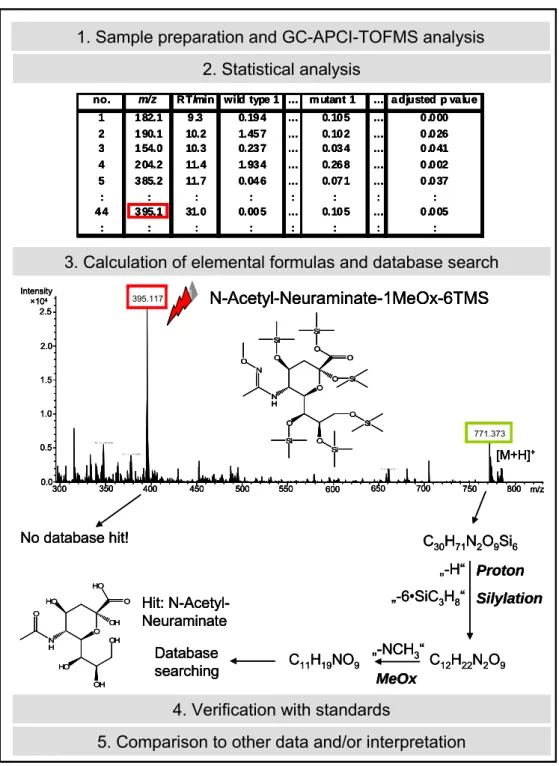
My master thesis and the research done by Carrasco et al. in 2009 [9] were the first GC-APCI-HRTOFMS studies that investigated the ionization behavior of a broad range of metabolites. In my master thesis, 43 metabolites from different compound classes, such as amino acids, organic acids, sugars, and alcohols, were analyzed. APCI source parameters were optimized and the quantitative performance of GC-APCI-HRTOFMS was comprehensively compared to that of GC×GC-EI-TOFMS, GC-EI-TOFMS, GC-CI- quadrupole mass spectrometry (qMS) and GC-EI-qMS, respectively. In addition, com- parative metabolic fingerprinting was performed in wild type and mutant Escherichia coli (E. coli) strains and a workflow for the identification of unknown metabolites was estab- lished based on the accurate mass and isotopic pattern of their protonated molecules ([M+H]+). For validation, results were compared to a previous study that had employed GC×GC-EI-TOFMS [12]. Although the general applicability of GC-APCI-HRTOFMS in metabolomics could be shown, the quantitative performance of GC-APCI-HRTOFMS was less than satisfying, mainly because of inconsistent ionization. Factors influencing
3
ionization efficiency and reproducibility needed to be studied in more detail, such as the infusion of water into the ionization source and potential matrix effects due to co-eluting compounds. Hence, the initial results of my master thesis formed the basis for this doc- toral thesis.
Aim #1: Investigation and optimization of factors influencing APCI
1.1 Water infusion
Already in the course of my master thesis it became obvious that humidity in the labora- tory critically affects reproducibility of APCI. Therefore, the first aim of this thesis was a systematic assessment of the effect of water infusion into the APCI source on efficiency and repeatability of APCI for the two most commonly used derivatization protocols, namely alkylation using methyl chloroformate (MCF) and methoximation-silylation, in GC-MS based metabolome analysis. To that end, 20 metabolite standards and five different water infusion rates between 0.1-0.5 mL/h were tested. As a proof of principle, MCF derivatization and GC-APCI-TOFMS w/o water infusion were applied to the detec- tion of changes in metabolite abundance in pancreatic cancer cells upon treatment with the heat-shock protein 90 (Hsp90) inhibitor 17-dimethylaminoethylamino-17- demethoxygeldanamycin (17-DMAG).
1.2 Matrix effects
In liquid chromatography (LC)-MS, APCI is known to be prone to matrix effects hamper- ing accurate quantification. Hence, the aim of this project was to study whether biologi- cal matrices affect GC-APCI-HRTOFMS. To investigate potential interferences from matrix compounds, an E. coli extract as well as human serum and urine specimens were spiked with 15 metabolite standards and recovery rates determined. In addition, for three pairs of co-eluting compounds, possible interferences between the analyte of interest and defined amounts of its co-eluent were studied. The purpose of this experi- ment was to reveal whether APCI might be an actual source of ion suppression or en- hancement in the case of co-eluting analytes in the absence of a biological matrix.
4 1.3 APCI source type
During my thesis, Bruker Daltonics (Bremen, Germany) introduced a redesigned “GC- APCI II” source that supposedly addressed shortcomings of the original GC-APCI I source such as gas turbulences, cold spots, and insufficient heating, which had exerted a negative impact on ionization and ion transfer into the MS. The new source was there- fore subjected to comprehensive testing to evaluate detection sensitivity, repeatability and suitability for metabolic fingerprinting. Initially, a commercial 37-component FAME mixture was used to investigate the repeatability of retention time, peak width and ioni- zation efficiency for structurally similar compounds over a wide boiling point range. To assess the quantitative potential of APCI II in comparison to its predecessor, figures of merit for metabolic profiling were determined from calibration curves of 20 MeOx-TMS derivatized metabolite standards and nine ISs. Both source types were also employed in the analysis of three biological replicates of cell culture supernatants with the objec- tive of comparing their performance with regard to technical variability and identification of metabolites.
Aim #2: Application of GC-APCI-HRTOFMS to the enantioselective quantitative profiling of D/L-2-HG
The goal was the development of an enantioselective, sensitive, and reliable quantifica- tion approach for 2-hydroxyglutarate (2-HG). Analysis of 2-HG has become increasingly important in cancer biology due to the observed accumulation of D-2-HG in several types of cancer mostly as a result of neomorphic mutations in the isocitrate dehydro- genase (IDH) 1 and 2 genes. To separate D and L enantiomers of 2-HG, MCF derivati- zation and a chiral cyclodextrin (CD)-based Rt-DEXsa capillary column were tested based on previous experiences in our laboratory with the enantioselective GC analysis of amino acids. To prove its reliability, the method was validated by means of spike-in experiment in serum and cross-validation of total 2-HG levels in human urine specimens was carried out using HPLC-ESI(-)-MS/MS.
5
Parts of this thesis have been already published [13-17]. The funding by the Bavarian Genome Network BayGene of the Bavarian State Ministry of Sciences, Research and the Arts (Munich, Germany) and the DFG (KFO 262, DE 835/2-1) is gratefully acknowl- edged. All persons mentioned in this thesis are current or former members of the Insti- tute of Functional Genomics of the University of Regensburg, Regensburg, Germany, unless stated otherwise.
6
4 Background
Parts of this chapter were published in book chapters [15] and [16]. The focus is primari- ly on GC-MS based metabolomics.
4.1 Metabolomics
Metabolomics aims at providing an in-depth view of chemical changes in cells, tissues, organs or organisms evoked by cellular processes in response to genetic and environ- mental causes [18]. It is an integral part of systems biology and provides a direct link between an external stimulus and the non-structural phenotype or physiology of a bio- logical system [19,20]. Since the metabolome represents the endpoint of the “omics”
cascade (Figure 4.1), it yields a more predictive phenotype than the genome, transcrip- tome and proteome, respectively. It also captures the dynamic changes that occur in response to genetic and environmental constraints much better, with the composition of the metabolome having been observed to change within seconds, whereas turnover in the proteome and transcriptome (minutes to hours) is considerably slower [21].
7
Figure 4.1 The metabolome represents the endpoint of the "omics" cascade. Reprinted with permission from [22].
4.1.1 Challenges
Metabolome analysis comprises both the qualitative and the quantitative assessment of low-molecular mass compounds (<1,000 Da), which show tremendous diversity in their chemical and physical properties. Moreover, metabolite concentrations range over up to ten orders of magnitude. The physicochemical diversity and wide range of abundance of metabolites in biological specimens constitute major challenges in the comprehensive determination of the metabolic state of biological systems, requiring the combination of several analytical platforms such as nuclear magnetic resonance (NMR) spectroscopy and direct-infusion or hyphenated mass spectrometry (MS). Proton NMR presents the closest to a universal nondestructive detector that provides in combination with carbon- 13 NMR an indispensable tool for the structural elucidation of unknown metabolites.
However, it lacks the detection sensitivity of MS required for the determination of me- tabolites in the submicromolar concentration range. For that reason, MS in combination with chromatographic separation techniques such as LC and GC has become a widely used, albeit still to be perfected tool in targeted and non-targeted metabolomics. Exist- ing shortcomings include instrumental drift, ion suppression and the lack of comprehen- sive mass spectral libraries for LC-MS and in case of GC-MS the frequent need for derivatization, which carries pitfalls such as the degradation of metabolites and the lack
8
of metabolite mass spectral libraries for derivatives other than silylated compounds.
Moreover, reference compounds are only available for a subset of metabolites. One way of overcoming the lack of comprehensive mass spectral libraries is the use of soft ionization techniques that generate gas-phase ions without extensive fragmentation. In combination with high-resolution MS, measurement of the accurate mass of non- fragmented protonated molecules allows calculation of elemental formulas that can then be searched against metabolite databases for putative metabolite identification. In addi- tion to cross-platform approaches to cope with analyte diversity, various metabolite databases can be searched (e.g. HMDB [23], LIPID MAPS [24], and Metlin [25]). Once identified, metabolites may be visualized within their metabolic pathways (e.g. provided by KEGG database) to facilitate biological interpretation. Finally, metabolomics data can be incorporated with results obtained by the other –omics methods to obtain a global picture of the biological entity under study.
Apart from the high diversity of metabolites, undesired variation in metabolite levels might be introduced at each stage of the metabolomics workflow and pose an additional challenge to the analytical chemist. In order to minimize variability introduced during sample preparation, standardized protocols for quenching, extraction and derivatization steps are essential and should be followed as proposed by Sumner et al. in 2007 [26].
Still, it is almost impossible to avoid analyte losses during sample preparation. There- fore, stable isotopically labeled internal standards (SIL-ISs) are commonly used to ac- count for analyte losses, and apart from that for injection variability, instrumental drift and ion suppression.
4.1.2 Strategies
Two different strategies are mostly used in metabolomics [22,27]. These are metabolite profiling or targeted analysis of a small number of analytes on the one hand, and meta- bolic fingerprinting on the other hand. For metabolite profiling, i.e., the quantitative anal- ysis of pre-selected metabolites, analytical methods are tailored for the separation and sensitive detection of the target analytes. Reference substances in known concentra- tions and an appropriate set of internal standards are used to construct calibration
9
curves to quantify the target analytes in biological specimens. Alternatively, isotope dilution analysis can be employed for quantification. Stable isotopically labeled analogs of the target analytes are spiked into the samples in known concentration and quantifi- cation is performed by comparing the peak area of the target analyte to that of the la- beled standard. For metabolic fingerprinting, the complete GC-MS or LC-MS chromato- gram is exported and analyzed. One can either search for signals that change significantly between sample groups or use the chromatograms to classily samples.
This does not require knowledge of the identity of the signals, often referred to as fea- tures or markers. Metabolite identification is then restricted to those features that yield- ed significant differences in signal intensity between sample groups. Aiming at the sim- ultaneous detection of the highest possible number of metabolites, sample preparation is typically kept to a minimum in metabolite fingerprinting to prevent analyte losses. In targeted studies, on the other hand, sample preparation is tailored to the specific ana- lytes and, thus, typically more extensive to reduce chemical complexity of the samples prior to analysis.
Apart from targeted and untargeted analyses, the analysis of metabolic flux using stable isotopically labeled substrates has been a valuable tool in the study of dynamic pro- cesses in a cell. Instead of measuring only metabolite abundances, flux experiments can reveal the flux of carbon (or nitrogen) atoms derived from substrates such as glu- cose, glutamine or other amino acids, through different metabolic pathways and detect changes in rates of metabolic reaction due to certain perturbations. The number of publications reporting flux experiments has increased steadily in recent years [28,29].
4.2 Established GC-MS approaches in metabolomics
Gas chromatography coupled to mass spectrometry (GC-MS) is an indispensable tool in metabolomics. It is perfectly suited for the analysis of small volatile metabolites. Capil- lary GC is capable of resolving very complex mixtures and MS provides highly selective and sensitive detection of metabolites along with their identification. Capillary GC can be easily interfaced with an MS instrument as carrier gas flow rates of about 1 mL/min
10
are compatible with modern MS vacuum systems. Moreover, analytes have already been transferred into the gas phase before reaching the ion source of the MS.
4.2.1 Derivatization strategies
Major prerequisites for GC-MS analysis include a sufficient vapor pressure and thermal stability of metabolites. Most metabolites, such as amino acids, organic acids, sugars and alcohols, possess polar functional groups, which have to be derivatized prior to GC analysis. Apart from increasing volatility and thermal stability, derivatization of the ana- lytes can improve chromatographic properties. It can provide additional structural infor- mation and improve both, lower limits of quantification and selectivity for quantitative measurements. However, derivatization prolongs overall analysis time and adds vari- ance to the analysis. It can also hamper identification of metabolites, derivatives of which are not contained in mass spectral libraries. Overall, derivatization should be simple, fast, automatable, efficient, reproducible, and spectral libraries of the derivatives are needed. Halket and Zaikin extensively reported on derivatives for mass spectrome- try in a series of reviews, which in each case deals with a single derivatization reaction, e.g., silylation [30]. Among others, silylation, acylation, alkylation/esterification, the for- mation of cyclic derivatives and generation of mixed derivatives of polyfunctional com- pounds has been performed for GC-MS.
4.2.1.1 MeOx-TMS derivatization
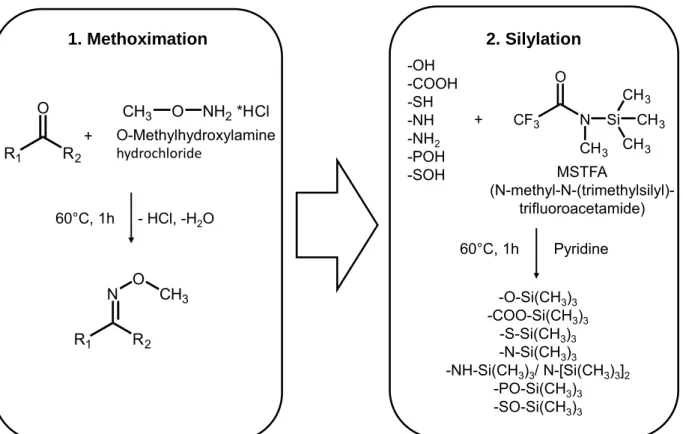
In 2011, Koek et al. [31] reviewed a large number of metabolomics studies with respect to the pursued derivatization strategy. The majority of GC(-MS) methods employed silylation with or without prior oximation. Figure 4.2 provides the example of a typical two-step derivatization strategy including methoximation followed by silylation using N- methyl-N-(trimethylsilyl)-trifluoroacetamide (MSTFA).
11
1. Methoximation 2. Silylation
-OH -COOH -SH -NH -NH2 -POH -SOH + +
- HCl, -H2O
O-Methylhydroxylamine hydrochloride
MSTFA
(N-methyl-N-(trimethylsilyl)- trifluoroacetamide)
-O-Si(CH3)3 -COO-Si(CH3)3
-S-Si(CH3)3 -N-Si(CH3)3
-NH-Si(CH3)3/ N-[Si(CH3)3]2 -PO-Si(CH3)3 -SO-Si(CH3)3 CF3 N
O
CH3 Si
CH3 CH3
CH3 CH3 O NH2*HCl
R1 R2 O
R1 R2 N O
CH3 60°C, 1h
60°C, 1h Pyridine
Figure 4.2 Commonly used two-step derivatization procedure for GC-MS based metabolomics.
Oximation reagents, such as hydroxylamines or alkoxyamines, react with aldehyde and keto groups. They react with open-chain reducing sugars thereby preventing ring for- mation of reducing sugars. The derivatization results in the formation of two stereoiso- mers (syn and anti form) that can be separated chromatographically. Further, decarbox- ylation of -ketocarboxylic acids and keto-enol tautomerism is hindered. MSTFA or N,O-bis-(trimethylsilyl)-trifluoroacetamide (BSTFA) are typically used reagents for silyla- tion. They replace active hydrogen atoms in functional groups, such as -COOH, -OH, -NH and -SH, with a trimethylsilyl (TMS) group. In case of silylation reagents that con- tain chlorine atoms, small amounts of a catalyst, e.g. 1% of trimethylchlorosilane, are added. Silyl derivatives are prone to hydrolysis in the presence of traces of water. Con- sequently, anhydrous conditions have to be employed. Bulkier silylation reagents, such as N-methyl-N-(tert-butyldimethylsilyl)-trifluoroacetamide (MTBSTFA), have been shown to be less susceptible to hydrolysis [32]. Moreover, tert-butyldimethylsilyl derivatives show characteristic [M-57]+ ions in EI-MS, which may facilitate the identification of un- known compounds [33], but requires harsher reaction conditions.
12
Oximation followed by silylation is often employed in non-targeted metabolomics [12,17]
because of the ready derivatization of many different functional groups and the availabil- ity of large spectral libraries [31]. However, degradation or rearrangement reactions have been reported, e.g. arginine is decomposed to form ornithine [34], and glutamate rearranges to pyroglutamate. Partial silylation yielding multiple peaks for amino acids is a well-known problem, which can be addressed by either weighting correctly the multi- ple peaks [35] or by summing up the responses of all derivatives [36].
Modern GC instruments equipped with advanced sample robots (e.g., from CTC Analyt- ics AG or Gerstel) enable the sequential automated derivatization of sample analytes immediately prior to their analysis instead of off-line en bloc derivatization, thereby min- imizing hydrolysis and variability in the ratio of partially derivatized metabolites.
Large numbers of derivatizable groups may lead to indefinite retention of an analyte on the GC column or the molecular mass of the derivative might exceed the mass range of the detector [30]. Native lactose, for example, has a molecular mass of 342 Da, which increases to 947 Da after methoximation and the introduction of 8 trimethylsilyl groups.
Furthermore, silylation is neither simple nor fast, as it cannot be performed in aqueous solution or in the presence of protic solvents and usually requires heating for some time, especially in case of amines.
4.2.1.2 Derivatization with alkyl chloroformates
In 2011, Villas-Bôas et al. [37] compared silylation to derivatization with methyl chlo- roformate. The authors concluded, that a combination of both derivatization approaches leads to a more comprehensive coverage of the metabolome. Alkyl chloroformates are used as reagents to esterify carboxylic groups to form the corresponding alkyl ester, while carbamates are derived from amino groups (Figure 4.3). This derivatization has emerged as an attractive alternative to silylation, especially for amino acids [38,39] and non-amino organic acids [40]. The reaction is fast and feasible in aqueous media at room temperature, which makes it easy to handle. Kaspar et al. [38] demonstrated its potential for full automation. Nevertheless, alkyl chloroformate derivatization is less versatile compared to silylation. Moreover, comprehensive mass spectral libraries are
13
still lacking and need to be developed, which renders methoximation/silylation overall the method of choice in GC-MS based metabolomics.
Interestingly, in contrast to the study by Koek et al. in 2006 [41], Villas-Bôas et al. [37]
described a poor analytical performance for TMS derivatives. This underscores the importance of strictly enforced standard operation procedures such as the regular re- placement of GC-inlet liners and trimming of the inlet end of the capillary column, as well as the addition of several SIL-ISs to monitor performance of extraction and derivati- zation [41]. More details on experimental strategies including quality control are provid- ed in subchapter 4.4.
OH O
H H2N
R
+ Cl
O
O 2
MeOH Pyridine CHCl3
O O
H NH
R O O
Figure 4.3 Reaction scheme for the derivatization of amino acids with methyl chloroformate.
4.2.2 GC stationary phases
For GC separation, analytes have to be transferred into the gas phase, which is typically achieved by a hot split/splitless injector or by a programmed-temperature vaporizer (PTV). Nowadays, GC separation is commonly performed using capillary columns.
These are open tubular columns with an inner diameter of less than 1 mm and a length of 1 – 100 m. The stationary phase is coated to the inner wall of the column. The sta- tionary phase can either be a highly viscous liquid (WCOT – wall coated open tubular column), with analyte separation attained by partitioning of the analytes into the liquid (GLC – gas liquid chromatography), or a solid adsorbent (PLOT – porous layer open tubular column) for adsorption-based separation (GSC – gas solid chromatography).
GSC is mainly used for highly volatile analytes such as permanent gases. In metabo- lomics, GLC prevails. A variety of stationary phases (SPs) are available. Non-polar SPs provide separation of analytes as a function of mere differences in vapor pressure, while polar SPs allow the exploitation of additional polar interactions. Common SPs are pol- ysiloxanes, which are modified with both non-polar methyl groups (PDMS – polydime-
14
thylsiloxane) and polar phenyl- or cyanopropyl groups to tune the polarity of the phase.
The recently introduced ionic liquid SPs are an attractive alternative to polysiloxane SPs. Furthermore, direct stereoselective analyses can be carried out using chiral SPs, such as the widely used Chirasil-L-Val SP or CD-based SPs, which separate enantio- mers by formation of inclusion complexes. However, due to the huge chemical diversity of metabolites there is no single ideal column chemistry capable of covering entire metabolomes. Rather, multiple SP chemistries tailored to different classes of metabo- lites or their derivatives have to be employed sequentially to achieve comprehensive coverage.
4.2.3 GC-MS with EI and CI sources
Capillary GC lends itself to interfacing with MS, as analytes have been already trans- ferred into the gas phase and carrier gas flow rates are compatible with modern vacuum systems. Hyphenation of GC and MS is typically accomplished by means of electron ionization (EI), which is a hard ionization technique under high vacuum. Electrons are emitted from a heated wire filament usually at electron energies of 70eV. In an initial step, radical cations are generated from gas phase molecules. Subsequent fragmenta- tion reactions, losses of neutral groups and rearrangement of secondary ions occur because electron energies are by far exceeding ionization energies of organic mole- cules. This yields predictable ion patterns, which can be interpreted by the experienced scientist. Moreover, EI is highly reproducible and, therefore, huge commercial spectral libraries containing currently up to 242,000 unique compounds (NIST 14 Mass Spectral Library) have been built for routine identification of analytes. However, structural iso- mers often show similar EI spectra, thus precluding unambiguous compound identifica- tion in the absence of additional information such as differences in chromatographic retention. Further, both the still incomplete coverage of natural metabolites in spectral libraries and the frequent absence of molecular ions in EI mass spectra continue to constitute major bottlenecks in the identification of group discriminating features. There- fore, soft ionization techniques that preserve intact protonated molecules have become prominent in recent years, such as chemical ionization (CI) and APCI (subchapter 4.3).
Operation in CI mode takes place under low vacuum in the presence of a reagent gas,
15
e.g. methane, isobutane or ammonia. Electrons emitted from a heated wire filament initially ionize the reagent gas, which is present in great excess. Subsequently, analytes are ionized by ion-molecule reactions (Figure 4.4).
2 4 5
5 5
4 5
5 4
70 , 4
] [
] [
] [
4
H CH H
M CH
MH
CH M CH
M
CH H
M CH
M
CH CH
CH
e eV CH
Figure 4.4 Primary reaction gas (methane) ion formation and secondary analyte (M) ion formation in positive chemical ionization mode.
However, extensive soft ionization mass spectral libraries have not been built yet. In case of CI this is owed to the strong dependence of mass spectra on the nature and pressure of the reactant gas. Hence, a lot of manual effort by the user is still required during data analysis.
The appropriate choice of mass analyzer depends on the aim of the study. Mainly quad- rupole (qMS) and time-of-flight mass spectrometers (TOFMS) are applied to metabo- lomics. Quadrupole mass analyzers enjoy widespread use. They are inexpensive, ro- bust and easy to handle. But they are limited in mass range and scan speed and, in most cases, restricted to nominal mass resolution. Therefore, quadrupoles are com- monly used in routine analysis either in full scan mode or selected ion monitoring (SIM) mode, with the latter achieving lower limits of quantification due to a longer dwell time on pre-selected masses. Even more powerful is the sequential combination of three quadrupoles, which offers highly specific and sensitive quantitative analysis. In addition, structural information on the analytes is provided as an asset by tandem mass spec- trometry (MS/MS). TOFMS instruments provide not only low limits of quantification but also wide dynamic ranges over up to four orders of magnitude. Fast-acquisition TOFMS instruments, which acquire up to 500 spectra per second, are a prerequisite for the successful resolution and integration of the very narrow chromatographic peaks realized by fast GC or GC×GC. Typically, however, they provide only nominal mass resolution.
On the other hand, TOFMS instruments that are operated at acquisition rates of 20 – 50
16
spectra/s provide enhanced mass spectral resolution and accuracy of ion masses, which facilitates the identification of unknown compounds. However, TOFMS instru- ments are sensitive to voltage or temperature fluctuations requiring external as well as internal (re-)calibration of the mass scale on a regular basis. Even better suited for the identification of unknowns are hybrid qTOFMS instruments that combine one or more quadrupoles with a TOF mass analyzer. This MS type enables the determination of parent and fragment ions with high mass accuracy.
4.2.4 Comprehensive two-dimensional gas chromatography – time-of- flight mass spectrometry
Despite high chromatographic resolution, overlapping peaks and coelutions are still observed in the analysis of complex samples by one-dimensional GC. Comprehensive two-dimensional GC (GC×GC) is a powerful analytical tool to tackle this problem and its application to metabolomics has been recently reviewed [42]. It uses two columns with orthogonal separation characteristics that are connected via a modulator. Typically, a nonpolar/polar column combination is employed. Hence, separation on the first column is essentially driven by differences in vapor pressure. Subsequent resolution of isovola- tile sample components in the second dimension arises from the different strengths and types of polar interactions with the stationary phase. A number of different modulators are available that mostly employ thermal modulation. For example, the dual-stage four- jet modulator from LECO Corporation (St. Joseph, MI, USA) uses alternatingly nitrogen- cooled cold jets for the periodic trapping of effluent from the first column in small seg- ments that are then transferred to the very short second column upon hot jet remobiliza- tion. Commonly, because of their high data acquisition rate, TOF mass analyzers are used to record the narrow peaks (peak widths of 50 – 200 ms) created by the focusing step and the fast separation in the second dimension. Electron ionization is used to generate fragment mass spectra that are then matched against available spectral librar- ies. GC×GC-MS chromatograms are displayed as so-called 2D contour plots. The first and second column retention times are represented on the x-axis and y-axis, respec- tively, and a color code depicts the detector response. An exemplary GC×GC-MS chromatogram of a methanolic avocado pulp extract is given in Figure 4.5. Peak anno-
17
tation was based on spectral matching to the NIST 05 library using a cut-off score of 700.
Figure 4.5 GC×GC-TOFMS chromatogram of an avocado sample. Avocado pulp (40 mg) was homoge- nized and extracted using cold methanol, extract was dried, derivatized (methoximation/silylation), and analyzed by GC×GC-TOFMS [12]. For peak annotation spectral matching to the NIST 05 library was performed using a cut-off score of 700. Signals marked in italics refer to internal standards. C16, palmi- tate; C18, stearate; C18:1, oleate. Reprinted with permission from K. Dettmer et al, in W. Weckwerth, G.
Kahl (Editors), The Handbook of Plant Metabolomics, Wiley-VCH, Weinheim, 2013, p. 77.
Comprehensive two-dimensional GC separations not only offer enhanced resolution and a multiplicative increase in peak capacity over conventional GC methods, but also narrower peaks due to modulation and, hence, improved detection sensitivity. The latter was demonstrated for a standard mixture of 43 metabolites that was analyzed by both, one-dimensional and comprehensive two-dimensional GC-TOFMS [17]. For most me- tabolites, lower limits of quantification were at least one order of magnitude lower using GC×GC-TOFMS. Still in need of improvement are convenient and practicable ways of data analysis to make full use of GC×GC-TOFMS for metabolic fingerprinting. In a first step, the raw data is pre-processed, for instance, in LECO’s ChromaTOF software. This includes background subtraction, deconvolution, picking of peaks and their integration, as well as combining several modulations belonging to one compound. Further, align- ment tools must be capable of correctly aligning chromatograms within and across batches. This requires correction for shifts in retention time to recognize the same ana- lyte across different samples. In addition to shifts in retention time, incorrect peak recognition can be caused by poor mass spectral deconvolution. These effects can
18
result in missing values in the alignment table despite the presence of the peak in the chromatogram, which impedes discriminate analysis. Quantitative analysis using GC×GC-TOFMS data can also be time-consuming. Employing peak based quantifica- tion tools, the peaks from all modulations must be integrated to determine the response of an analyte. Since the software may fail in the proper integration of minor subpeaks, manual inspection and correction of integrated peaks may be necessary [43].
4.3 Atmospheric pressure chemical ionization for GC-MS
In this subchapter, the fundamentals of GC-APCI-MS and recent applications are de- scribed, with an emphasis on the role of clusters in atmospheric pressure ionization.
4.3.1 Fundamentals
Historical outline (taken from [44])
APCI was first introduced by Horning et al. in 1973 [1] using 63Ni as a beta-emitter for ionization that was later replaced by a corona discharge ion source [2,45]. A range of applications were described by then, such as GC-APCI-MS in negative ion mode for environmental studies [46] as well as APCI-MS for gas analysis [47]. However, the technique was not widely used, in part because of the expensive instrumentation and due to already commercially available “plug and play” EI and CI GC-MS systems.
APCI again attracted attention during the 1980s, when the introduction of electrospray ionization for LC-MS [48] caused a breakthrough in the development of LC-MS ion sources for generating ions at atmospheric pressure. Unlike previous LC-MS interfaces, such as particle beam or thermospray, where ions were generated under vacuum condi- tions, molecules are ionized at atmospheric pressure in ESI and APCI. However, APCI was initially only used as an ionization interface for LC-MS.
The renaissance of atmospheric pressure ionization techniques for GC-MS started just recently, when both McEwen and McKay [4] and Schiewek et al. [3] modified an API source on a commercial LC-MS instrument to enable an easy switch between various
19
ionization modes and to use both LC and GC with one certain mass spectrometer. The exciting potential of the latter investigations has led to the development of commercially available APCI sources that allow the hyphenation of GC to high-resolution TOF or QTOF mass spectrometers and tandem mass spectrometers that were previously only coupled with LC.
Hence, distinctly lower quantification limits than previously obtained with quadrupole instruments can be achieved and features such as accurate mass measurements for chemical formula determination of unknown analytes can be exploited. A further ad- vantage of GC-MS is the ability to observe compounds of low polarity that are not ame- nable to LC-MS. These benefits are especially important in the study of complex mix- tures as in the field of metabolomics. A major drawback remains the lack of convenient libraries [44].
GC-APCI-TOFMS instrumental setup
One of the first successful attempts to couple GC to TOFMS was made by Erickson et al. in 1990 [49] by applying time array detection, which yielded data acquisition rates of up to 20 spectra/s and, hence, the optimization of chromatography for speed of analysis with no loss in chromatographic resolution or analyte detectability. Furthermore, the more widespread use of GC-TOFMS was fostered by the introduction of soft ionization techniques [4,50-53] for the determination of the elemental composition of unknown analytes and analog-to-digital converters distinctly increasing the dynamic range of TOFMS instruments [5].
In the following, the GC-APCI I-TOFMS instrumental setup employed in this thesis is described (adapted from [44]).
The first APCI source (APCI I) commercialized by Bruker Daltonics consists of a rectan- gular aluminium chamber with five different ports A-E (compare Figure 4.6, [3]). Port A is mounted on the ion source mounting flange of the Bruker MS. The GC is connected to the ion source via a heated transfer line assembly at port B opposite to port A. The transfer line is fixed and heated externally by a controller to prevent compound conden-
20
sation. Port E, located at the top of the ion source, contains the LC vaporizer stage, which is used for external hot nitrogen supply (illustrated in yellow in Figure 4.7) in case of GC to compensate for the relatively large pumping speed of the MS and to generate the heat required for the APCI process. Ports C and D are both arranged perpendicular to the longitudinal axis of the GC transfer line. Port C is sealed with an optical window and the corona needle assembly is mounted on Port D. This places the needle tip in close vicinity to the GC effluent and sheath gas flow. Figure 4.7 shows a general scheme of the GC-APCI-TOFMS setup. A sheath gas flow (nitrogen, illustrated in or- ange in Figure 4.7) is introduced through coaxial holes around the outlet of the GC capillary and envelopes eluting analytes on their way through the source. Moreover, it directs the generated ions towards the MS. The source is purged with a clean dry gas (N2) to prevent reduction of ions by contaminants [3]. However, part of the dry gas is not directed into the APCI source but soaked into the transfer capillary (illustrated in red in Figure 4.7), which causes gas turbulences in front of the end plate of the capillary.
Furthermore, the vaporizer gas is a major source of the overall extensive gas turbulenc- es in the APCI I source, so that is was omitted for the second-generation APCI II source (see section 8.2.2). With regard to the ionization several APCI source parameters have to be optimized for a specific application namely drying gas (nitrogen) temperature and flow rate, vaporizer temperature and gas (nitrogen) pressure, current of corona needle discharge and capillary end plate voltage (compare Figure 4.7).
Figure 4.6 Scheme of the APCI I source body. Reprinted with permission from [3].
21
End plate
Capillary N2Dry Gas N2Sheath Gas
He/Sample N2Sheath Gas
Vaporizer
N2 M: Analyte
Corona Needle N2
++ H3O+ M
H3O+(H2O)n [M+H]+
++ N4+
N2+ H2O N2
M
Transferline from GC
MS
McEwen & McKay J Am Soc Mass Spectrom 2005 Schiewek et al. Anal Bioanal Chem 2008
N2
N2
Figure 4.7 GC-APCI-TOFMS setup and ion species present during the ionization procedure [3,4,45]. The flow direction of sheath gas, vaporizer gas, and dry gas is indicated by orange, yellow, and red arrows, respectively. Modified and reprinted from [15] with permission from Elsevier.
In addition to the ionization in the APCI source, different stages of the ion transfer are crucial for the quality of the obtained APCI mass spectrum and have to be pointed out.
Since analytes are ionization at atmospheric pressure, but ion separation in the mass analyzer is achieved under high vacuum conditions, pressure has to be reduced step- wise in consecutive stages within the mass spectrometer. As discussed by Klee et al.
[54,55] up to seven different domains can be distinguished within the overall ion genera- tion and detection process. For the microTOF (Bruker Daltonics) employed here, this includes regions of primary and secondary ion generation, ion transfer to the MS, three different vacuum pumping stages and ion optics. The domains are characterized by varying chemical composition, temperature and pressure, which lead to rapid switching of the dynamic entity of analyte ions and surrounding matrix.
Apart from the GC-MS approach followed in this thesis, APCI has been used for analyz- ing compounds from solid or liquid surfaces. A detailed overview of AP surface sam-
![Figure 4.1 The metabolome represents the endpoint of the "omics" cascade. Reprinted with permission from [22]](https://thumb-eu.123doks.com/thumbv2/1library_info/4651859.1608323/27.892.339.573.120.411/figure-metabolome-represents-endpoint-omics-cascade-reprinted-permission.webp)
![Figure 4.5 GC×GC-TOFMS chromatogram of an avocado sample. Avocado pulp (40 mg) was homoge- homoge-nized and extracted using cold methanol, extract was dried, derivatized (methoximation/silylation), and analyzed by GC×GC-TOFMS [12]](https://thumb-eu.123doks.com/thumbv2/1library_info/4651859.1608323/37.892.109.812.160.446/chromatogram-avocado-extracted-methanol-derivatized-methoximation-silylation-analyzed.webp)
![Figure 4.7 GC-APCI-TOFMS setup and ion species present during the ionization procedure [3,4,45]](https://thumb-eu.123doks.com/thumbv2/1library_info/4651859.1608323/41.892.108.799.90.499/figure-apci-tofms-setup-species-present-ionization-procedure.webp)
![Figure 4.9 GC-MS mass spectra of standards (62.5 M) using hard and soft ionization techniques as described elsewhere [17]](https://thumb-eu.123doks.com/thumbv2/1library_info/4651859.1608323/45.892.108.804.90.562/figure-mass-spectra-standards-using-ionization-techniques-described.webp)