Thin-layer chromatography combined with diode laser induced desorption/atmospheric pressure chemical ionization
mass spectrometry
Zur Erlangung des akademischen Grades eines Dr.rer.nat
vom Fachbereich Bio- und Chemieingenieurwesen der Universität Dortmund genehmigte Dissertation
vorgelegt von M.Sc.-Chem. Song Peng
aus
Nanchang City, Jiangxi Province, China
Tag der mündlichen Prüfung: 18/08/2005
1. Gutachter: Prof. Dr. Andreas Manz
2. Gutachter: Prof. Dr. Thorsten Hoffmann
Contents
—————————————————————————————————
—————————————————————————————————
Abstract………...…3
1. Introduction………..……4
1.1 Projective intention………...……….………..……4
1.2 Conceptions………...……6
2. Theoretical background………...………..………10
2.1 Basic techniques involved in this work………..……...…………...…….10
2.1.1 Diode laser………...10
2.1.2 APCI/MS ………13
2.1.3 TLC………...……..15
2.2 TLC-MS………...………16
2.2.1 EI and CI………...17
2.2.2 SI, FAB and LSI……….….18
2.2.3 ESI………...19
2.2.4 LD, MAILDI and SALDI………21
2.2.5 Scanning device………...………23
3. Diode laser induced desorption in combination with APCI mass spectrometry on graphite substrate……….….26
3.1 Chemicals and sample preparation………...……27
3.2 Design of ion source and experimental setup...………29
3.3 Optimization of experimental conditions………..31
3.4 Analysis of a compound with moderate molecular weight………..32
3.5 Analysis of complex samples..………35
4. Thin-layer chromatography combined with diode laser desorption/APCI mass spectrometry………..………41
4.1 Preparation of graphite-covered TLC plates………...…………42
4.2 Analysis on graphite-covered TLC plates…...………..…43
4.2.1 Positive ion mode………..………...43
4.2.2 Negative ion mode………..……….45
4.3 Influence of glycerol………...…….46
4.4 Influence of the amount of graphite……….…….47
4.5 Influence of laser power……….…49
Contents
—————————————————————————————————
—————————————————————————————————
5. A new interface to couple mass spectrometry for thin-layer
chromatography full-plate scanning………...……….51
5.1 Instrumental setup of the plate scanning system………..………...52
5.2 Chromatography………...……..53
5.3 Scanning on untreated TLC plates……….………..…….54
5.3.1 Scanning of a single compound after development…….………54
5.3.2 Scanning of a mixture after separation……….………...56
5.4 Scanning on the TLC plate with graphite assistance……….…..58
5.4.1 Graphite covered plates………..……….……….58
5.4.2 Graphite embedded plates………..………..60
5.5 Influence of scanning speed………..…..63
5.6 Rapid screening………...64
6. Quantification with the plate scanning device……….……67
6.1 Quantification in mass spectrometry………67
6.2 Quantification in TLC-MS……….…68
6.3 Quantification for the TLC plate scanning system………..69
7. Conclusions……….74
8. References………...……76
Acknowledgements………..………86
Abstract
—————————————————————————————————
—————————————————————————————————
Abstract
An analytical technique to combine TLC with MS was developed. The initial study was carried out on a graphite plate, which functions as a photon absorbing material. A continuous wave diode laser replaced traditional pulsed lasers as the desorption source, which was employed for this purpose for the first time. The thermally desorbed analyte molecules are ionized in the gas phase by a corona discharge device at atmospheric pressure and detected subsequently by a mass spectrometer, by which both essential processes ― the desorption and the ionization of analyte molecules, which are often performed in one step - are separated. The technique was subsequently applied to thin-layer chromatography (TLC) to realize the combination of TLC and mass spectrometry. A graphite suspension was employed to couple the laser energy and improve the desorption efficiency. In this case, the necessary power density for desorption was decreased by two orders of magnitude. In addition, a TLC plate-scanning device was developed, by which the chromatography on a TLC plate can be recovered, and rapid screening for numerous analytes on a TLC plate can be achieved. The device can also be applied for the identification of unknown compounds or to recognize overlapping sample spots. Finally, a quantification method for this system was developed. An internal standard was added into the mobile phase to yield a ‘background’
signal, which was used as a reference signal for the quantification. In this
way, a wide range of compounds can be chosen for this purpose.
1. Introduction
—————————————————————————————————
—————————————————————————————————
1. Introduction
1.1 Projective intention
Thin-layer chromatography (TLC), as an economic and handy chromatographic separation technique, has been extensively used for many years. The attractive features of TLC include parallel sample processing for high sample throughput; accessibility of the sample for post- chromatographic evaluation free of time constraints; detection in the presence of the stationary phase independent of mobile phase properties;
and the stationary phase is normally used only once. It is generally agreed that thin-layer chromatography is most effective for the low-cost analysis of samples requiring minimal sample clean-up, or where thin-layer chromatography allows a reduction in the number of sample preparation steps (e.g. the analysis of samples containing components that remain sorbed to the stationary phase). Thin-layer chromatography is also preferred for the analysis of substances with poor detection characteristics requiring post-chromatographic treatment for detection. Since all sample components are located in the chromatogram, thin-layer chromatography is the most suitable technique for surveying sample properties. The popularity of TLC owes not only to the modest demands on instrumentation, but also to its sensitivity, general applicability, and, last but not least, its flexibility.
TLC can be viewed as the complementary technique in contrary to
column chromatography, such as high-performance liquid chromatography
(HPLC) due to their different attributes, resulting in a preference for one
approach over the other independent of the application. However, the
separated analytes are mostly detected with visual methods such as
staining techniques, ultraviolet (UV) absorption and fluorescence
1. Introduction
—————————————————————————————————
—————————————————————————————————
extinction, which causes the inability to identify the analytes and a low specificity with partially overlapping substances in TLC. It does not obstruct a technique like HPLC because the combination of HPLC and mass spectrometry (MS) has been developed to a reliable and robust technique in the last years. Obviously, mass spectrometry is an excellent technique for identification. Therefore, the full complement of identification and quantification tools available to column liquid chromatography is the desirable goal for thin-layer chromatography. It somehow means an interface for scanning and recording in situ mass spectra.
The introduction of mass spectrometry is mostly realized by a ‘scrape and elute’ mode, i.e. scrape the stationary phase containing analytes;
elute/extract analytes from the stationary phase to a solvent; finally introduce the solvent into the ion source of the mass spectrometer in the regular way. Analytical strategies of TLC-MS are still widely carried out in this mode at present. However, as described, the whole procedure is time consuming and destructive for chromatography. In fact, it is not a way to really ‘couple’ mass spectrometry to thin-layer chromatography, but just a sample preparation process for mass spectrometry. It is suitable for the analytical work that has strict time limitation in method development or have a requirement for post-chromatographic treatment.
However, the advantage of high throughput analysis is lost. In contrast, a modern mass spectrometer coupled to a liquid chromatographic system can acquire data automatically and has large advantages in the analysis of complex samples. Moreover, several robust ionization methods have been developed for LC/MS coupling. However, its method development and separation process are normally time-consuming, and often not suitable for high throughput analysis. If a TLC/MS system can be realized
‘instrumentally’, it will have advantages of quick experimental procedure,
1. Introduction
—————————————————————————————————
—————————————————————————————————
large capacity for sample handling, and powerful identification ability at the same time.
There are three major factors in an ‘instrumental’ TLC/MS system:
sampling, transport and ionization. Sampling mode decides how to acquire analytes from the bulk of TLC material. Transport part delivers molecules/ions from the TLC plate, after they are somehow obtained, to the mass spectrometer. Finally, ionization has to be achieved for the mass spectrometric analysis. These three factors influence each other and determinate the structure and performance of an ‘instrumental’ TLC/MS system.
1.2 Conceptions
On an intact TLC plate during the scanning process, the acquirement of analyte molecules should be efficient (which means a high recovery rate of the analyte), fast, and possess high spatial resolution. One parameter effecting the performance is the scanning speed. Lower speed normally causes higher sample recovery but longer analysis time. There are two methods to acquire molecules from TLC: desorption with energy or extraction with a liquid. The latter is based on the same principle as the
‘scrape-elute’ mode, but with a probe to sample continuously and does not
destroy the plate. The solvent containing extracted analytes is transferred
to the ion source of the mass spectrometer and subsequently obtain the in
situ mass spectra. The choice of the ionization method for such a device is
normally electrospray ionization (ESI). However, such a sampling mode
involves the choice of solvent, which is critical for the extraction
efficiency, and an inevitable diffusion of the analyte molecules on the TLC
plate due to the use of the liquid. A desorption with energy has inherent
advantages in respect to spatial resolution. In fact, it is more widely used
compared to the extraction mode. Several methods to provide the
1. Introduction
—————————————————————————————————
—————————————————————————————————
desorption energy exist, such as thermal desorption, laser desorption or desorption with fast atoms or ions. Except for thermal desorption, which was only used in a few studies in the early stage of TLC-MS coupling, the other desorption methods can also be used to perform ionization of the desorbed molecules in situ. In the applications adopting these methods on a piece of TLC plate (i.e. a small area cut from an entire TLC plate), ionization can actually also be realized by energy. Then ionisation takes place nearly at the same time as the desorption. However, it is not suitable for a plate scanning system, in which the transfer of desorbed molecules or ions from the surface of the TLC plate to the ion source have to be carried out since the ion source of a mass spectrometer is not big enough to contain a whole TLC plate. Unfortunately, the transfer of ions is more complicated than the transfer of molecules, which require major modifications to the mass spectrometer and decrease the applicability of such a device. Accordingly, an ideal sampling method should only desorb molecules for more convenient transport, and the ionisation should happen in the ion source of mass spectrometry. Obviously, this involves the decoupling of the desorption and ionization step.
The transport part is necessary for scanning an intact TLC plate. In an extraction based system, this part is relatively simply because analytes are contained in liquid. Such a transport part normally means a tube connecting the sampling probe to the ion source of the mass spectrometer.
In an energy desorption based system, if not to modify the mass spectrometer, analytes are transferred with a gas flow. Before the appearance of atmospheric pressure ionization (API) techniques, the desorbed materials were transferred under vacuum or reduced pressure.
This results in the requirement of pumping time for the correct pressure
and more manufactural work for a sealing system. The API techniques
allow a simpler design and more flexible installation of transport part.
1. Introduction
—————————————————————————————————
—————————————————————————————————
However, transport under atmospheric pressure also causes more sample losses. Partially, these losses can be decreased by heating the transport lines.
The ionization method critically decides the performance of a TLC/MS interface. As a matter of fact, all popular ionization methods for mass spectrometry have been employed in TLC/MS, which will be discussed in detail in the next chapter. An API method has the advantage to be a ‘soft’
ionization technique with fewer fragments, simpler sample manipulation and, in our case, easier instrumental design and experimental arrangement.
The most popular API techniques include ESI, atmospheric pressure chemical ionization (APCI) and AP-matrix-assisted laser desorption /ionization. These techniques are chosen for a certain application in dependence on the analytes or the purpose of the investigation. The combination of laser desorption and APCI was recently developed, in which the desorption by laser and ionization by APCI were well decoupled. This combination can be easily incorporated into TLC/MS system. Such a system benefits from the high spatial resolution of the laser, simple transfer of analyte molecules, compatibility with modern mass spectrometric systems and less fragmentation under atmospheric pressure. One drawback of such a system is that the cost for a traditional pulsed laser system is relatively high, which somehow counteracts the advantage of TLC in the low costs. The size of the laser system is also not ideal for a miniaturization of the whole analytical system.
Accordingly, another choice of the laser system was done here: the
application of diode lasers. Diode lasers are reliable, compact, costs
effective, easy to use and have a high efficiency. It can be anticipated that
they play a more important role in the future. For the purpose of
desorption, a continuous wave (cw) diode laser can continuously desorb
molecules with the correct power and therefore keep desorption process
1. Introduction
—————————————————————————————————
—————————————————————————————————
uninterrupted. However, diode lasers have never been used for laser desorption in the past. To introduce diode lasers into this scope, a graphite substrate was applied here to improve the absorption efficiency of laser irradiance. In doing so, the necessary power density for laser desorption decreased by two orders of magnitude. As a consequence, graphite- assisted diode laser induced desorption/atmospheric pressure chemical ionization can successfully be used for a TLC/MS interface system with plate scanning.
The experimental work of this thesis starts with studies on graphite plate
targets for the testing of the feasibility of the method and basic
optimization. Then, the studies on TLC pieces cut from the entire plates
with graphite suspension covered are carried out to investigate the real
situation with the appearance of TLC material. Subsequently, a plate
scanning system is built up based on the results of above studies. Finally, a
quantification method is developed for this system.
2. Theoretical Background
—————————————————————————————————
2. Theoretical Background
2.1 Basic techniques involved in this work
This work is focused on the establishment of a combination between a chromatography technique and mass spectrometry, and cw diode lasers are employed for laser desorption for the first time. To give a general impression on the basic techniques involved, they are introduced as follows.
2.1.1 Diode laser
Since 1962, the first diode laser was reported by Nathan et al,
1many types of diode lasers emitting in the near-infrared or far-red region have been developed. Recently, green and blue diode lasers become commercially available. Diode lasers are widely used in bar-code readers, compact disks and laser printers.
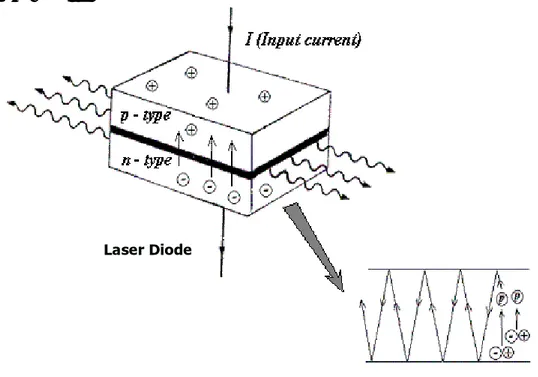
Figure 2-1. Mechanism of LED emitting
Laser Diode
2. Theoretical Background
—————————————————————————————————
In a diode laser the lasing medium is a semiconductor p-n junction similar to that found in a light emitting diode (LED). As shown in Fig. 2-1, when a diode is forward biased, holes from the p-region are injected into the n-region, and electrons from the n-region are injected into the p-region.
If electrons and holes are present in the same region, they may radiatively recombine—that is, the electron "falls into" the hole and emits a photon with the energy of the band gap. This is called spontaneous emission.
Under suitable conditions, the electron and the hole may coexist in the same area for quite some time (on the order of microseconds) before they recombine. If a photon of exactly the right frequency appears within this time period, recombination may be stimulated by the photon. This causes another photon of the same frequency to be emitted, with exactly the same direction, polarization and phase as the first photon. In a laser diode, the semiconductor crystal is shaped somewhat like a sheet of paper—very thin in one direction and rectangular in the other two. The top of the crystal is n-doped, and the bottom is p-doped, resulting in a large, flat p-n junction.
The two ends of the crystal are cleaved so as to form perfectly smooth, parallel edges; two reflective parallel edges are called a Fabry-Perot cavity. Photons emitted in precisely the right direction will be reflected several times from each end face before they are emitted. Each time they pass through the cavity, the light is amplified by stimulated emission.
Hence, if there is more amplification than loss, the diode begins to
"lase".
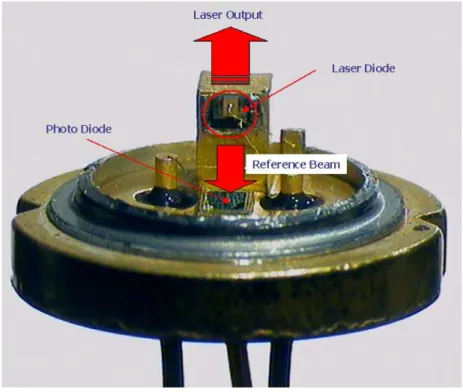
2,3Fig. 2-2 shows a picture of a diode laser. It was taken by a camera
mounted onto a microscope. The laser diode (circled part) was mounted on
a copper stage, which is helpful for heat elimination. The size of the laser
diode is about 0.8 x 0.8 mm
2. As introduced above, the laser beams exit
the diode in two dimensions, in this picture, upward and downward. The
upward laser beam is the laser output, and the downward laser beam,
2. Theoretical Background
—————————————————————————————————
called ‘reference beam’ is monitored by a photo diode, so that the power output of a diode laser is accurately tuneable.
Figure 2-2. Pictures of a real diode laser
Due to reliability, compactness, tunability, long lifetime, and easy
operation and maintenance, diode lasers have been used successfully in
analytical spectroscopy, such as molecular absorption spectroscopy,
fluorescence spectroscopy, atomic absorption spectroscopy and
optogalvanic spectroscopy.
4-8However, diode lasers have never been
applied in the laser desorption technique until now. Generally, diode lasers
can be distinguished into two categories: single-mode and multimode.
4Single mode diode lasers are mostly employed in atomic absorption
spectroscopy. Compared with hollow cathode lamps, which are the classic
light sources in atomic absorption spectroscopy, single-mode diode lasers
have the advantages of higher light intensity, narrower linewidth, more
2. Theoretical Background
—————————————————————————————————
stable output power, and smaller dimension. However, they only have output powers of up to 150 mW, which are not suitable for our application.
Accordingly, all diode lasers used in this work are multimode diode lasers.
Today, there are multimode diode lasers with powers up to 50 W commercially available. This power is sufficient for laser desorption.
2.1.2 Atmospheric pressure chemical ionization mass spectrometry (APCI/MS)
The first reported use of chemical ionization at atmospheric pressure coupled to mass spectrometry is the work by Shahin.
9,10He used a discharge chamber with a platinum wire as anode to study ion-molecule reactions. The group of Horning developed an atmospheric pressure ionization source, in which a radioactive
63Ni foil is used to initiate gas- phase ionization.
11Later, when they coupled liquid chromatography (LC) to mass spectrometry, the use of a corona discharge needle was introduced.
12-15APCI is an ionization technique for mass spectrometry (MS) that uses gas-phase ion-molecule reactions at atmospheric pressure. The method is analogous to chemical ionization (CI), which is normally used in gas chromatography/mass spectrometry (GC/MS). The APCI technique is mainly applied to polar and ionic compounds with moderate molecular weight and generally gives monocharged ions. It is usually coupled with liquid chromatography, especially high-performance liquid chromatography (HPLC), and has become a popular ionization source for mass spectrometry in these years.
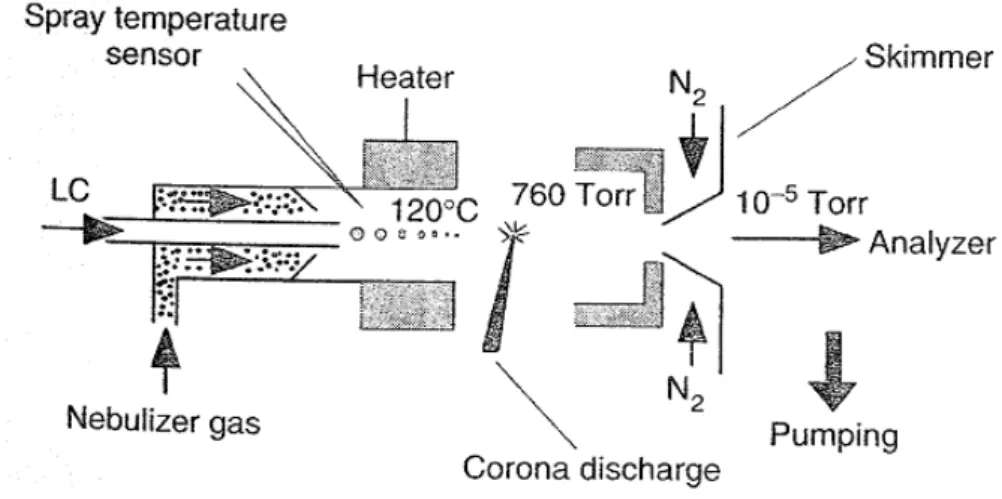
16,17The schematic diagram of an APCI source is shown in Fig. 2-3.
18,19The
analyte in solution from a direct inlet probe or a liquid chromatography
eluate is introduced directly into a pneumatic nebulizer where it is
converted into a thin fog by a high-speed nitrogen beam. The droplets are
2. Theoretical Background
—————————————————————————————————
then transported by the gas flow through a heated quartz tube called a desolvation/vaporization chamber. The heat transferred to the spray droplets allows vaporization of the mobile phase and of the sample in the gas flow. The temperature of this chamber is controlled, which makes the vaporization conditions independent of the flow and from the nature of the mobile phase. After desolvation, the solvent and analyte molecules are carried along a corona discharge electrode where ionization occurs.
Figure 2-3. Schematic diagram of an APCI source
18The ionization processes in APCI are equivalent to the processes that
take place in CI but all of these occur under atmospheric pressure. In the
positive ion mode, either proton transfer or addition of reactant gas ion can
occur to produce the ions of molecular species, depending on the relative
proton affinities of the reactant ions and the gaseous analyte molecules. In
the negative mode, the ions of the molecular species are produced either
by proton abstraction or adduct formation. Typically, the corona discharge
is formed by electron ionization primary ions such as N
•+or O
2•+. Then,
these ions collide with vaporized solvent molecules to form secondary
2. Theoretical Background
—————————————————————————————————
reactant gas ions. As shown below, it is a typical proton transfer process.
Here, M is the analyte, and H
3O
+plays the role of the reactant gas ion.
N
2•++ 2N
2→ N
4•++ N
2N
4•++ H
2O → H
2O
•++ 2N
2H
2O
•++ H
2O → H
3O
++ OH
•H
3O
++ M → [M + H]
++ H
2O
Because the ionization of the substrate occurs at atmospheric pressure and thus with a high collision frequency, it is very efficient. Furthermore, the moderate desolvation and vaporization of the droplets considerably reduce the thermal decomposition of the analyte. The result is that the ionization step yields predominantly ions of molecular species with few fragments. In comparison to other ionization techniques working under vacuum, APCI can be regarded as a ‘soft’ ionization technique.
2.1.3 Thin-layer chromatography (TLC)
Thin-layer chromatography is a type of chromatography in which the stationary phase is a thin layer of an adsorbent, e.g. silica gel, coated on a rectangular plate and the mobile phase is typically a solvent mixture. For analytical purposes, samples are applied in the form of spots at a point near one edge of a plate. In preparative work, the samples are streaked, often by means of a special device (applicator, streaker) on a line parallel to that edge. The chromatograms are developed in a closed vessel (chamber) by allowing the edge of the plate to dip into the mobile phase, which then advances past the sample to a paralleled line (solvent front) near the opposite edge. The detection is carried out after the TLC plate is dried in order to remove the residues of the solvents from the sorbent.
Since most substances resolved by TLC are colorless, visualization step is
used to find the position of the analyte, such as staining techniques,
2. Theoretical Background
—————————————————————————————————
ultraviolet (UV) absorption and fluorescence extinction. Automated and more convenient detection is based on UV/visible (VIS) absorption or fluorescence imaging allowing the quantification of the analytes.
Normally, TLC detection methods are nondestructive and permit further analysis of the separated substances.
20-22The attractive features of TLC include parallel sample processing for high sample throughput; accessibility of the sample for post- chromatographic evaluation free of time constraints; detection in the presence of the stationary phase independent of mobile phase properties;
and the stationary phase is normally used only once. As an economic and handy chromatographic separation technique, TLC has been extensively used for many years not only because of the modest demands on instrumentation, but also due to its sensitivity, general applicability, and its flexibility.
23-25It is generally agreed that TLC is most effective for the low-cost analysis of samples requiring minimal sample clean-up, and it is also preferred for the analysis of substances with poor detection characteristics requiring post-chromatographic treatment for detection.
Since all sample components are located in the chromatogram, TLC is the most suitable technique for surveying sample properties.
2.2 TLC-MS
The major inherent drawback to the usual detection techniques of TLC is
the inability to identify the analytes and have a low specificity with
partially overlapping substances. Recently, mass spectrometry has become
the method of choice for identification of compounds in conjunction with
TLC techniques, which was first realized by Kaiser.
26In his work, a small
H
2-O
2flame was used to desorb samples directly from a silica plate, and
then desorbed materials were simultaneously swept into a mass
spectrometer by Helium.
2. Theoretical Background
—————————————————————————————————
In the last few decades, a series of attempts have been made to couple TLC and MS.
23,24,26,27There are two approaches to remove the analyte molecules from the TLC plate. One possibility is to extract the analytes with a solvent either directly from the TLC plate or after removing a part of the stationary phase that contains the separated analyte. Typically, the extraction step is then followed by gas chromatography /mass spectrometry (GC/MS) analysis. Unfortunately, this extraction method can destroy the chromatographic integrity and it is also quite time consuming.
The other basic technique is the desorption of analytes with energy, such as secondary ion mass spectrometry (SIMS), fast atom bombardment (FAB) or laser desorption/ionization and some related techniques. These techniques need fewer experimental steps, however, due to an intrinsic coupling of desorption and ionization of the analytes they do have high requirements for the instrumentation.
2.2.1 Electron impact (EI) and Chemical ionization (CI)
EI is the classical ionization technique in mass spectrometry, in which a
gaseous sample is bombarded by electrons usually generated from a
tungsten filament.
28,29Because the pressure inside the ion source is kept
low, the technique induces extensive fragmentation. Ion-molecule
reactions do not occur, e.g. a [M+H]
+signal due to proton transfer is not
observed. The application of EI is restricted to the thermally stable
samples with low molecular masses.
18Because EI is a popular ionization
method for GC/MS, the coupling is generally performed by using a GC
mass spectrometer system. There are two methods to introduce analytes
into the EI ion source after removing the stationary phase containing the
analyte. In the first method, the analyte is extracted with a solvent, and
then the solvent is injected as a liquid phase. This method is technically
undemanding and efficient, but involves extraction and concentration
2. Theoretical Background
—————————————————————————————————
steps, which is usually time-consuming.
30,31In another method, the TLC piece is put on a heating probe. The analyte absorbed in the stationary phase is thermally evaporated and injected in its gaseous phase. The method has less experimental steps but is restrictedly for polar or involatile compounds on silica gel plates because of the strong absorption of such analytes to silica.
32One solution for the problem is the use of less absorbing stationary phase, such as polyamide TLC plates.
33-35The basic principle of CI is similar to that of APCI, but ion-molecule reactions happen in much lower pressure (about 10
-3Pa).
36Compared with EI, it yields less fragmentation and often gives information about the molecular weight of the analyty.
18CI is not widely used in combination with TLC, but very often used in GC/MS. A prominent work about TLC- CI/MS was performed by Ramaley et al.
37,38A remarkable advance in this work was that they developed a device for plate scanning, in which a chamber containing a TLC plate was put on a stepping motor to provide motion. The analyte on the TLC plate was desorbed with a quartz-halogen projection lamp or a CO
2laser. The desorbed molecules were swept by a CI regent gas to the ion source of the mass spectrometer after passing through a heated glass tube.
2.2.2 Secondary ion, fast atom bombardment and liquid secondary ion mass spectrometry (SIMS, FABMS and LSIMS)
SIMS analyzes the secondary ions emitted when a surface is irradiated with an energetic primary ion beam, such as
2He
+,
16O
+, or
40Ar
+.
39,40FABMS
41and LSIMS
42are techniques that consist of focusing a high- energy primary current beam of neutral atom/molecules or ions on the sample, respectively. Essential features of these two techniques are the use of a non-volatile liquid matrix, e.g. glycerol, which is not used in SIMS.
The purpose of the matrix is to induce ionization and refresh the surface.
2. Theoretical Background
—————————————————————————————————
Compared with EI, these ionization techniques are ‘soft’ and produce only few fragments. They are more appropriate for polar or thermally unstable substances than EI.
18The use of TLC in combination with these ionization techniques was realized for a whole range of analytes, including drugs and their metabolites, pesticides, natural products, synthetic chemicals and dyes.
26Because these ionization techniques can be applied on solid surfaces directly, the approach of extraction with solvent is not necessary. The normal procedure of the combinations includes the removal of the stationary phase with substrate; condensation with a solvent, such as methanol, for analytes with small amount or in a diffuse spot, which is applied around the sample spot; application of matrix (for FABMS and LSIMS); and subsequent mass spectroscopic analysis.
43-45Suzuki et al.
developed an improved condensation technique, in which the area including the desired spot was cut, and a trapezoidal shape was scribed, out of which the stationary phase was scratched. A small amount of methanol was deposited on the lower base of the trapezoid, which causes the migration of the analyte to the upper base by penetration of methanol.
Finally, the analyte was concentrated in a line of 0.5-1 mm.
46Nakagawa et al. designed a simple device allowing a stripe of the TLC plate to be scanned by a LSIMS source.
47It supplies the information of chromatography, but has just a few modifications of the ion source at the same time.
2.2.3 Electrospray ionization (ESI)
ESI is another popular ionization method for mass spectrometry, suitable
for large bio-molecules or synthetic polymers. Like APCI, it also works
under atmospheric pressure and enables LC/MS coupling. An ESI source
consists of a very fine needle and a series of skimmers. A high potential is
2. Theoretical Background
—————————————————————————————————
applied to the needle. The sample solution is sprayed into the source chamber to form droplets. The droplets carry charges when they exit the capillary. After the solvent is vaporized, the droplets disappear and leave highly charged analyte molecules.
48,49In contrast to APCI, ESI normally produces multiply charged ions, which allows the analysis of high molecular weight molecules using analysers with a lower nominal mass limit. However, the sample must be soluble in low boiling solvents and stable at very low concentrations, i.e. 10
-2mol/l. Very often HPLC methods have to be modified for ESI when they use high concentrations of buffers.
18The first work about TLC-ESI coupling was the development of a micro solvent extraction device.
50The device composes of an inner capillary with a sheath of absorbent material that is contained by a metal tube. A suitable solvent is transferred through the capillary to the area containing analyte on the TLC plate, diffuses a short distance, and then drawn up by capillary action into the absorbent material. The analyte is subsequently eluted from the sorbent for ESI-MS analysis. Luftmann presented another device based on a similar principle, but without absorbent material.
Furthermore, the solvent was injected continuously, which enable direct
coupling with an ESI mass spectrometer to perform ‘on-line’ analysis.
51Berkel, et al. built a computer-controlled movable probing system that
allows ‘on-line scanning’ of the whole TLC plate and, as a result, the
investigation of unknown mixtures.
52Apart from the ‘extraction
/transmission’ mode mentioned above, another approach that realizes
electrospray ionization directly on the edge of the plate was developed.
53Here, the electrospray process happens at one sharp end of a TLC strip,
which is connected to a power supply.
2. Theoretical Background
—————————————————————————————————
2.2.4 Laser desorption/ionization (LD/I), matrix-assisted laser desorption/
ionization (MALDI) and surface-assisted laser desorption/ionization (SALDI)
In a laser desorption/ionization process, laser pulses desorb material from
the surface and create a microplasma of ions and neutral molecules, which
may react among themselves in the dense vapor phase near the sample
surface. The laser pulse realizes both the vaporization and ionization of the
sample.
18Because of the small sampling area of the laser, the introduction
of laser systems to TLC gives the advantage of a higher spatial resolution,
and also the possibility of repeatable analysis due to the unchanged bulk
material. However, laser desorption/ionization always produces
fragmentation products, especially when a UV laser is applied.
54A partial
solution of the problem is the use of an infrared (IR) laser for desorption
followed by multi-photon ionization (MPI).
55The LD/I process depends
critically on the specific physical proprieties of the surface. Therefore,
more laser power is required to desorb analytes from a TLC plate
compared with desorption from a metal plate (sample-substrate affinity).
56Recently, MALDI is widely used in the analysis of large biological
molecules such as proteins or DNA fragments.
57Differing from other LD/I
techniques, MALDI involves the use of a matrix. The analyte molecules
are dispersed in a solid matrix crystal so that they are isolated from each
other. The rapid heating by the laser beam causes localized sublimation of
the matrix crystals together with analyte molecules. It is the matrix that
absorbs the most energy so that little internal energy is transferred to the
analyte molecules.
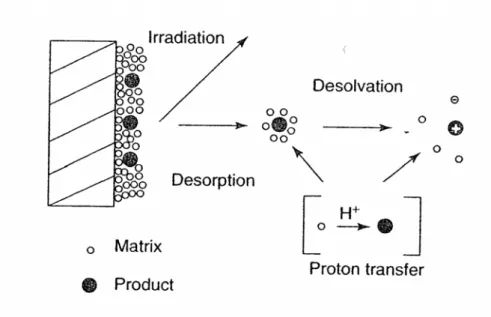
58,59However, the ionization process in MALDI is still
not fully understood,
60and the most widely accepted ion formation
mechanism involves gas-phase proton transfer in the expanding plume
with photoionized matrix molecules, as shown in Fig. 2-4. MALDI is a
soft ionization technique and allows the determination of the molecular
weight of molecules up to 500 kDa. Moreover, the MALDI process is
2. Theoretical Background
—————————————————————————————————
independent of the absorption properties and size of the analyte so that it is not necessary to adjust the laser wavelength to match the analyte.
18Figure 2-4. Diagram of the principle of MALDI
18This technique was also introduced to TLC recently.
61However, one
problem, compared with normal MALDI on a metal substrate, is that the
analyte molecules must be ‘extracted’ to the surface of the plate from the
bulk of the TLC material before they enter the matrix crystal. For this
purpose, an ‘extraction’ solvent is applied on the sample spot after
separation. Then, matrix is added to the extraction solvent gradually after
the extraction step is finished, and at last forms a structure as normal
MALDI.
62-64However, the lateral diffusion of separated compounds is
inevitable in this method due to the ‘extraction’ solvent. Therefore, a
protocol was developed to solve the problem. A matrix layer is prepared
on a stainless steel plate first, and then the layer is transferred onto the
developed TLC plate prewetted with the ‘extraction’ solvent. With a
gentle pressure, the analyte is incorporated into the matrix structure, and
then the stainless steel is discarded, followed by laser
2. Theoretical Background
—————————————————————————————————
desorption/ionization.
65,66More recently, a hybrid plate with a silica gel layer and an adjacent MALDI layer on a normal backing was developed to obtain nearly 100 % analyte recovery.
67In this method, after analytes are developed in the silica gel layer, the plate is rotated 90°, and the separated compounds are eluted to the MALDI layer, followed by normal MALDI analysis.
Another similar method, named surface-assisted laser desorption /ionization (SALDI) was developed lately.
68,69Instead of using a matrix, particle suspensions are employed on the plate surface to couple the laser energy resulting in a thermal induced desorption/ionization process.
Activated carbon or graphite particles are normally used in the technique, and the latter with a diameter of 2 µm shows the best capability for signal yield.
70SALDI can also be performed with a pencil drawing on a TLC plate.
69The extracting step is not necessary in the method, and it opens the possibility to choose lasers with different wavelength because particle suspensions have an almost wavelength independent absorption ability.
712.2.5 Plate scanning device
Most methods to couple TLC with MS are based on the ‘scrape and elute’
mode, but an interface for TLC plate scanning is attractive for TLC-MS. A
plate-scanner coupled with a mass spectrometer gives the chance to
reconstruct the chromatogram based on either single ion monitoring or the
total ion current. If the plate is scanned along the lane in which the sample
is developed, the detection can be carried out without the information of
migrating distances for all the analytes. It is possible to detect component
of unknown samples and overlapping spots. Moreover, the coloration step
is not necessary in this mode. Furthermore, the scan can be also carried out
orthogonally to the direction of development and on the level
corresponding to a special substance. Since many samples are developed
2. Theoretical Background
—————————————————————————————————
parallelly on a TLC plate, the ‘screening’ of the substance in samples can be carried out with a high-throughput.
For any scanner, the TLC plate can be moved linearly past the source of desorption or extraction, or the source can be moved linearly along the plate. The former is a simpler method and has the fewest disadvantages.
Furthermore, the ionization of desorbed or extracted sample molecules also can happen before or after transfer, i.e. transporting ions or molecules.
The first solution is cumbersome, requiring major modifications to the spectrometer but provides better spectra. The other solution is simpler, and its setup can be coupled with a wide variety of mass spectrometers, but it includes the danger of samples loss or breakdown during transfer.
Because there were no AP ionization methods for mass spectrometry several years ago, the transfer of desorbed materials was complicated. It was necessary to maintain vacuum in the transferring tube and the chamber in which the plate was placed. Furthermore, there was a pumping time necessary for each analysis after the plate was placed inside the chamber and before the mass spectrometer was started. Ramaley et al.
built up such a device that was briefly described in the chapter 2.2.1.
37,38Another scanner was designed based on liquid secondary ionization,
47by which a stripe of TLC plate can be scanned. Because desorption and ionization happen simultaneously in liquid secondary ionization, ions are transferred rather than molecules, which is different from the case in Ramaley’ work. As a result, the ion source had to be modified.
Besides the fact that API techniques are softer than vacuum ionization techniques, API techniques give also the benefit of easier sample handling.
With API techniques, TLC plates can be placed on a movable stage directly without a sealed chamber and additional waiting time for vacuum.
Disadvantage is the possible loss of sample molecules during transfer. A
scanner based on ESI was developed recently, in which analytes were
2. Theoretical Background
—————————————————————————————————
extracted and transported with a solvent.
52In this case, the sample recovery can be improved by choosing the suitable solvent and decreasing scan speed.
In all the experimental setups described above, the sample molecules
were removed from the TLC material by thermal or laser desorption,
bombardment with ions or extraction with solvent. Among them, laser
desorption have the advantage of a smaller sampling area, which results in
a higher spatial resolution. If the laser beam is conducted by an optical
fibre, the experimental arrangement is even more flexible. However, in the
techniques adopting traditional pulsed lasers, desorption and ionization are
not decoupled, and both happen ‘in situ’ on the TLC plate. In this case,
ions rather than molecules have to be transported. Moreover, the output of
a traditional pulsed laser is usually unstable from pulse to pulse. It
possibly varies from a power density high enough for ionization or even
fragmentation of sample molecules to a level not enough for desorption
without changing any working parameters. The decoupling of desorption
and ionization is therefore quite difficult for pulsed lasers. These
disadvantages can be eliminated by using a cw diode laser. A cw diode
laser has very stable and accurately tuneable power output. In combination
with the adequate irradiation time, the energy density can be accurately set
to desorb molecules without ionization and less fragmentation.
3. Diode laser induced desorption in combination with APCI/MS on graphite substrate
—————————————————————————————————
3. Diode laser induced desorption in combination with APCI/MS on graphite substrate
Diode lasers are reliable, compact, costs effective, easy to use and have high efficiency. According to inherent advantages of a diode laser, it can be anticipated that they will be extensively used in routine analytical tasks in the future.
Compared with pulsed lasers, cw diode lasers have very stable and accurately tuneable power outputs, which is an important preconditions for experimental studies of laser desorption/ionization. However, diode lasers have never played any role in this scope until now. Most diode lasers emit in the near-infrared range, and few materials resonantly absorb in this range. The power output of a cw diode laser is also not capable to induce ionization. Accordingly, if wanting a diode laser is going to be used for laser desorption/ionization, more power from the laser beam should be coupled to the surface and the desorption and ionization steps should be decoupled.
A graphite surface can work well as a photon absorbing material. Kim et al applied MALDI to a graphite target that works as an energy transfer mediator for visible light.
72This group showed that the graphite surface also works well for a near-infrared laser beam. A desorption of biochemical molecules with moderate molecular weight deposited on a graphite plate can be realized with a power density in the order of 10
4W/cm
2, which is 100 times lower than the power density which is needed to desorb from a white surface.
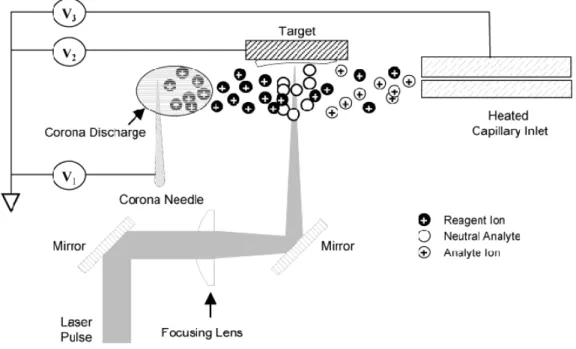
18The decoupling of desorption and ionization was realized by LD-APCI
technique, which was recently presented by Coon et al.
73-76As shown in
Fig. 3-1, a corona needle was positioned above the target to ionize the
desorbed molecules rather than normal AP-MALDI process. In this work,
3. Diode laser induced desorption in combination with APCI/MS on graphite substrate
—————————————————————————————————
the signal intensities were enhanced by 2 to 3 orders of magnitude for different analytes when compared with measurements without corona discharge, which means that the desorption and ionization steps were decoupled.
Based on above theories, a study to evaluate the applicability of desorption from a graphite surface by a continuous wave diode laser is presented here.
Figure 3-1. Schematic representation of LD-APCI source
733.1 Chemicals and sample preparation
The first evaluation was accomplished with reserpine (from Sigma), a
calmative and antihypertensive drug. It is often used for the calibration of
the LC-MS system and is accordingly suitable to give a well-defined
signal (for structure, see Fig. 3-2).
3. Diode laser induced desorption in combination with APCI/MS on graphite substrate
—————————————————————————————————
Figure 3-2. Structure of reserpine
Figure 3-3a Structure of sphingomyelin
Figure 3-3b Structure of lecithin
Sphigomyelin (SPM, from bovine brain) and Lecithin (L-α-
phosphatidylcholine, PC, from fresh egg yolk) were also employed as
analytes (both from Sigma). They are the most abundant phospholipids
inside living bodies. Sphingomyelin is a group of phosphosphingolipids
made by transferring choline from lecithin to a ceramide, which make up a
3. Diode laser induced desorption in combination with APCI/MS on graphite substrate
—————————————————————————————————
significant portion of the membrane lipids of the myelin sheath of nerve tissue. Lecithin is a group of glycerophospholipids that are involved in the metabolism of several lipid compounds. Determination of the lecithin/sphingomyelin ratio in the amniotic fluid is a viable method of monitoring and assessing fetal lung maturity. This is particularly important in high-risk pregnancies, for which early confinement is to be expected.
They both are a group of phospholipids that have similar structures but different masses based on the length of respective carbon chain and the amounts of unsaturated carbon bonds, as shown in Fig. 3-3a, b.
Other chemicals used in this study include methanol (from Merck, Germany), acetic acid (from Merck, Germany), chloroform (99.8 %, from Aldrich), n-Hexane (for GC, from Merck, Germany), isopropanol (for GC, from Merck, Germany) and ethanol (99.8 %, for chromatography, from Merck, Germany). No further treatment or purification was performed for the materials.
The reserpine solutions were prepared by dissolving reserpine in an aqueous solution of 50 % methanol with 0.1 % acetic acid. The sphingomyelin and the lecithin solutions were prepared by dissolving their powders in a mixture of chloroform/methanol/n-hexane (13:18:69) and ethanol/n-hexane (70:30), respectively.
3.2 Design of ion source and experimental setup
Fig. 3-4 shows a picture and its sketch of the ion source used for the
following experiments. A stainless steel target with a diameter of 4 mm
was mounted on a xy-stage (DS40-xy, Newport, USA). The distance of the
target to the front of the heated capillary inlet (transfer capillary) of a LCQ
Classic ion trap mass spectrometer (ThermoFinnigan, USA) and the
position in reference to the axis could be changed by the xy-stage. A
potential of 1.5 kV was applied to the target by an additional power supply
3. Diode laser induced desorption in combination with APCI/MS on graphite substrate
—————————————————————————————————
in order to improve the ion transmission efficiency. The corona needle was positioned on the axis of the transfer capillary and above the rear edge (in reference to the capillary inlet) of the target. The needle could also be moved along the axis, therefore allowing an adjustment of the needle-to- plate distance for optimal APCI conditions. The standard APCI power supply of the LCQ system was connected to the needle to generate the corona discharge. A diode laser (GBL981000G from Roithner Lasertechnik) with a wavelength of 985 nm and a maximum power output of 1 W was used to desorb the analyte molecules. For all experiments the laser beam was focused on the surface with a calculated spot diameter of approximately 0.1 mm, resulting in a maximum power density in the order of 10
4W/cm
2.
Figure 3-4. Ion source
3. Diode laser induced desorption in combination with APCI/MS on graphite substrate
—————————————————————————————————
The parameters of the mass spectrometer were optimized according to the analytes, individually. For reserpine, the capillary voltage was set to 6 V, the tube lens voltage offset was set to 57 V; for sphigomyelin and lecithin, they are 41.5 V and 43 V, respectively. The capillary temperature was maintained at 150 °C in all cases. The ion injection was set to AGC (Automatic Gain Control) mode, because the synchronization between laser and mass spectrometer is not necessary due to the use of a continuous wave diode laser system.
3.3 Optimization of experimental conditions
The first step of the following experiments was to find the best position of
the corona discharge in reference to the entrance of the transfer capillary in
order to realize ionization of desorbed molecules and an efficient
transportation by the electric field. A short distance between the target and
the inlet of the mass spectrometer is helpful to improve the transmission
efficiency. However, if the target is too close to the capillary inlet, electric
arc will appear in between. A distance of 3 mm from the front edge of the
target to the inlet was evaluated as the optimized parameter at last whereas
the target was 3 mm underneath the axis of the transfer capillary. This
ensured the cloud from desorbed materials formed on the axis. It was
found that the target can influence the corona discharge if it is too close to
the axis of the electric field. The tip of the corona needle was positioned
on axis and above the rear edge of the target, 1-2 mm offset from the spot
of the laser beam, which ensured that the electric field contained the whole
region of the desorbed molecules in gas phase. It has to be noted that when
the corona needle is moved above the front part of the target, only a very
weak sample signal can be measured, and when the position is beyond the
front edge, no signal can be obtained. Such a geometry layout assures that
a well-build electric field is set to form the steady ion current to carry
3. Diode laser induced desorption in combination with APCI/MS on graphite substrate
—————————————————————————————————
ionized sample molecules into the mass spectrometer. In other studies about LD-APCI,
73,74long distance among each part of the source (1.5 or 3 cm from heated capillary inlet to the tip of corona needle) was applied and for efficient ionization in such a distance, a high discharge voltage (5.3 or 8.1 kV) was utilized. In our case, a compact source layout was employed to improve the transmission efficiency, and the discharge voltage was dropped to around 3 kV, which results in a current of 0.5 µA. Higher discharge currents were also used, but no obvious enhancement of the signal intensity could be observed, and the risk of a plasma breakthrough between corona needle and target is high. A potential of 1.5 kV on the target was found to enhance desorption and also improve ion transmission efficiency.
3.4 Analysis of a compound with moderate molecular weight
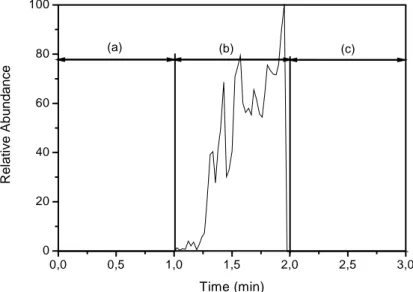
Figure 3-5. Total ion counts obtained with (a) only corona discharge on (b) both corona discharge and laser on (c) only laser on.
0,0 0,5 1,0 1,5 2,0 2,5 3,0
0 20 40 60 80 100
Relative Abundance
Time (min)
(a) (b) (c)
3. Diode laser induced desorption in combination with APCI/MS on graphite substrate
—————————————————————————————————
A reserpine solution of 2 µl (0.6 µg reserpine) was deposited on a piece of graphite plate that was placed on the metal target. The 1 W diode laser with maximal power output was used to desorb sample molecules after the sample solution was dried for 5 min at room temperature. The total ion counts in the m/z range from 150 to 700 were measured by the mass spectrometer.
As shown in Fig. 3-5, no signal of reserpine was measured when only the corona discharge was in operation (a), obviously due to the fact that reserpine was not evaporated from the surface of the graphite plate. After about 1 min, also the diode laser was switched on (b), and an intensive signal appeared. Finally, after about 2 minutes, the corona discharge was switched off (c) and the signal intensity decreased immediately to zero.
Therefore, analyte ions can only be measured when both the laser and the corona discharge are in operation. It is obvious that the increase of the signal initiated by laser irradiation was less slow than the decrease caused by stopping the corona discharge. The slow increase of the signal might be explained by the time of the heat transfer. The instantaneous decrease is due to the fact that the ionization process is stopped and no more ions enter the mass spectrometer.
In the case when only the laser was on (c), it is obvious to assume that the power from the diode laser was not high enough for ionization.
However, even if a few sample molecules are ionized, the absence of an electric field in the entrance region of the mass spectrometer resulting from the corona discharge reduces the transmission efficiency of ions.
Therefore these ions cannot be detected. In order to clarify this, the voltage of the corona discharge was decreased to the extent that the corona discharge expired, but attendant ions could still be transported into the capillary inlet. Nevertheless, there was still no measurable signal.
Therefore, desorption and ionization are well decoupled in this technique.
3. Diode laser induced desorption in combination with APCI/MS on graphite substrate
—————————————————————————————————
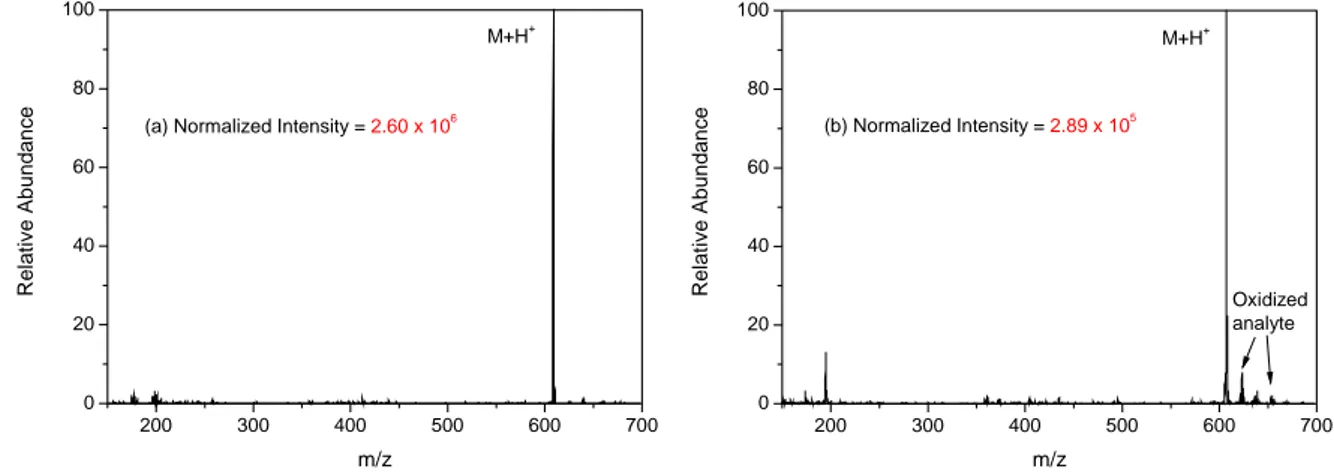
Fig. 3-6a shows the spectrum from one single scan, which gives an intensive molecular peak with a low background and no fragments. After decreasing the concentration of the analyte by a factor of 10 (60 ng, i.e.
100 pmol), the molecular ion of reserpine was still observed as the base peak with intensity about 10 times lower. However, the background in the low mass range was higher, and peaks from oxidized products ([M+H+16]
+, [M+H+32]
+, etc.) became more obvious. Fig. 3-6b shows the spectrum, which resulted from the average of 10 individual mass spectra.
Figure 3-6. Mass spectra of reserpine with sample amount of (a) 600 ng and (b) 60 ng.
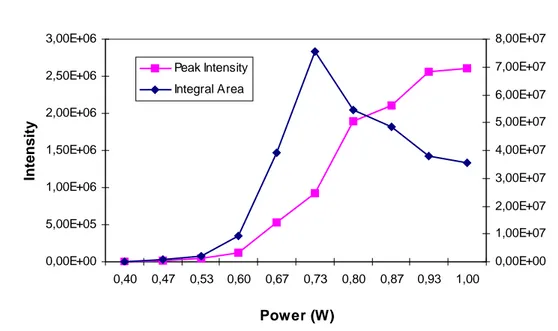
In the initial work, the maximum output, i.e. 1 W was used, which worked well to desorb molecules. Subsequently, the laser power was decreased step by step to investigate the influence on the signal. As shown in Fig. 3-7and Table 3-1, analyte signals can be obtained if laser power was higher than 0.40 W, which corresponds to a power density of 5 x 10
3W/cm
2. Below that, no stable analyte signals were obtained. The peak intensity decreased with the decrease of laser power, and signal duration increased accordingly. The integral area of analyte signal during the measurements increased with power when it was lower than 0.73 W, and
200 300 400 500 600 700
0 20 40 60 80 100
(a) Normalized Intensity = 2.60 x 10⁶
Relative Abundance
m/z
M+H+
200 300 400 500 600 700
0 20 40 60 80 100
(b) Normalized Intensity = 2.89 x 10⁵
Oxidized analyte
Relative Abundance
m/z
M+H+
3. Diode laser induced desorption in combination with APCI/MS on graphite substrate
—————————————————————————————————
decreased while the laser power was higher. Therefore, 0.73 W is an optimized power for some experiments in which the exhaustion of sample is necessary.
Table 3-1. Influence on sample signals by changing laser output
Power (W) 0.40 0.47 0.53 0.60 0.67 0.73 0.80 0.87 0.93 1.00 Peak Intensity 7.47x10³ 1.66x10⁴ 4.78x10⁴ 1.27x10⁵ 5.28x10⁵ 9.27x10⁵ 1.90x10⁶ 2.10x10⁶ 2.56x10⁶ 2.60x10⁶ Integral Area 2.44x10⁴ 1.01x10⁶ 2.00x10⁶ 9.21x10⁶ 3.91x10⁷ 7.54x10⁷ 5.45x10⁷ 4.87x10⁷ 3.79x10⁷ 3.56x10⁷ Signal Time (min) 9.41 14.82 7.06 5.26 4.76 4.46 3.09 2.38 1.93 1.41
Figure 3-7. Peak intensity and integral peak area as a function of the laser output power
3.5 Analysis of complex samples
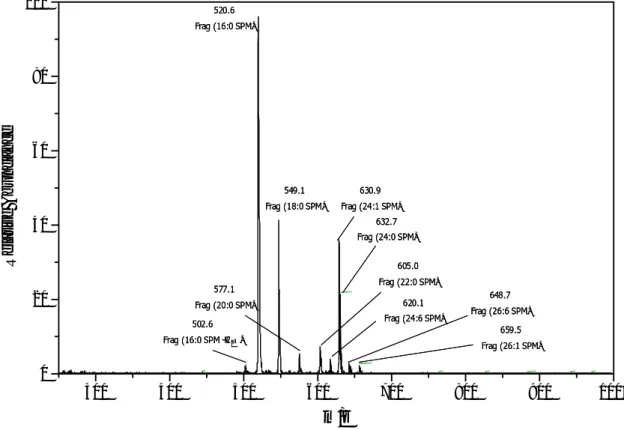
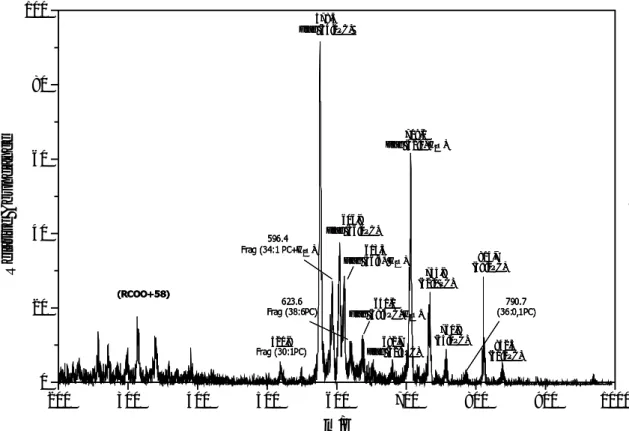
Further experiments on graphite plate were carried out with two phospholipids — sphingomyelin and lecithin. Both are mixtures of a group of compounds with similar structures, and their spectra are more complicated than that of reserpine. In this study, 1 µl sample solutions of sphingomyelin and lecithin (each containing 100 ng analyte) were used.
The spectra are shown in Fig. 3-8, 3-9. In the spectra, the expression, such
0,00E+00 5,00E+05 1,00E+06 1,50E+06 2,00E+06 2,50E+06 3,00E+06
0,40 0,47 0,53 0,60 0,67 0,73 0,80 0,87 0,93 1,00
Power (W)
Intensity
0,00E+00 1,00E+07 2,00E+07 3,00E+07 4,00E+07 5,00E+07 6,00E+07 7,00E+07 8,00E+07 Peak Intensity
Integral Area