Overwintering effects on the spring bloom dynamics of phytoplankton
1
2
Xiaoqi Fang1 & Ulrich Sommer1,2
3
1- Helmholtz Centre for Ocean Research (GEOMAR), Düsternbrooker Weg 20, 24105 Kiel,
4
Germany
5
2- Corresponding editor: Ulrich Sommer. E-mail: usommer@geomar.de
6 7 8 9
Key words: phytoplankton – overwintering – spring bloom – dark survival
10 11
Running head: Phytoplankton overwintering
12
Abstract
13
The influence of winter on the selection of dominant taxa for the phytoplankton spring bloom
14
was studied in batch culture experiments. Different natural phytoplankton assemblages from
15
different phases of the temperate zone winter were exposed to varying periods of darkness (0, 6/7,
16
13, and 19 weeks) followed by a re-exposure to saturating light intensity for 14 days to
17
experimentally simulate the onset of spring. The results showed that dark incubation plays a strong
18
effect on shaping the phytoplankton community composition. Many taxa disappeared in the
19
absolute darkness. Dark survival ability might be an important contributing factor for the success of
20
diatoms in spring. Different phytoplankton starting assemblages were dominated by the same
21
bloom-forming diatoms, Skeletonema marinoi and Thalassosira spp., after dark incubation for only
22
6 weeks, irrespective of the high dissimilarities between phytoplankton communities. The growth
23
capacity of surviving phytoplankton is almost unimpaired by darkness. Similar growth rates as that
24
before darkness could be resumed for the surviving taxa with a potential lag time of 1-7 days
25
dependent on taxon and the duration of darkness.
26
Introduction
27
The spring bloom is a renowned feature of the seasonal phytoplankton dynamics in temperate
28
and cold oceans and lakes. Three decades ago, Sommer et al. (1986) proposed the plankton ecology
29
group (PEG) model as a standard template to describe the seasonal succession of plankton in
30
common patterns of sequential steps. After that, additional types of interactions driving details in
31
taxonomic and functional group replacements during the growth season were detected by extensive
32
studies (summarized in Sommer et al., 2012b). Nevertheless, relatively little work has been carried
33
out on overwintering dynamic considering it occupies a long period of time in the overall
34
succession process in temperate and cold environments. The widespread lack of attention to the
35
overwintering period has also been noticed in the revised version of the PEG model (Sommer et al.,
36
2012b).
37
The overwintering period starts from late autumn when the abiotic environment deteriorates,
38
leading to a negative community net production and ends next early spring when a new bloom
39
begins. As the final step mentioned in the original PEG model, a start close to zero of both
40
phytoplankton and zooplankton was assumed during the winter-spring transition (Sommer et al.,
41
1986). However, considerable evidence for some winter growth of phytoplankton (Behrenfeld, 2010)
42
and for zooplankton overwintering(Campbell, 2008; Hagen et al., 1996) has emerged.
43
The most obvious characteristic of winter is the low light intensity. Light supply is considered
44
to be the single dominant trigger of the spring bloom in both old and updated PEG models (Sommer
45
et al., 2012b; Sommer et al., 1986). This idea is in agreement with the classical concept of critical
46
depth hypothesis (Sverdrup, 1953). The significance of light in bloom initiation was also confirmed
47
by Siegel et al. (2002) who found a notable uniform daily light dose of 1.3 mol photons m-2 d-1 at
48
the start of the spring bloom for the North Atlantic Ocean. Conversely, lack of light is also seen as
49
the primary explanatory factor for the winter minimum in the cold-temperate and boreal zone, while
50
there is no winter depression of phytoplankton in the more light-rich Mediterranean
51
(Moustaka-Gouni et al., 2014). Thus, different dark survival abilities and strategies between
52
different taxonomic groups in phytoplankton may provide a driving factor for the overwintering
53
dynamics.
54
Overwintering capabilities of the different phytoplankton taxa might be important for the
55
composition of the subsequent spring bloom because it determines the initial abundance of species
56
for the spring bloom. Long-term survival in darkness has been well studied with isolated
57
phytoplankton strains showing that several diatoms could survive for up to 1 year in the vegetative
58
stage (Antia, 1976), although with interpsecific differences (Antia, 1976; Griffis & Chapman, 1988;
59
Lewis et al., 1999; Peters, 1996; Peters & Thomas, 1996a; Smayda & Mitchell-Innes, 1974). Some
60
bloom-forming diatoms, like Skeletonema spp., Thalassiosira spp., and Ditylum brightwellii,
61
showed strong dark survival ability (Antia, 1976; Griffis & Chapman, 1988; Murphy & Cowles,
62
1997; Peters, 1996; Peters & Thomas, 1996a). Strains qualified as benthic types usually have longer
63
survival times than pelagic types and the temperature for maximal dark survival could be
64
determined by the temperature regions from which the strains were isolated (Antia, 1976).
65
Survival of winter darkness is necessary but may not be sufficient for the formation of the
66
spring bloom. Starting growth quickly after the improvement of light conditions and achieving
67
higher exponential growth rates are equally important. It has been shown that diatoms have a higher
68
inherent growth rate than flagellates in the absence of silicate limitation (Egge & Aksnes, 1992).
69
The question is whether this growth rate will be negatively affected by the physiological
70
consequences of prolonged survival in darkness or under low light. Most studies suggest that
71
darkness has no effect on growth rate even after a relatively long period of dark incubation time
72
(Araujo et al., 2008; Furusato et al., 2004; Murphy & Cowles, 1997; Peters, 1996; Peters & Thomas,
73
1996a; Peters & Thomas, 1996b; Vermaat & Sand-Jensen, 1987) indicating that species could
74
survive in the dark without physiological impairment. However, a decrease of growth rate with the
75
increase of dark incubation time was reported for several diatom species, such as Skeletonema
76
costatum, Chaetoceros curvisetus, and Thalassiosira gravida (Smayda & Mitchell-Innes, 1974).
77
Species do not always start exponential growth immediately when re-exposed to the light, but
78
often start after a lag phase. Although growth rate could be resumed at the initial level, the recovery
79
time would increase with the increasing dark incubation time (Peters, 1996; Peters & Thomas,
80
1996a; Peters & Thomas, 1996b). This might be caused by the gradual decrease of photosynthetic
81
pigments in response to darkness (Lüder, 2003). A lag phase of 1-7 days is common (Araujo et al.,
82
2008; Coughlan, 1977; Peters, 1996; Peters & Thomas, 1996b). It could be longer if the dark
83
incubation time is extended. In the prolonged darkness, it was reported that the lag time of
84
Thalassiosira antarctica increased from immediate growth to 13 days when dark incubation time
85
increased from 21 days to 127 days and the lag time of Thalassiosira tumida increased from 3 days
86
to 15 days when dark incubation time increased from 148 days to 272 days (Peters & Thomas,
87
1996a).
88
No doubt that these studies provide a valuable reference on the dark survival ability and
89
growth capacity of individual species after winter, the problem is these monoculture studies
90
excluding other species are insufficient to predict if diatoms would still be able to succeed under
91
competition, consumption or infection. Actually, there was one study conducted by Zhang et al.
92
(1998) who exposed natural phytoplankton assemblage samples collected from Arctic sea ice to a
93
6-month dark incubation and found that the dominant species shifted from pennate diatoms to small
94
flagellates after darkness, and flagellates had a higher growth rate than diatoms in the subsequent
95
light culture. These findings are opposite to our expectation derived from the monoculture dark
96
survival experiments.
97
Therefore, we proposed to fill the knowledge gap by exposing different natural phytoplankton
98
assemblages from different phases of the temperate zone winter immediately and after dark
99
incubation to saturating light intensity to experimentally simulate the onset of the spring bloom at
100
the community level. By analysing the changes in taxon abundance, growth rate and lag phase, we
101
expected to answer three questions:
102
1. How do different overwintering inocula respond to the darkness?
103
2. How do growth rates of individual taxa change after dark incubation?
104
3. How do lag phases of individual taxa change after varying time intervals of dark?
105 106
Method
107
Experimental design
108
Water samples of different natural phytoplankton assemblages were collected at 5m depth in
109
the early, middle and late winter from Kiel Fjord, Baltic Sea, Germany (54°19'46"N 10°09'18"E).
110
The three communities sampled at different times in winter were called W1, W2, and W3,
111
respectively. In situ, environmental conditions during sampling of the three communities were
112
relatively similar to each other (Table 1). Initial nutrient concentrations were high in all the
113
communities but were slightly lower in the late winter water. Therefore, extra nutrients of 8.42
114
µmol L-1 silicate (Si), 0.47 µmol L-1 phosphate (P), and 7.89 µmol L-1 nitrate (N) were added in W3
115
to balance the decline. After filtration by a 250μm mesh to avoid grazing from large zooplankton,
116
water samples were distributed into 2L plastic bottles. Four of the bottles were immediately
117
incubated in light (0 weeks dark incubation = control) while the remaining ones were incubated in
118
darkness for different periods before exposing to light. The dark incubations lasted for 0, 6, 13, and
119
19 weeks (W1), 0, 7, and 13 weeks (W2), or 0 and 6 weeks (W3). Each treatment was replicated 4
120
times. Light incubations following darkness lasted for 14d. Light was offered at a saturating level
121
(100 μmol photons m-2 s-1; Light/dark cycle= 12:12h). Light and dark incubation temperatures were
122
4°C. During culturing, bottles were gently shaken every day to assure a homogenous distribution of
123
the plankton and to avoid the growth of benthic microalgae on the wall of bottles. Phytoplankton
124
subsamples (100 mL) were collected three times per week (Monday, Wednesday, and Friday).
125
Subsamples which were counted by inverted microscope were fixed with alkaline Lugol’s solution
126
and stored in brown glass bottles. Subsamples for flow cytometric analysis were fixed with 37%
127
formaldehyde, frozen immediately by liquid nitrogen and then stored at -80°C to protect
128
chlorophyll from decomposing.
129
Phytoplankton >5μm were counted by the inverted microscope method after sedimentation for
130
at least 24 h (Utermöhl, 1958). Phytoplankton were identified to the genus level in most cases. The
131
aim was to count 100 individuals per taxon group in order to obtain 95% confidence limits of ±20%,
132
except for rare taxa. For log transformations half of the detection limit was used as zero
133
replacement value, if a taxon was undetectable only at a few sampling occasions. Phytoplankton
134
biomass was estimated as carbon biomass converted from cell volumes (Menden-Deuer & Lessard,
135
2000) which were measured through the calculation of similar geometric standard solids
136
(Hillebrand et al., 1999). Small phytoplankton (<5μm) were counted by a flow cytometer
137
(FACScalibur, Becton Dickinson, San Jose, CA, USA) and distinguished by size and fluorescence
138
of allophycocyanin, chlorophyll a and phycoerythrin without further taxonomic identification. All
139
picoplankton cells detected by flow cytometer were assumed to be spherical and estimated by the
140
volume conversion factor of 0.157 pg C μm-3 (Sommer et al., 2012c).
141
Data analysis
142
The analysis of the microbial plankton communities focused on phytoplankton and excluded
143
bacteria, heterotrophic flagellates, ciliates, and benthic microalgae. Phytoplankton were categorized
144
into five functional groups by size classification (Sieburth et al., 1978) and the distinction between
145
diatoms and flagellates: picoplankton (<3μm), nanodiatoms (3-20μm), nanoflagellates (3-20μm),
146
dinoflagellates (>20μm), and microdiatoms (>20μm). The dissimilarities between different
147
phytoplankton communities were analysed by SIMPER test (Clarke, 1993) using PRIMER 7, based
148
on the Bray-Curtis dissimilarity coefficient (Bray & Curtis, 1957). Community indexes were
149
calculated without inclusion of picoplankton because of the different level of taxonomic resolution.
150
The Shannon-Wiener index of diversity (H’) was calculated from genus abundance data:
151
H′ = − ∑𝑠𝑖=1𝑝𝑖 𝑙𝑜𝑔2 𝑝𝑖 (1)
152
where pi is the relative abundance of taxon i, s is the number of taxa.
153
Growth rate and lag time were taken as the main indicators of growth capacity. The growth rate
154
was calculated as the slope of a linear regression fitted through a semi-logarithmic plot of
155
abundance on time (log N – time) during the exponential phase, i.e. the linear portion of the growth
156
curve. Lag time was calculated by the intercept between the fitted regression line and the baseline
157
which was the abundance of taxa at the beginning. Negative values of lag time implying that no lag
158
phase was found were adjusted to zero. If the growth curve did not show the typical batch culture
159
pattern (lag phase, exponential phase, stationary phase), an average growth rate (µgrowth) from day 0
160
to 14 was calculated instead. Differences between metrics of growth capacity (i.e., growth rate and
161
lag time) were evaluated for statistical significance using analysis of variance. One-way ANOVA
162
was conducted to analyse the impact of dark incubation on growth rate and lag phase. Two-way
163
ANOVA was used to examine the combined effect of dark incubation and community. Normality
164
was checked by Shapiro-Wilk test and homogeneity of variance was checked by Fligner-Killeen test.
165
If the assumptions of normality and homogeneity could not be satisfied even after transformations,
166
an alternative non-parametric test was used instead (i.e. Welch’s t-test).
167 168
Results
169
Phytoplankton community
170
The initial phytoplankton community compositions differed strongly between different
171
sampling periods, but were uniform between replicates of the same community (Table 2). The
172
dissimilarities of initial composition were 77% between W1 and W2, 54% between W1 and W3,
173
and 77% between W2 and W3. The total biomass ranged from 18 to 22 µg C L-1 in W1 and W3 but
174
was lower in W2 with only 6 µg C L-1. In W1, initial phytoplankton biomass was dominated by
175
microdiatoms (75.5±4.2%, SD). W2 was dominated by nanoflagellates (63.8±18.9%). W3 was
176
dominated by microdiatoms (53.8±5.1%) followed by picoplankton (19.9±3.5%) and
177
nanoflagellates (19.3±5.8%). Dinoflagellates together with nanodiatoms formed less than 10% of
178
the total biomass in each community. In all communities, picoplankton were represented by the
179
same two clusters distinguished by differences in fluorescence of phycoerythrin and chlorophyll a.
180
The abundances of heterotrophic plankton are listed in Table 3 as a reference. Nauplii and copepods
181
were discovered in W2 and W3 but not in W1, while, microzooplankton (ciliates and heterotrophic
182
flagellates) were more abundant in W1 than in W2 and W3.
183
Dark survival capability
184
Most of the phytoplankton taxa did not survive 6 weeks of dark incubation in the natural
185
assemblage communities. The diversity of communities decreased dramatically during that time.
186
The diversity index (H’) decreased from 1.46 to 0.38, 0.92 to 0.25, and 2.31 to 0.81 for W1, W2,
187
and W3, respectively. The richness of detectable surviving taxa was also low, with 8 taxa in W1, 4
188
taxa in W2, and 5 taxa in W3. Among the surviving phytoplankton, some taxa were unable to
189
resume measurable cell division after re-illumination, few other taxa could grow again (Table 4).
190
Several heterotrophic zooplankton could also survive in the dark, such as Protoperidinium,
191
Gyrodinium, Strobilidium, and copepods. No resting spores or cysts were observed during the dark
192
incubation experiment. Picoplankton became undetectable during dark incubation but re-appearance
193
of both clusters after re-illumination suggests that they had not disappeared. The abundance ratio
194
between heterotrophs and phytoplankton increased from less than 0.01 before dark incubation in all
195
communities to about 0.02 in W1 and W3 and to even more than 1.0 in W2 after darkness.
196
Taxa that survived the first 6 weeks of dark incubation normally persisted during prolonged
197
darkness although the abundance gradually decreased as the dark incubation time increased. The
198
survivorship patterns varied among different taxa in W1 (Fig. 1). Skeletonema displayed the typical
199
type I survivorship curve (p<0.001), whereas Thalassiosira with a steady mortality rate followed
200
the type II survivorship curve (p<0.001). For both taxa, only about 5% of the initial biomass of each
201
taxon survived after 19 weeks of darkness. All other phytoplankton, which had much lower
202
abundance after dark incubation and were calculated together as “all other species”, showed the
203
type III survivorship curve (p<0.001). The surviving “all other species” formed only about 1% of
204
their initial biomass after 19 weeks of darkness.
205
Pseudo-nitzschia from W1 and W3 communities behaved differently from each other.
206
Pseudo-nitzschia from W1 experienced a catastrophic population decline already after 6 weeks in
207
the darkness with no ability to grow after re-illumination, while, the Pseudo-nitzschia from W3 not
208
only exhibited a much higher survival rate but could also regrow in the subsequent growth
209
experiment. A morphological analysis based on the density of striae showed that these were two
210
different types presented in the two communities (W1: 17 striae in 10 μm; W3: 23 striae in 10 μm;
211
assessed with empty frustules under phase contrast). Contrary to Pseudo-nitzschia, the dark survival
212
abilities of other phytoplankton taxa showed only minor change between the different experimental
213
communities.
214
Growth after dark incubation
215
Skeletonema marinoi and Thalassiosira were the winners in the light culture after varying
216
periods of dark incubations, comprising more than 98%, 94%, and 85% of the total biomass at the
217
end of culture in W1, W2, and W3, respectively. However, the three phytoplankton communities
218
showed clearly different compositions in the light culture without prior dark incubation. W1 was
219
dominated by a S. marinoi alone which contributed more than 80% to the total biomass after 14-day
220
light incubation, while, W2 and W3 were co-dominated by several taxa. Specifically, W2 was
221
dominated by the diatoms Proboscia alata (19±3%), Skeletonema marinoi (15±7%), Chaetoceros
222
(24±6%), Coscinodiscus (20±12%), and the cryptophyte Teleaulax (10±13%) equally. W3 was
223
dominated by Thalassiosira (48±20%) followed by Skeletonema marinoi (26±19%) and
224
Pseudo-nitzschia (12±3%).
225
Only few taxa could resume growth after dark incubation (Table 4). Growth rates (Fig. 2;
226
Supplementary Document 1) could be calculated for Skeletonema marinoi and Thalassiosira in all
227
the communities and the sum of “all other species” for W1 and W3, while for W3 growth rates
228
could also be calculated for Pseudo-nitzschia. The growth rates of picoplankton and Attheya
229
septentrionalis could not be calculated.
230
No significant changes of growth rates were discovered after dark incubation by the analysis
231
with three different taxa. Skeletonema and Thalassiosira maintained consistent growth rates in W1
232
and W2 during 19 and 13 weeks dark incubation. Growth rates of the three taxa analysed in W3
233
decreased, but not significantly. In all the experiments, Skeletonema and Thalassiosira showed
234
similar growth rates ranging from 0.50 to 0.88 day-1 which was higher than that of Pseudo-nitzschia
235
with 0.36 day-1. The growth rate of “all other species” was even lower which ranged from 0.08 to
236
0.27 day-1 even before dark incubation. There were almost no biomass increases of “all other
237
species” in the cultures after darkness, except for W3 (Fig. 2; Supplementary Document 1).
238
A two-factor ANOVA showed no significant effect of the duration of darkness on the growth
239
rates of Skeletonema and Thalassiosira, while there was a significant effect of community of origin
240
and (Skeletonema: F2,18=8.8, P<0.01; Thalassiosira: F2,18=34.5, P<0.001) and a significant
241
interaction effect of darkness and community (Skeletonema: F2,18=8.0, P<0.01; Thalassiosira.:
242
F2,18=5.7, P<0.05). To balance the design of experimental duration, the two-way ANOVA only
243
included dark incubation times of 0 and 6 weeks.
244
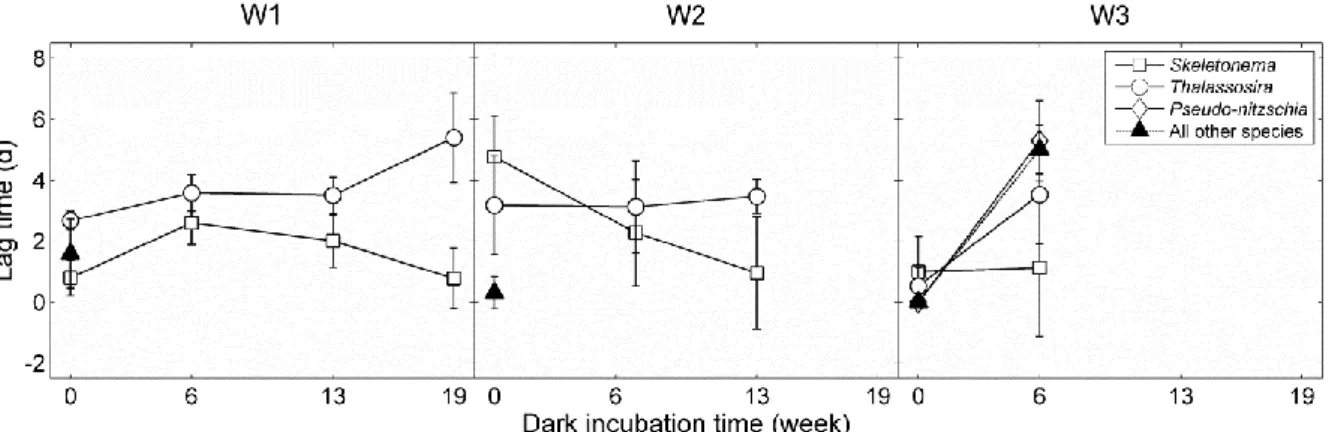
The responses of lag time to the duration of dark incubation varied among taxa. Skeletonema
245
was not negatively influenced by darkness and maintained a similar lag time after 19 weeks dark
246
incubation and the lag time of Skeletonema in W2 even decreased after darkness (F1,10=11.58,
247
P<0.01). In contrast, Thalassiosira, from both W1 and W3, displayed a significant increase in lag
248
time of 2-3 days (W1: F1,14=15.12, P<0.01; W3: F1,6=12.01, P<0.05). Pseudo-nitzschia from W3
249
showed the longest lag time of 5 days after 6 weeks incubation (Welch’s test: p<0.01). The
250
following two-way ANOVA tests with Skeletonema and Thalassiosira confirmed that the lag times
251
of Thalassiosira were significantly influenced by darkness (F1,18=7.1, P<0.05), while the lag time of
252
Skeletonema was significantly affected by the factor community and its interaction with darkness
253
(F2,18=4.6, P<0.05).The lag time of the three taxa and “all other species” from different
254
communities were only minor (if at all detectable) and ranged from 1-7 days in the culture before
255
and after dark incubation.
256 257
Discussion
258
Our experiments focused on the two most important traits which enable phytoplankton to
259
dominate the spring bloom in cold-temperate and boreal latitudes, survival of an extended low-light
260
period and the ability to resume growth thereafter. The dark incubations indicated a strong selection
261
pressure by the combination of lack of an essential growth resource (light) and continued losses to
262
heterotrophic consumers. All phytoplankton taxa under study substantially lost biomass and the
263
majority became undetectable leading to low diversity of the surviving communities. Only few
264
diatoms and mixotrophic flagellates together with taxonomically unidentified picoplankton formed
265
the residual biomass after dark incubation. The comparison between the three experimental
266
communities shows a unifying effect of dark incubation on phytoplankton community composition.
267
Irrespective of the initial composition, the three different communities were dominated by the same
268
bloom-forming diatoms, Skeletonema and Thalassiosira, when cultured in the light again.
269
Interspecific differences in growth rate after re-illumination reinforced the survival effect because
270
Skeletonema and Thalassiosira outperformed the rest of the taxa.
271
According to the long-term observations in the Kiel Bight, three diatom genera, Skeletonema,
272
Thalassiosira, and Chaetoceros, are the most important components in the spring phytoplankton
273
biomass (Smetacek, 1985; Wasmund et al., 2008; Wasmund et al., 1998). Unlike the other two
274
diatoms, Chaetoceros is more likely to become dominant when there is a later spring bloom
275
(Smetacek, 1985; Wasmund et al., 2008). Considering this difference, the mechanism promoting the
276
dominance of Chaetoceros might be slightly different from the other two genera. Photographs taken
277
during the course of the experiment suggest that most of the Chaetoceros in our samples were C.
278
decipiens.
279
The successful survival of diatoms is in agreement with dark survival studies of individual
280
species (Antia, 1976; Griffis & Chapman, 1988; Murphy & Cowles, 1997; Peters, 1996; Peters &
281
Thomas, 1996a). Similarly, the ability of diatoms to start growth after darkness either immediately
282
or after a short delay (<1 week) has been demonstrated by several single species culture studies
283
(Araujo et al., 2008; Furusato et al., 2004; Murphy & Cowles, 1997; Peters, 1996; Peters & Thomas,
284
1996a; Peters & Thomas, 1996b; Vermaat & Sand-Jensen, 1987). However, one study conducted
285
with a natural phytoplankton assemblages resulted in the dominance of flagellates after dark
286
incubation (Zhang et al., 1998). A possible explanation for the important difference between both
287
studies lies in the fact that Zhang et al. (1998) obtained their experimental community from melting
288
ice which means phytoplankton had been frozen before the study. Freezing has been shown to
289
strongly influence survival and growth ability of microalgae (Vermaat & Sand-Jensen, 1987), but
290
possibly with different taxon specific effects than darkness.
291
While the temperature conditions and nutrient concentrations of our study are representative of
292
present-day conditions in the Baltic Sea, further climate warming might change survival and
293
re-growth capabilities of overwintering phytoplankton. Reeves et al. (2011) suggested that
294
increasing temperature during Antarctic winter will have little effect on diatoms since the dark
295
survival of Antarctic diatoms is temperature insensitive, only significantly impacted at an unrealistic
296
temperature of 10°C. However, increasing food demand of heterotrophs and mixotrophic flagellates
297
is likely to increase mortality rates of phytoplankton in darkness as indicated by the continued
298
decrease in abundance of surviving taxa during 19 weeks of darkness.
299
Compared to natural conditions, the darkness incubation was an extreme treatment, because
300
winter phytoplankton experience low light, but not complete darkness, except for the polar night
301
and of ice covered water bodies with a thick layer of snow. This difference might explain why some
302
of the taxa unable to survive darkness were found in the mid- and late winter field samples, e.g. the
303
diatom Proboscia alata and the cryptophyte Teleaulax.
304
The incubation in 2 L bottles might have caused some artifacts, e.g. the reduction of loss rates
305
relative to in situ conditions due to sinking or to grazers present in situ at abundances of less than a
306
1 Ind L-1. However, these losses are considered low: (1) sedimentary losses play a negligible role
307
during the high turbulence regime of an ice-free winter, (2) except for excluding mesozooplankton
308
by sieving with 250 µm mesh size, grazer densities at the start of the experiment conformed to the
309
natural situation. The decline of abundance during dark incubation affected all autotrophic,
310
mixotrophic and heterotrophic protists, therefore competitive, allelopathic and predatory
311
interactions will have declined, but this is a community wide effect of darkness (with indirect
312
ramifications through biotic interactions) which was within the target of a study at the community
313
level and not an artifact. The tendency of increasing heterotroph to autotroph ratios during darkness
314
might have led to increasing grazing losses affecting mostly picoplankton, while diatoms are less
315
likely to be grazed by the microzooplankton. Similarly, increases of microzooplankton because of
316
the removal of copepods will have mainly affected picoplankton. The absence of sediment in the
317
bottles might have excluded resting stages and discriminated against taxa relying on resting stages
318
for overwintering.
319
The observed lag-phases were short (less than 1 week) and confirm the ability of
320
phytoplankton to quickly resume growth when light availability reaches a sufficient level. Increases
321
in lag as a consequence of increasingly long dark incubation were found in some cases, but not in
322
all cases (Fig. 3; Supplementary Document 1). The increase in lag time by dark incubation was also
323
found with monospecific cultures (Peters, 1996; Peters & Thomas, 1996a; Peters & Thomas,
324
1996b). However, the duration of the lag phase after darkness is only a minor effect on the timing of
325
the spring bloom compared to the one-month delay that could be caused by the low light (Sommer
326
et al., 2012a). Therefore, changes in lag time introduced by variability in exposure to darkness does
327
not explain the time shift of the spring bloom from April to March in Kiel Bight at the beginning of
328
21st century (Wasmund et al., 2008). Future research should focus, inter alia, on the effect of
329
warming, which is expected to increase respiration rates both of auto- and heterotrophs while
330
seasonal light availability will not increase during the period before the onset of thermal
331
stratification. However, an earlier onset of stratification will not only improve light supply to
332
phytoplankton (Sverdrup, 1963), it will also lead to an earlier onset of nutrient limitation, as
333
opposed to the nutrient-replete conditions in our experiment.
334 335
Conclusions
336
Darkness in winter is a very unfavorable environment for phytoplankton and many taxa cannot
337
survive in the absolute dark for few weeks in the natural assemblage community. However, despite
338
its strong impact on the survival of phytoplankton, the growth capacity of surviving phytoplankton
339
is almost unimpaired. Surviving taxa could still resume a similar growth rate as that before darkness
340
with a potential lag phase of only a few days. Dark survival ability might be the contributing factor
341
for the success of diatoms in the spring bloom and seems the most plausible explanation for the
342
annually repeating pattern of the phytoplankton spring bloom. Three different communities were
343
dominated by the same bloom-forming diatoms in the culture after dark incubation.
344 345
Acknowledgements
346
Stefanie Ismar is gratefully acknowledged for the advice on statistical analysis and comments on the
347
manuscript. Thanks go to Thomas Hansen and Bente Gardeler for the technical assistance and the
348
help in the organization of experiment. Thanks to Christian Hesse for the help during field sampling
349
and Evangelia Charalampous for the introduction of phytoplankton counting method.
350 351
Funding
352
This work was supported by the core funding group of the second author’s research unit
353
(Experimental Ecology – Food Webs) at GEOMAR Helmholtz Centre for Ocean Research Kiel.
354 355
Data Archiving
356
Upon acceptance of the manuscript, data will be made publicly available in PANGAEA
357
(www.pangaea.de)
358
References
359
Antia, N. J. (1976) Effects of temperature on the darkness survival of marine microplanktonic algae.
360
Microb. Ecol., 3, 41-54.
361
Araujo, C. V., Diz, F. R., Moreno-Garrido, I., Lubian, L. M. and Blasco, J. (2008) Effects of
362
cold-dark storage on growth of Cylindrotheca closterium and its sensitivity to copper.
363
Chemosphere, 72, 1366-72.
364
Behrenfeld, M. J. (2010) Abandoning Sverdrup's critical depth hypothesis on phytoplankton blooms.
365
Ecology, 91, 977-989.
366
Bray, J. R. and Curtis, J. T. (1957) An ordination of the upland forest communities of southern
367
Wisconsin. Ecol. Monogr., 27, 325-349.
368
Campbell, R. W. (2008) Overwintering habitat of Calanus finmarchicus in the North Atlantic
369
inferred from autonomous profiling floats. Deep Sea Res., Part I, 55, 630-645.
370
Clarke, K. R. (1993) Non-parametric multivariate analyses of changes in community structure. Aust.
371
J. Ecol., 18, 117-143.
372
Coughlan, S. (1977) The effect of organic substrates on the growth, photosynthesis and dark
373
survival of marine algae. Br. phycol. J., 12, 155-162.
374
Egge, J. K. and Aksnes, D. L. (1992) Silicate as regulating nutrient in phytoplankton competition.
375
Mar. Ecol. Prog. Ser., 83, 281-289.
376
Furusato, E., Asaeda, T. and Manatunge, J. (2004) Tolerance for prolonged darkness of three
377
phytoplankton species, Microcystis aeruginosa (Cyanophyceae), Scenedesmus quadricauda
378
(Chlorophyceae), and Melosira ambigua (Bacillariophyceae). Hydrobiologia, 527, 153-162.
379
Griffis, K. and Chapman, D. J. (1988) Survival of phytoplankton under prolonged darkness:
380
implications for the Cretaceous-Tertiary boundary darkness hypothesis. Palaeogeogr.,
381
Palaeoclimatol., Palaeoecol., 67, 305-314.
382
Hagen, W., Van Vleet, E. and Kattner, G. (1996) Seasonal lipid storage as overwintering strategy of
383
Antarctic krill. Mar. Ecol. Prog. Ser., 134, 85-89.
384
Hillebrand, H., Dürselen, C. D., Kirschtel, D., Pollingher, U. and Zohary, T. (1999) Biovolume
385
calculation for pelagic and benthic microalgae. J. Phycol., 35, 403-424.
386
Lewis, J., Harris, A., Jones, K. and Edmonds, R. (1999) Long-term survival of marine planktonic
387
diatoms and dinoflagellates in stored sediment samples. J. Plankton Res., 21, 343-354.
388
Lüder, U. (2003) Acclimation of the photosynthetic apparatus of the endemic Antarctic red
389
macroalga Palmaria decipiens to seasonally changing light conditions. Ber. Polarforsch.
390
Meeresforsch., 469, 141.
391
Menden-Deuer, S. and Lessard, E. J. (2000) Carbon to volume relationships for dinoflagellates,
392
diatoms, and other protist plankton. Limnol. Oceanogr., 45, 569-579.
393
Moustaka-Gouni, M., Michaloudi, E. and Sommer, U. (2014) Modifying the PEG model for
394
Mediterranean lakes - no biological winter and strong fish predation. Freshwater Biol., 59,
395
1136-1144.
396
Murphy, A. M. and Cowles, T. J. (1997) Effects of darkness on multi‐ excitation in vivo
397
fluorescence and survival in a marine diatom. Limnol. Oceanogr., 42, 1444-1453.
398
Peters, E. (1996) Prolonged darkness and diatom mortality: II. Marine temperate species. J. Exp.
399
Mar. Biol. Ecol., 207, 43-58.
400
Peters, E. and Thomas, D. (1996a) Prolonged darkness and diatom mortality I: Marine Antarctic
401
species. J. Exp. Mar. Biol. Ecol., 207, 25-41.
402
Peters, E. and Thomas, D. (1996b) Prolonged nitrate exhaustion and diatom mortality: a comparison
403
of polar and temperate Thalassiosira species. J. Plankton Res., 18, 953-968.
404
Reeves, S., Mcminn, A. and Martin, A. (2011) The effect of prolonged darkness on the growth,
405
recovery and survival of Antarctic sea ice diatoms. Polar Biol., 34, 1019-1032.
406
Riley, G. A. (1957) Phytoplankton of the North Central Sargasso Sea. Limnol. Oceanogr., 2,
407
252-270.
408
Sieburth, J. M., Smetacek, V. and Lenz, J. (1978) Pelagic ecosystem structure: heterotrophic
409
compartments of the plankton and their relationship to plankton size fractions. Limnol.
410
Oceanogr., 23, 1256-1263.
411
Siegel, D. A., Doney, S. C. and Yoder, J. A. (2002) The North Atlantic spring phytoplankton bloom
412
and Sverdrup's critical depth hypothesis. Science, 296, 730-3.
413
Smayda, T. and Mitchell-Innes, B. (1974) Dark survival of autotrophic, planktonic marine diatoms.
414
Mar. Biol., 25, 195-202.
415
Smetacek, V. (1985) The annual cycle of Kiel Bight plankton: a long-term analysis. Estuaries, 8,
416
145-157.
417
Sommer, U., Aberle, N., Lengfellner, K. and Lewandowska, A. (2012a) The Baltic Sea spring
418
phytoplankton bloom in a changing climate: an experimental approach. Mar. Biol., 159,
419
2479-2490.
420
Sommer, U., Adrian, R., De Senerpont Domis, L., Elser, J. J., Gaedke, U., Ibelings, B., Jeppesen, E.,
421
Lürling, M., and et al. (2012b) Beyond the Plankton Ecology Group (PEG) model:
422
mechanisms driving plankton succession. Annu. Rev. Ecol. Evol. Syst., 43, 429-448.
423
Sommer, U., Gliwicz, Z. M., Lampert, W. and Duncan, A. (1986) The PEG-model of seasonal
424
succession of planktonic events in fresh waters. Arch. Hydrobiol., 106, 433-471.
425
Sommer, U., Lengfellner, K. and Lewandowska, A. (2012c) Experimental induction of a coastal
426
spring bloom early in the year by intermittent high-light episodes. Mar. Ecol. Prog. Ser., 446,
427
61-71.
428
Sverdrup, H. (1953) On conditions for the vernal blooming of phytoplankton. J. Cons. Int. Explor.
429
Mer, 18, 287-295.
430
Utermöhl, H. (1958) Zur vervollkommnung der quantitativen phytoplankton-methodik. Mitt. int. Ver.
431
theor. angew. Limnol., 9, 1-38.
432
Vermaat, J. E. and Sand-Jensen, K. (1987) Survival, metabolism and growth of Ulva lactuca under
433
winter conditions: a laboratory study of bottlenecks in the life cycle. Mar. Biol., 95, 55-61.
434
Wasmund, N., Göbel, J. and Bodungen, B. V. (2008) 100-years-changes in the phytoplankton
435
community of Kiel Bight (Baltic Sea). J. Mar. Syst., 73, 300-322.
436
Wasmund, N., Nausch, G. and Matthäus, W. (1998) Phytoplankton spring blooms in the southern
437
Baltic Sea—spatio-temporal development and long-term trends. J. Plankton Res., 20,
438
1099-1117.
439
Zhang, Q., Gradinger, R. and Spindler, M. (1998) Dark survival of marine microalgae in the high
440
Arctic (Greenland Sea). Polarforschung, 65, 111-116.
441 442
Tables
443 444
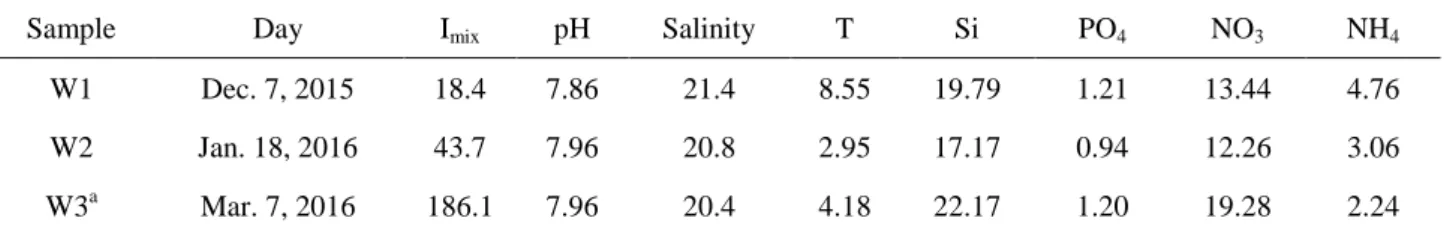
Table 1. Summary of the environmental conditions
445
Sample Day Imix pH Salinity T Si PO4 NO3 NH4
W1 Dec. 7, 2015 18.4 7.86 21.4 8.55 19.79 1.21 13.44 4.76
W2 Jan. 18, 2016 43.7 7.96 20.8 2.95 17.17 0.94 12.26 3.06
W3a Mar. 7, 2016 186.1 7.96 20.4 4.18 22.17 1.20 19.28 2.24
Imix is the 24 h mean of the integrated mixed water column (12m) irradiance, calculated from
446
surface irradiance according to Riley (1957), assuming an attenuation coefficient of 0.3 m-1 (µmol
447
photons PAR m-2 d-1), T is the temperature measured in situ (°C); dissolved nutrients are the
448
concentration in the bottles (µmol L-1)
449
a includes the extra nutrients
450 451
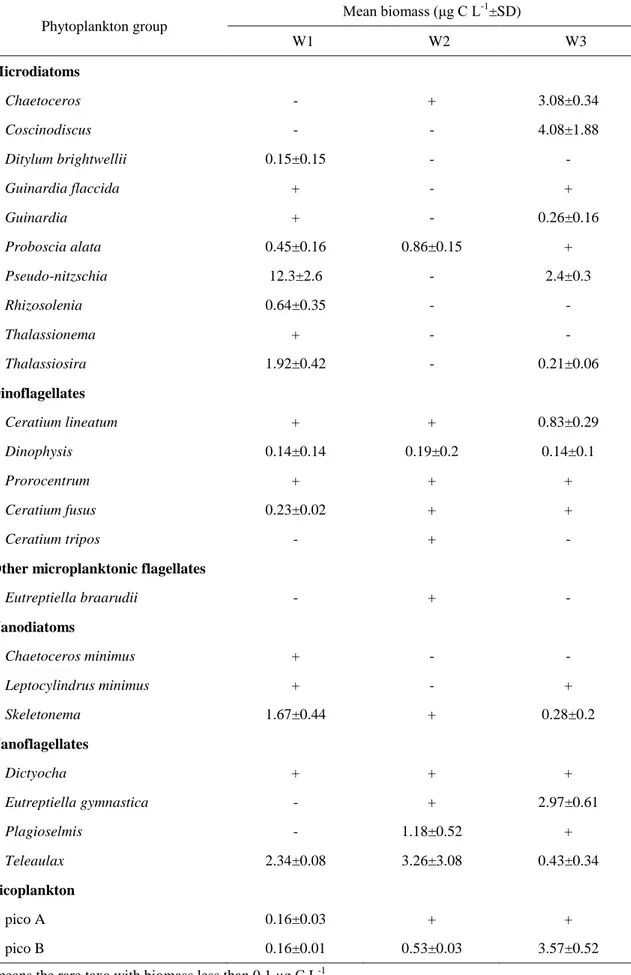
Table 2. The biomass of functional groups of phytoplankton before the culture
452
Phytoplankton group
Mean biomass (μg C L-1±SD)
W1 W2 W3
Microdiatoms
Chaetoceros - + 3.08±0.34
Coscinodiscus - - 4.08±1.88
Ditylum brightwellii 0.15±0.15 - -
Guinardia flaccida + - +
Guinardia + - 0.26±0.16
Proboscia alata 0.45±0.16 0.86±0.15 +
Pseudo-nitzschia 12.3±2.6 - 2.4±0.3
Rhizosolenia 0.64±0.35 - -
Thalassionema + - -
Thalassiosira 1.92±0.42 - 0.21±0.06
Dinoflagellates
Ceratium lineatum + + 0.83±0.29
Dinophysis 0.14±0.14 0.19±0.2 0.14±0.1
Prorocentrum + + +
Ceratium fusus 0.23±0.02 + +
Ceratium tripos - + -
Other microplanktonic flagellates
Eutreptiella braarudii - + -
Nanodiatoms
Chaetoceros minimus + - -
Leptocylindrus minimus + - +
Skeletonema 1.67±0.44 + 0.28±0.2
Nanoflagellates
Dictyocha + + +
Eutreptiella gymnastica - + 2.97±0.61
Plagioselmis - 1.18±0.52 +
Teleaulax 2.34±0.08 3.26±3.08 0.43±0.34
Picoplankton
pico A 0.16±0.03 + +
pico B 0.16±0.01 0.53±0.03 3.57±0.52
+ means the rare taxa with biomass less than 0.1 μg C L-1 453
- means the absence of taxa 454
Table 3. The abundance of heterotrophs before the culture
455
Heterotrophic group
Mean abundance (N L-1±SD)
W1 W2 W3
Ciliates 170±50 340±190 160±100
Gyrodinium 140±120 120±50 -
Protoperidinium 370±170 110±40 80±40
Katodinium 910±1230 - -
Protoperidinium bipes 480±560 440±620 -
Nauplii - 5±10 20±23
Copepods - - 40±32
- means the absence of taxa 456
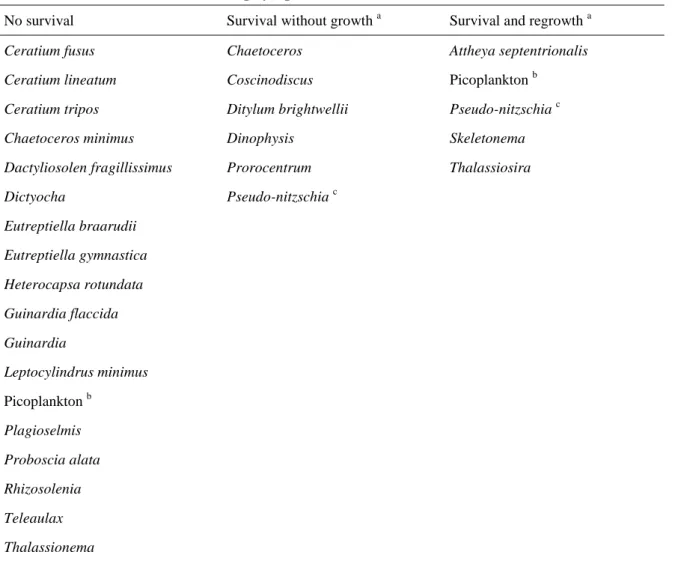
Table 4. The survival abilities of phytoplankton after dark incubation for 6 weeks
457
No survival Survival without growth a Survival and regrowth a Ceratium fusus
Ceratium lineatum Ceratium tripos Chaetoceros minimus Dactyliosolen fragillissimus Dictyocha
Eutreptiella braarudii Eutreptiella gymnastica Heterocapsa rotundata Guinardia flaccida Guinardia
Leptocylindrus minimus Picoplankton b
Plagioselmis Proboscia alata Rhizosolenia Teleaulax Thalassionema
Chaetoceros Coscinodiscus Ditylum brightwellii Dinophysis
Prorocentrum Pseudo-nitzschia c
Attheya septentrionalis Picoplankton b
Pseudo-nitzschia c Skeletonema Thalassiosira
a survival means the taxa showed relatively consistent presence in the subsequent light culture 458
b the picoplankton discovered before darkness had disappeared, while, new picoplankton were identified to grow 459
c Pseudo-nitzschia behaved differently for the species from different communities
460 461
Figure Legends
462 463
464
Fig. 1 Dark survival rates of species from W1, the lines show the regressions fitted to the data: all
465
other species: Y=0.017X2-0.679X+2.671, R2=0.961; Skeletonema: Y=-0.011X2+0.032X+0.4556,
466
R2=0.721; Thalassiosira: Y=-0.149X+0.418, R2=0.938
467 468 469
470
Fig. 2 Growth rates as a function of the length of dark incubation prior to re-illumination, after
471
varying periods of darkness and average growth rates during dark incubation, error bars mean ± 1
472
SD. Growth rates in light culture: open squares: Skeletonema, open circles: Thalassiosira; open
473
diamonds: Pseudo-nitzschia, open triangles: all other species. Growth rates in dark incubation: full
474
squares: Skeletonema, full circles: Thalassiosira; full diamonds: Pseudo-nitzschia, full triangles: all
475
other species.
476
477
Fig. 3 Lag times as a function of the length of dark incubation prior to re-illumination, after varying
478
periods of darkness, error bars mean ± 1 SD. Open squares: Skeletonema, open circles:
479
Thalassiosira; open diamonds: Pseudo-nitzschia, full triangles: all other species.
480 481
482
Supplementary Document 1. Growth rate and lag time after varying periods of darkness
483
Community Species Darkness µgrowth ± SD (d-1) Lag time ± SD (d) µgrowth ± SD (d-1)
W1 Skeletonema 0 week
6 week 13 week 19 week
0.70±0.05 0.88±0.05 0.78±0.05 0.65±0.09
0.80±0.57 2.60±0.72 2.01±0.86 0.78±0.99
- - - - Thalassiosira 0 week
6 week 13 week 19 week
0.63±0.06 0.71±0.04 0.61±0.09 0.71±0.16
2.68±0.30 3.58±0.59 3.50±0.59 5.40±1.46
- - - - All other species 0 week
6 week 13 week 19 week
0.12±0.04 - - -
1.59±1.13 - - -
- -0.05±0.06
0.13±0.26 0.31±0.19
W2 Skeletonema 0 week
7 week 13 week
0.69±0.13 0.80±0.03 0.55±0.05
4.76±1.35 2.28±1.75 0.96±1.84
- - - Thalassiosira 0 week
7 week 13 week
0.54±0.06 0.57±0.06 0.55±0.18
3.18±1.62 3.12±1.51 3.47±0.56
- - - All other species 0 week
7 week 13 week
0.17±0.03 - -
2.00±3.42 - -
- 0.15±0.05 0.06±0.08
W3 Skeletonema 0 week
6 week
0.69±0.14 0.51±0.12
0.99±1.17 1.13±2.57
- - Thalassiosira 0 week
6 week
0.88±0.09 0.76±0.06
0.53±0.61 3.53±1.62
- - Pseudo-nitzschia 0 week
6 week
0.39±0.06 0.34±0.06
0 5.29±1.33
- - All other species 0 week
6 week
0.23±0.04 0.51±0.09
0 5.00±0.80
- - 484
485
Supplementary Figure
486
487