A study on the economic effects of the current VAT rates structure
Final Report
TAXUD/2012/DE/323
FWC No. TAXUD/2010/CC/104
Client: European Commission, TAXUD
Institute for Advanced Studies (Project Leader)
CPB Netherlands Bureau for Economic Policy Analysis (Consortium Leader)
In consortium with:
CAPP CASE CEPII ETLA IFO IFS
Vienna, 17 October 2013
This report was commissioned by the European Commission (DG TAXUD) and
prepared by a consortium under the leader CPB. The views and opinions expressed in
this report are not necessarily shared by the European Commission, nor does the report
anticipate decisions taken by the European Commission.
CPB Netherlands Bureau for Economic Policy Analysis Van Stolkweg 14
P.O. Box 80510
2508 GM The Hague, the Netherlands
CONSORTIUM MEMBERS
IHS Institute for Advanced Studies (Project Leader)
Sandra Müllbacher, Raphaela Hyee
CPB Netherlands Bureau for Economic Policy Analysis (Consortium Leader)
Leon Bettendorf, Hugo Rojas-Romagosa, Paul Veenendaal
CAPP Centre for the Analysis of Public Policies
Massimo Baldini
CASE Center for Social and Economic Research
Luca Barbone, Mikhail Bonch-Osmolovskiy
IFS Institute for Fiscal Studies
Stuart Adam
Contents
Preface ... 13
Abstract ... 15
Executive Summary ... 16
1 Introduction ... 23
1.1 The VAT in the European Union ... 23
1.2 The case for a diversification of VAT rates – insights from economic theory ... 28
1.3 Tasks performed, reform scenarios and report outline ... 34
2 Static analysis of VAT structure and reforms ... 38
2.1 Data and procedure ... 38
2.2 Results: Overview ... 57
2.3 Results: VAT paid by private households ... 66
2.4 Results: VAT paid by non-household entities... 87
2.5 Results: Effects of different scenarios on VAT liability ... 95
3 General equilibrium effects of VAT reforms ... 99
3.1 Methodology: The WorldScan model ... 99
3.2 Implementation of status quo and reform scenarios ... 107
3.3 Results ... 110
4 Conclusions ... 133
A. Annex... 138
A.1 Growth rates applied to HBS data ... 138
A.2 COICOP Classification ... 140
A.3 Validation exercise: Comparison with results based on micro data ... 145
A.4 VAT reductions on expenditure categories potentially in conflict with other EU policies ... 161
A.5 WIOD Classifications of products and sectors ... 163
A.6 GTAP and WorldScan Classifications and Aggregations ... 165
References ... 168
List of Tables
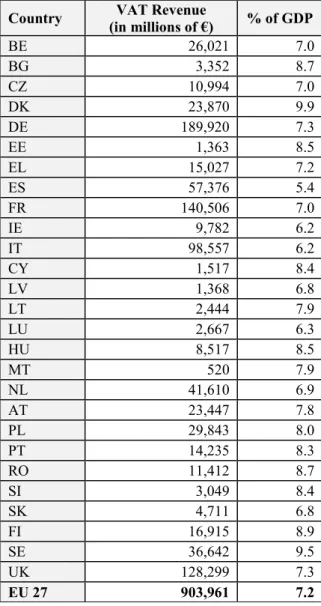
Table 1: Total VAT revenue – in absolute terms and relative to GDP (as of 2011) ... 26
Table 2: VAT rates in Member States (as of 2011) ... 27
Table 3: Sample Size Household Budget Surveys 2005 ... 40
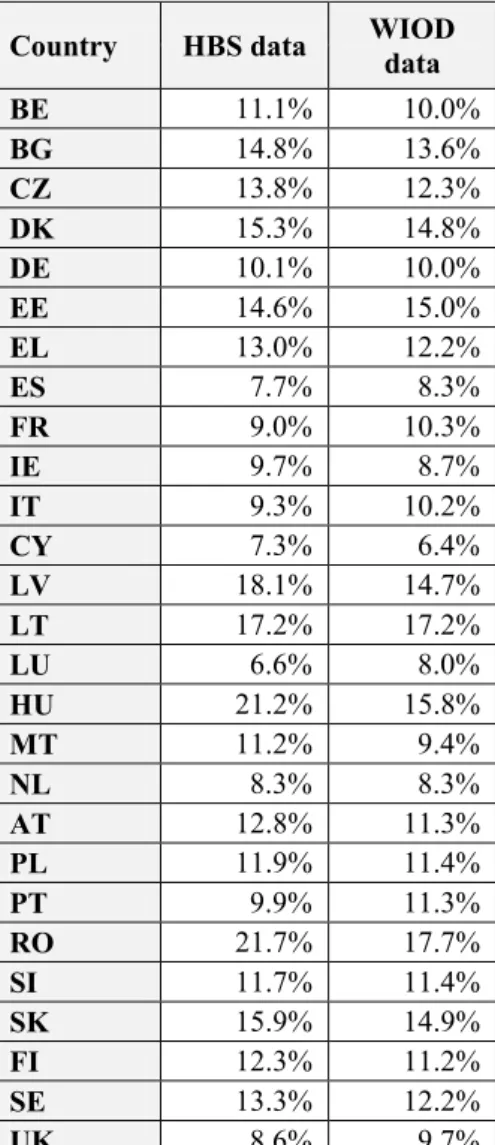
Table 4: Comparison of average effective VAT rates in 2011 in HBS and WIOD ... 56
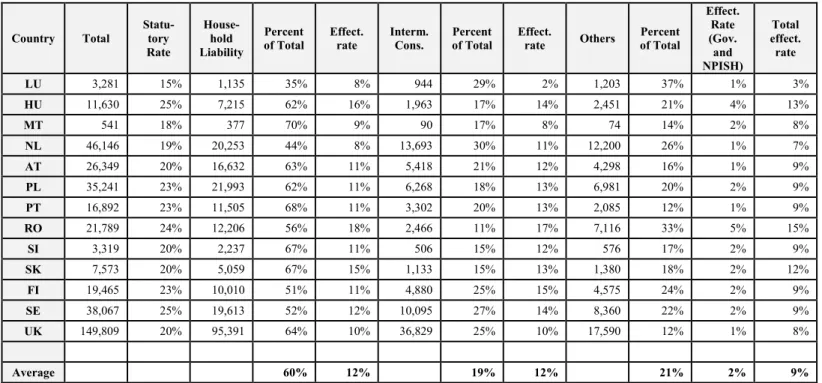
Table 5: 2011 Baseline VAT Liability (million Euros) ... 59
Table 6: 2011 Baseline VAT Liability (million Euros), continued from Table 5 ... 60
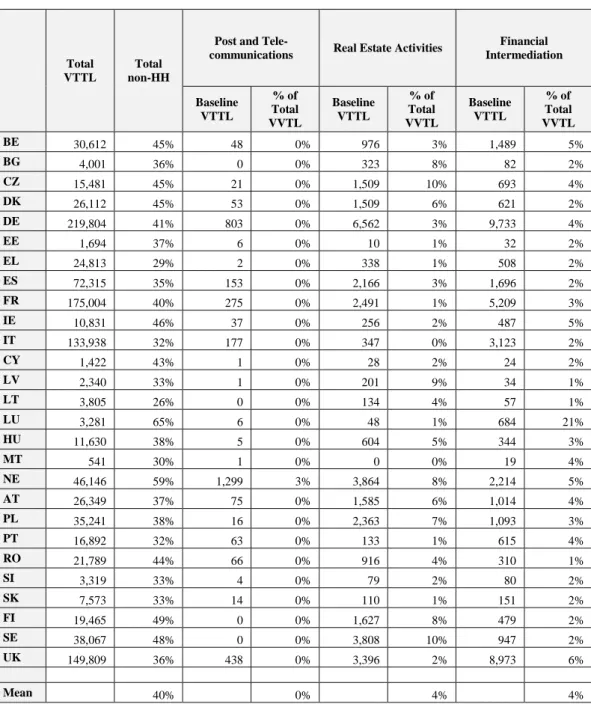
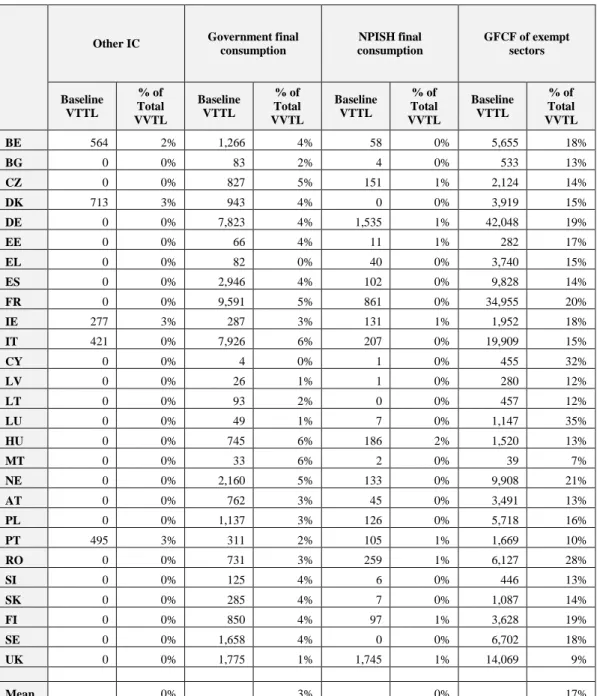
Table 7: Baseline VAT Liability for main exempt sectors and activities ... 61
Table 8: Baseline VAT Liability for main exempt sectors and activities (continued from Table 7) ... 62
Table 9: Baseline VAT Liability for main exempt sectors and activities (continued from Table 8) ... 63
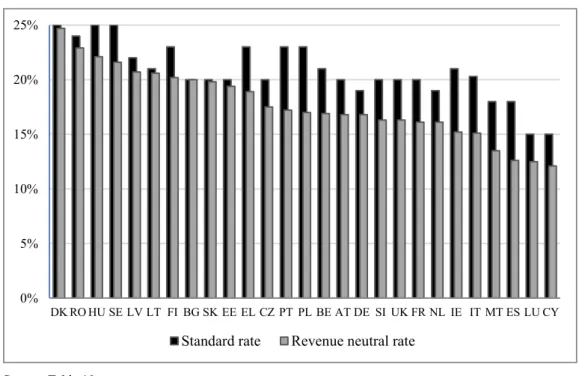
Table 10: Standard and revenue neutral rates ... 65
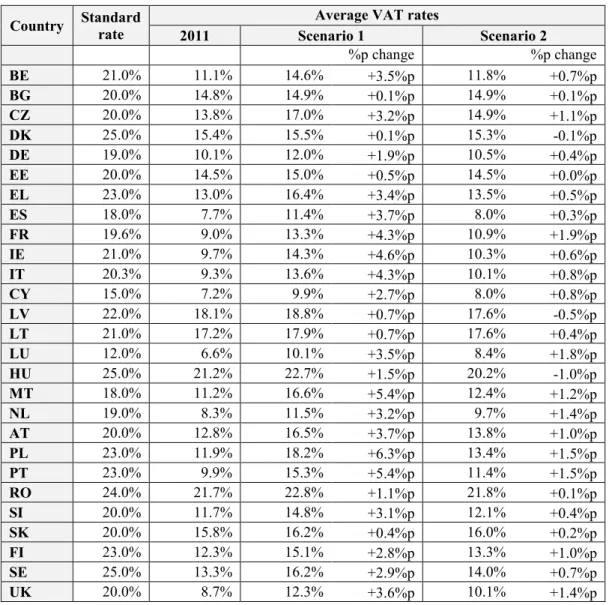
Table 11: Average VAT rates of private households of EU Member States in 2011 ... 68
Table 12: Average VAT bills of private households of EU Member States as a proportion of total household expenditure and in € per year ... 70
Table 13: Categories with the highest VAT expenditure, their share and their combined share of total VAT expenditure for EU Member States, 2011... 72
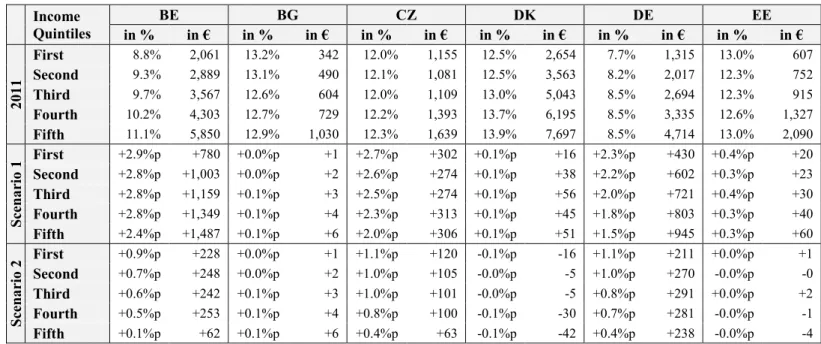
Table 14: Average VAT bill of private households as a proportion of total household expenditure and in Euros per year, by income quintile in 2011 and reform scenarios 1 and 2, for BE, BG, CZ, DK, DE and EE ... 77
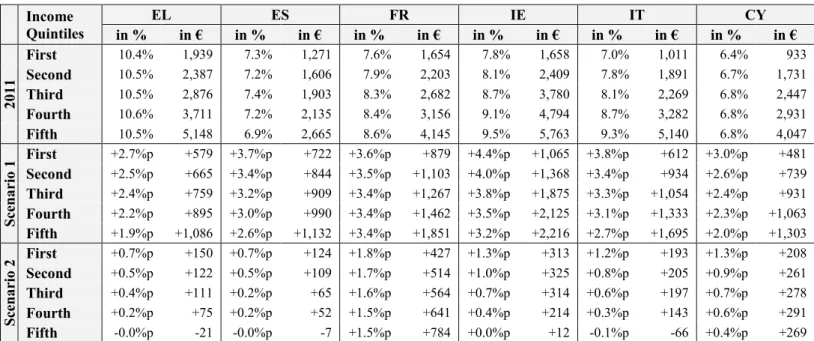
Table 15: Average VAT bill of private households as a proportion of total household expenditure and in Euros per year, by income quintile in 2011 and reform scenarios 1 and 2, for EL, ES, FR, IE, IT and CY ... 78
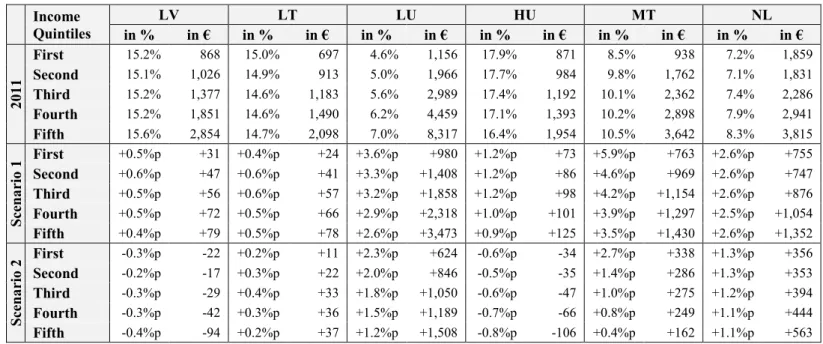
Table 16: Average VAT bill of private households as a proportion of total household expenditure and in Euros per year, by income quintile in 2011 and reform scenarios 1 and 2, for LV, LT, LU, HU, MT and NL ... 79
Table 17: Average VAT bill of private households as a proportion of total household expenditure and in Euros per year, by income quintile in 2011 and reform scenarios 1 and 2, for AT, PL, PT, RO, SI and SK... 80
Table 18: Average VAT bill of private households as a proportion of expenditure and in Euros per year, by income quintile in 2011 and reform scenarios 1 and 2, for FI, SE and UK ... 81
Table 19: Most affected socio-economic groups in 2011, measured by the proportion of VAT expenditure to total household expenditure ... 84
Table 20: Most affected socio-economic groups by reform scenarios 1 and 2 in Member States, measured by the relative rise in VAT expenditure ... 85
Table 21: Most affected socio-economic groups by reform scenarios 1 and 2 in Member States, measured by equivalised absolute increase in VAT expenditure ... 86
Table 22: Scenario 1 – Abolition of zero and reduced rates ... 88
Table 24: Scenario 1 – Effects on main exempt sectors and activities
(continued from Table 20) ... 92 Table 25: Scenario 2 – Revenue-neutral abolition of reduced and zero rates
(new liability and percentage change from baseline) ... 94 Table 26: Revenue effects and compensation, scenarios 1 and 3,
expressed in % of GDP ... 97 Table 27: Revenue effects and compensation, scenarios 1 and 3 (Million Euros) ... 98 Table 28: Scenario A, changes in VAT rates and sectoral output,
simple EU-27 averages ... 111 Table 29: Scenario A – percentage changes in main economic indicators, relative
changes with respect to baseline values in 2020 ... 114 Table 30: Scenario A – percentage changes in sectoral output share, relative changes
with respect to the baseline values in 2020 ... 115 Table 31: Comparison of standard VAT rates (as of 2011), revenue neutral standard
rates as obtained in scenario 2 and revenue neutral standard rates as obtained in scenario B ... 117 Table 32: Sectoral output share for each scenario for the EU-27 as a whole, percentage
changes with respect to the baseline ... 119 Table 33: Scenario B – percentage changes in main economic indicators, relative
changes in 2020 with respect to baseline values ... 121 Table 34: Scenario B – percentage changes in sectoral output share, relative changes
with respect to the baseline values in 2020 ... 122 Table 35: Scenario C – percentage changes in main economic indicators, relative
changes in 2020 with respect to baseline values ... 125 Table 36: Scenario C – percentage changes in sectoral output share, relative changes
with respect to the baseline values in 2020 ... 126 Table 37: Scenario D – percentage changes in main economic indicators, relative
changes in 2020 with respect to baseline values ... 129 Table 38: Scenario D – percentage changes in sectoral output share, relative changes
with respect to the baseline values in 2020 ... 130 Table 39: Summary of macroeconomic consequences for each scenario for the EU-27 as a whole, percentage changes with respect to the baseline ... 132 Table 40: Growth rates applied to HBS data (uprate from 2005 to 2011) ... 138 Table 41: Comparison of estimates of VAT bills, in absolute values and as a percentage
of total expenditure, by COICOP category, estimated on aggregate HBS data as in this report, and micro-HBS data, for Austria ... 146 Table 42: Comparison of estimates of VAT bills, in absolute values and as a percentage
of total expenditure, by income quintile and COICOP category, estimated on aggregate HBS data as in this report, and micro-HBS data, for Austria ... 148 Table 43: Original and imputed incomes per equivalent income decile in the EU-SILC
2006 and HBS 2005. ... 151
Table 44: Comparison of estimates of VAT bills, in absolute values and as a percentage of total expenditure, by COICOP category, estimated on aggregate HBS data as in this report, and micro data, for Italy ... 153 Table 45: Comparison of estimates of VAT bills, in absolute values and as a percentage
of total expenditure, by income quintile, estimated on aggregate HBS data as in this report, and micro data, for the UK ... 155 Table 46: Comparison of estimates of VAT bills as a percentage of total expenditure, by
income quintile, as in IFS et al. (2011), estimated on aggregate data and micro data, taking into account different concepts of equivalisation and income
definition ... 159
Table 47: Abolition of zero and reduced rates for the categories Water, Energy products,
Street cleaning, refuse collection and waste treatment, Housing ... 162
Table 48: WIOD Classification of sectors ... 163
Table 49: WIOD Classification of products ... 165
Table 50: GTAP sectors and WorldScan intermediate and final sectoral aggregations 166
Figure 1: Standard and revenue neutral rates ... 66
Figure 2: Scenario 1 – Changes in VAT liabilities of non-households ... 89
Figure 3: Scenario 2 – Revenue neutral abolition of reduced and zero rates ... 95
Figure 4: Increase in VAT liability (percent of GDP) ... 99
List of Acronyms and abbreviations
AGO Agriculture
AT Austria
BE Belgium
BG Bulgaria
CES Constant Elasticity of Substitution CGE Computational General Equilibrium
COICOP Classification of Individual Consumption by Purpose CPA Classification of Products Activity
CY Cyprus
CZ Czech Republic
DE Germany
DK Denmark
EE Estonia
EL Greece
ES Spain
EU European Union
EU-27 Current Member States of the European Union minus Croatia EUROSTAT Statistical Office of the European Union
FI Finland
FR France
GDP Gross Domestic Product GFCF Gross Fixed Capital Formation GTAP Global Trade Analysis Project HBS Household Budget Survey
HU Hungary
IBFD International Bureau of Fiscal Documentation
IE Ireland
LCFS Living Costs and Food Survey LES Linear Expenditure System
LT Lithuania
LTM Low-tech Manufacturing
LU Luxembourg
LV Latvia
MT Malta
NA National Accounts
NACE Statistical Classification of Economic Activities in the European Community
NL Netherlands
NPISH Non-Profit Institutions Serving Households
OCS Commercial Services
OECD Organisation for Economic Cooperation and Development OSG Public Services
OSR Other Services
PL Poland
PT Portugal
RO Romania
ROW Rest of the World
SE Sweden
SI Slovenia
SILC Statistics on Income and Living Conditions
SK Slovakia
TAXUD Taxation and Customs Union Directorate-General
(European Commission)TRA Transport
UK United Kingdom
UN United Nations
USA United States of America
VAT Value Added Tax
VATTL VAT Total Tax Liability WIOD World Input Output Database
WS WorldScan
Preface
This final report presents the results of the project “A study on the economic effects of the current VAT rates structure”, Specific Contract no. TAXUD/2012/DE/323, implementing Framework Service Contract no. TAXUD/2010/CC/104 for the provision of economic analysis in the area of taxation.
The main research question of the project is to quantify for each Member State (EU- 27):
how much, broken down by categories of goods and services, private households and non-taxable and taxable persons carrying out exempt activities spend on VAT
how much they would spend in case
zero and reduced rates
1were abolished
zero and reduced rates were abolished and replaced with a new revenue neutral standard rate.
zero and reduced rates were abolished and low-income households receive lump sum transfers in compensation for their higher VAT bills.
We also calculate VAT revenues for each Member State (EU-27) and the EU-27 as a whole for each of these scenarios.
Changes in the prices of goods and services lead to changes in total expenditure and expenditure patterns. For some countries these changes in the consumption of private households have been analysed in a previous project of the consortium (see IFS et al., 2011). The present study, however, ignores behavioural reactions while performing the analysis on the reform scenarios regarding effects on households, non-households and VAT revenues. The underlying assumption is that net expenditures (both of households and non-households) remain constant notwithstanding changes in absolute and relative prices of goods and services.
The second part of the study includes a simulation of the general equilibrium effects on main macroeconomic indicators (GDP, consumption, employment, foreign trade) following changes in the VAT regime. This analysis takes into consideration
1We use “zero and reduced rates” as a short-hand description of the full set of reduced rates, super-reduced rates, parking rates and zero rates of VAT applied in different EU countries.
behavioural reactions to external shocks such as changes in tax regimes. Given the different concepts of analysis (static and general equilibrium analysis) the scenarios analysed in the latter are similar, though not equal, to the ones specified above.
The report presents the situation in 2011, as the latest available data for most countries are from 2011.
The report presents the results obtained given the available data. Especially the analysis for private households has several shortcomings, as a request for additional data to Eurostat was not answered favourably
2. Therefore, the following information requested in the Terms of Reference could not be delivered:
VAT paid as a proportion of household income (both disaggregated data on mean income in relation to the various household groups and data on mean income per income and expenditure quintiles are not available)
Results broken down by expenditure quintiles (both data on mean consumption expenditure and on the structure of consumption expenditure by expenditure quintile are not available)
For some countries information on certain tables is missing.
3Also, more detailed information on the definition of breakdowns could not be obtained.
The final version of the report will extend this version by adding the following:
Abstract in French
Executive Summary in French
We gratefully acknowledge the comments on a first draft of this report received from Tuomas Kosonen, Andreas Peichl and European Commission staff.
2 Unlike other European statistics (such as the EU-SILC or the Labour Force Survey) HBS micro data are not yet available for research purposes, although there are intentions to change this in near future when aspects of anonymisation and confidentiality are settled.
3 Italy: missing data for households broken down by income quintiles (we provide results based on micro data instead).
Netherlands: missing data for households broken down by the number of active persons in the household and for different household types.
Romania: missing data for households broken down by the activity status of the household head.
Sweden: missing data for households broken down by the number of active persons in the household.
Slovenia: data provided by household type is too fragmentary to enable calculations.
Slovakia: missing data for households broken down by the number of active persons in the household.
In addition, some subgroups are missing in some countries (e.g. the self-employed in Sweden).
Abstract
This study provides a comprehensive overview of the distributional effects of the VAT rates structures currently in place in the EU-27 Member States. It builds on a consistent database and uses a coherent methodology that facilitates the meaningful comparison of effective VAT rates across categories of goods and services and across countries. This is crucial as the degree to which governments rely on zero and reduced rates varies greatly across countries, generating an uneven picture of effective VAT rates in the EU.
This report sets out to analyse, for each country, the distributional effects of the current,
diversified VAT rates structure, and to estimate how the abolition of zero and reduced
rates would affect VAT payments by households and non-households, both overall and
for socio-economic sub-groups (low-income households, single-parent households, etc.)
and sector (health, education, etc.). It estimates the magnitude of additional VAT
revenues that could be generated by abolishing zero and reduced rates, and
quantitatively assesses the likely macroeconomic consequences (in each Member State
and across the EU) of the implementation of a uniform VAT rates structure within each
Member State.
Executive Summary
Objective
VAT rates structures in the European Union are widely diversified. The objective of this study is twofold: first, we collect data on the VAT rates structure currently in place in the EU-27 Member States, on expenditures and the corresponding VAT payments.
Second, we estimate the potential effects of abolishing all zero and reduced rates
4currently in place on households, non-households, VAT revenues and various important macroeconomic indicators, for all EU-27 countries. The data are collected and prepared for each Member State, taking into account the country’s rules regarding exemptions, zero, super-reduced, reduced and parking rates.
Data and procedure
We use several databases to perform the analyses. For the analysis of households, we use aggregate information from national Household Budget Surveys provided by Eurostat. We uprate the latest available data from 2005 to 2011 using information on expenditure growth from National Accounts data. We then apply the VAT rates in place in 2011 in each Member State to the various categories of goods and services. We calculate how much an average household pays in VAT in absolute terms and as a proportion of their total expenditure, and further break down the results by socioeconomic characteristics (income, household type). We analyse three reform scenarios: 1., abolish all zero and reduced VAT rates (and tax the formerly zero or reduced rated goods and services at the standard rate), 2., abolish all zero and reduced rates, but lower the standard rate such that the reform is revenue neutral and 3., as scenario 1, but compensate households in the first and second (3a) or first income quintile (3b) for their higher VAT payments. We analyse how each reform scenario would change the average VAT burden in each Member State.
The analysis of non-households and VAT revenues uses data from the World Input Output Database (WIOD) and supplemental information gathered from communications from national authorities. Again we apply VAT rates to the classification of goods and services and calculate VAT liabilities for all Member States and different kinds of non-households (exempt sectors, government, non-profit institutions serving households and irrecoverable input VAT paid on gross fixed capital
4We use “zero and reduced rates” as a short-hand description of the full set of reduced rates, super-reduced rates, parking rates and zero rates of VAT applied in different EU Member States.
formation). We calculate the changes in VAT liabilities for non-households for scenarios 1 and 2. Furthermore, we calculate increases in VAT revenues that would be expected following the implementation of scenario 1, and consider an additional scenario that compensates households in the first and second (scenario 3a) or in the first income quintile (scenario 3b) for their higher VAT payments.
5These analyses are performed assuming that behaviour does not change as a consequence of the reforms (households and non-households continue to purchase the same amount of goods and services). In addition, we perform a general equilibrium analysis incorporating behavioural responses using the general equilibrium model WorldScan. The impact of different reform scenarios on GDP, employment, consumption and trade volumes are analysed for the EU as a whole and separately for each Member State (EU-27).
Results Households
Households account for 60 % of all VAT liability across the EU-27 countries. We find that the average EU-27 household faces a VAT bill that amounts to 11 % of their total expenditure. This ratio is highest in Romania and Hungary (17.8 % and 17.5 %), followed by Latvia (15.3 %), Lithuania (14.7 %) and Slovakia (13.7 %). Households in Luxembourg (6.2 %), Cyprus (6.8 %), Spain (7.2 %), the Netherlands (7.7 %) and the United Kingdom (8.0 %) face the lowest VAT bill as a proportion of expenditure. In most countries, the largest part of private households’ VAT bill relates to goods and services belonging to the category “Transport”: Expenditure on the purchase and use of vehicles is high and usually taxed at the standard rate. In those countries where food is taxed at the standard rate, VAT paid on food and non-alcoholic beverages is substantial.
Expenditure on housing and energy is usually taxed far below the standard rate.
However, as expenditure on housing is an important part of total expenditure, VAT payments relating to these categories are high in many countries.
Abolishing zero and reduced rates (scenario 1) increases the average VAT rate faced by households, but the size of the change varies considerably between Member States. The effect is almost non-existent in Bulgaria, Denmark, Slovakia and Estonia, where zero or
5 As we lack the necessary information we cannot perform an analysis of scenario 3 for different household types. For example, we do not know how many single households are in the first income quintile and are therefore not affected by VAT increases in scenario 3 – this could only be done with micro data.
reduced rates apply only to very few supplies. Households in Poland, on the other hand, face an increase in the average VAT rate of more than 6 percentage points. We also find large increases in Portugal, Malta, Ireland, Italy, France, Spain, the UK, Austria, Luxembourg, Belgium, Greece, the Czech Republic, Slovenia and the Netherlands.
Scenario 2 (introducing a uniform, but lower VAT rate) increases overall VAT payments for private households in most countries, because they benefit more from zero and reduced rates in the status quo than non-households.
To analyse the distributional effects of the current and alternative VAT rates structures, we separate households into five equally sized income groups or quintiles. In all countries, high-income households pay more VAT than low-income households in absolute terms. We find the largest gap in Luxembourg – where the highest income quintile pays seven times more VAT than the lowest income quintile – and the smallest gap in the Czech Republic, Austria and the Netherlands. Looking at VAT bills as a proportion of total expenditure, we find Hungary to be the only country with a regressive system (low-income households face a higher VAT burden as a fraction of total expenditure than high-income households). The VAT system in 11 countries (Spain, Romania, Bulgaria, Lithuania, Slovakia, Estonia, Greece, Austria, the Czech Republic, Cyprus and Latvia) is approximately proportional: that is, all income quintiles pay roughly the same share of their expenditure in VAT. We find a progressive system in the United Kingdom, Luxembourg, Italy, Belgium, Poland, Malta, Slovenia, Finland, Ireland, Denmark, Sweden, Portugal, France, the Netherlands and Germany.
Abolishing zero and reduced rates does not have the same effect on households across the income distribution. In nine countries (Romania, Lithuania, the Netherlands, Latvia, France, Austria, Hungary, Finland and Sweden) the increase in VAT as a fraction of expenditure is similar across all income groups (with the average change ranging from 0.5 percentage points in Latvia to 3.5 percentage points in France). In the remaining 14 countries,
6poorer households face a larger increase as a fraction of expenditure than richer households. Thus, in these countries, the zero and reduced VAT rates currently in place seem to do quite well at reducing the VAT burden of poorer households. High- income households, however, face larger increases in absolute VAT payments in all countries as a consequence of the reform. That is, in all countries, high-income households benefit more from zero and reduced rates in absolute terms, while low- income households benefit more as a percentage of expenditure.
6 Recall that there are almost no reform effects in 4 countries (Bulgaria, Denmark, Estonia and Slovakia).
Abolishing zero and reduced rates, but lowering the standard rate to make the reform budget neutral, leads to higher losses for lower income than for higher income households in most countries. Higher-income households allocate a larger share of their expenditure to supplies currently taxed at the standard rate. Therefore, in this scenario, they benefit more from the reduction in the standard rate. On the other hand, lower- income households suffer more from the abolition of zero and reduced rates and benefit less from the reduction in the standard rate.
7Non-households
Across all EU-27 countries, on average, exempt sectors account for 19 % of total VAT liabilities. Other non-households such as governments and non-profit institutions serving households account for 21 %. These numbers differ between countries. We find the largest share of VAT liabilities of non-households in Luxembourg (65 %), followed by the Netherlands (56 %) and Sweden (48 %), and the lowest in Lithuania (26 %), Greece (29 %) and Malta (30 %). Non-households are affected by the reform scenarios through non-recoverable VAT they pay on inputs.
In most countries, following the abolition of zero and reduced rates, non-households face a lower increase in their VAT bills than households. The increase in VAT payments faced by exempt sectors is 14 % for the EU-27 on average, while VAT liability for other non-households increases by 13 %. Seven of the 36 sectors are affected by the reform in all countries (average increase in VAT liabilities across the EU-27 given in brackets):
Real Estate Activities (20 %)
Education (20 %)
Health and Social Work (19 %)
Other Community, Social and Personal Services (18 %).
Public Administration and Defence (11 %)
Financial Intermediation (7 %)
Post and Telecommunications (5 %)
Abolishing zero and reduced rates and lowering the standard rate accordingly, by construction, does not change overall VAT liability. However, in most countries non-
7 Although we focus on the analysis of VAT expenditure patterns across the income distribution, this study also shows breakdowns by other household characteristics (activity status of the household head, number of active persons in the household, household type and age of the household head).
households benefit from such a reform because the reduction in the standard rate is more than sufficient to compensate for the abolition of zero and reduced rates on supplies purchased by exempt sectors and other non-households. On average, VAT liability for exempt sectors decreases by 4 %. For other non-households, VAT liability decreases by 5 %.
8Additional VAT revenues
We calculate additional VAT revenues for the reform scenario in which zero and reduced rates are abolished. In addition, we consider a scenario where low-income households are reimbursed for their additional VAT burden via a lump-sum transfer allowing them to buy the same basket of supplies as they did in the base scenario (scenario 3). We consider two different definitions of “low-income” households. First, we compensate households in the first and second income quintile (3a); second, we compensate households in the first income quintile only (3b).
Abolishing zero and reduced rates in all Member States (EU-27), on the EU-27 average, leads to an increase in VAT revenues of 1.6 % of GDP. The increase is largest for countries making extensive use of zero and/or reduced rates, such as Poland and Portugal (these countries experience an increase in VAT revenues of 3.3 % of GDP), followed by Italy (+3.0 %), Spain (+2.9 %) and Malta (+2.8 %). On the other hand, the effect is virtually zero in Denmark, Bulgaria and Slovakia. On the EU-27 average, compensating low-income households decreases the additional VAT revenues to 1.3 % of GDP (compensating first and second quintile, scenario 3a) or 1.5 % (compensating first quintile only, scenario 3b). This is because higher income households are responsible for the lion’s share of spending, even on zero and reduced rated supplies, in absolute terms.
General equilibrium effects of VAT reforms
We estimate the medium-term effects of various VAT reform scenarios using a Computational General Equilibrium (CGE) model, WorldScan. This analysis of the broader economic consequences of VAT reforms is conceptually different from the static analysis of households, non-households and VAT revenues; therefore, the
8 In Estonia, Cyprus, Latvia, Lithuania, Romania and Slovakia exempt sectors face an increase in their VAT burden. This is the case for other non-households in Spain, France and Italy.
scenarios analysed in this dynamic part do not directly correspond to the three scenarios analysed above.
In scenario A, we abolish zero and reduced VAT rates, and the additional VAT revenues are channelled back into the economy by increases in transfers and public spending. In this scenario, effective VAT rates increase, reducing production in those sectors facing the highest increases in VAT (agriculture, low-tech manufacturing and transport) in the medium-run. For the EU-27 as a whole, we find relatively small changes in the main macroeconomic indicators. EU-27 GDP decreases by 0.4 %. These reductions are in line with reductions in consumption (-0.7 %), employment (-0.5 %, with a larger reduction for low-skilled than for high-skilled workers) and international trade (export and import volumes decrease by 0.7 % and 0.5 %, respectively). Targeting the additional VAT revenue specifically to economically weak households (low-skilled employed and unemployed households, scenario E) does not substantially change these results.
When we decrease the standard VAT rate such that the abolition of zero and reduced rates is revenue neutral (scenario B), we find no effect on GDP on the EU-27 average.
The effects on the other macroeconomic variables are also small; however, we do find some employment growth, this time benefitting low-skilled households relatively more than high-skilled households. In addition, wages of low-skilled workers increase compared to those of high-skilled workers. In this scenario, the effects vary between Member States. GDP increases in 14 Member States (Latvia experiences the biggest increase – 1.02%, Portugal and Cyprus are tied for the second largest increase – 0.36%) and decreases in 11 Member States (Hungary faces the largest decrease -0.18 %, followed by France and Lithuania with -0.17 % and -0.16 % respectively). There is no change in two Member States (Estonia and Malta).
Scenarios A, B and E disregard the potential reduction of the administrative burden of VAT collection that could arise from a simpler VAT rates structure. Taking these effects into account (scenario C) leads to very small positive effects on all main macroeconomic variables (GDP +0.11 %, consumption +0.08 % employment +0.04 %, export volumes +0.14 % and import volumes +0.05 %) in the EU-27 on average.
Finally, using the additional VAT revenues to finance cuts in the capital-investment tax
(scenario D) leads to increases of GDP in the EU-27 average (+0.6 %).
Conclusions
Given the heterogeneous VAT rates system in the EU-27, the reform scenarios have very different effects in the different Member States. This makes drawing general and committed conclusions on the results of this study somewhat difficult. We can, however, conclude that:
Zero and reduced rates overall achieve their goal of lowering the VAT burden of low-income households when we look at VAT payments as a proportion of expenditures.
However, in Member States with an extensive use of zero and reduced rates, substantial additional VAT revenues could be raised by abolishing these VAT rate reductions; and most of these additional VAT revenues would be paid by high- income households. This demonstrates that the potential of zero and reduced VAT rates as a tool for redistribution is limited. More targeted policy instruments could accomplish the task of compensating low-income households for their additional VAT payments at comparably low costs.
The introduction of a budget-neutral uniform VAT rate, replacing all zero, reduced and standard rates, benefits non-household entities while households suffer a loss in most countries. In particular, we find that low-income households suffer more in proportion to their expenditures. When transfers are paid to compensate these households, revenue-neutrality of the reform requires a higher uniform VAT-rate (Crawford et al., 2010).
Concerning the medium-run macroeconomic consequences of reforms of the VAT rates structure, we find that harmonising diverging VAT rates within each Member State does not necessarily have significant effects, as both VAT exemptions and large rate differences between Member States continue to exist. However, if we allow for possible efficiency gains generated by simpler VAT rates systems, we find larger positive effects on Member States’ economies.
1 Introduction
1.1
The VAT in the European UnionOn 17 May 1977, the Sixth VAT Directive was adopted which led to a uniform VAT coverage in the European Union. The VAT Directive
9, enacted on 1 January 2007 and replacing the Sixth Directive, contains legislations concerning the common VAT system currently in place.
10The Directive does not stipulate one uniform percentage rate for the whole Union, but sets boundaries for the Member States. It restricts the minimum standard rate to 15 % (this regulation has been extended to 31 December 2015) and allows for two reduced rates of at least 5 % for goods and services listed in the Annex III of the VAT Directive. Moreover, after consultation of the VAT Committee, each Member State may apply a reduced rate to the supply of natural gas, electricity or district heating. Some derogations and exceptions for Member States are in place, entailing the existence of zero rates, super reduced, reduced and parking rates.
These derogations were granted during the negotiations of the VAT rates provisions or in the Acts of Accession to the European Union. Most of them are part of the so called
"stand-still" situation and apply until the adoption of definitive arrangements of VAT relating to the trade between Member States. The main objective of these derogations is to ensure the gradual transition towards the application of uniform rules. Overall, such derogations prevent a coherent system of VAT rates in the EU from being applied.
The VAT is a major source of tax revenue in the EU, yielding € 904 billion in 2011 alone. This amounts to generating 7.2 % of the EU’s GDP or 17.8 % of all public revenues. The average standard rate in the EU was 20.7 % in 2011, compared to 19.4 % in 2008, mirroring the need for financial consolidation in many Member States in the wake of the financial crisis. In 2011, the lowest standard rates could be found in Cyprus and Luxembourg, which both exhausted the minimum 15 %. The highest standard rates were applied in Denmark, Hungary and Sweden with 25 %. It is also Denmark where the VAT made up the biggest share of GDP, 9.9 %, whereas Spain had the lowest share with 5.4 %.
11Table 1 illustrates the differences in VAT revenue and its share of GDP across EU Member States.
9 Council Directive 2006/112/EC of 28 November 2006.
10 see http://eur-lex.europa.eu/LexUriServ/LexUriServ.do?uri=OJ:L:2006:347:0001:0118:en:PDF [2013/03/25]
11 Source: Eurostat, http://epp.eurostat.ec.europa.eu/portal/page/portal/statistics/search_database, Economy and finance, Government statistics, Annual government finance statistics, Main national accounts tax aggregates [2013/06/29]
Not only is the VAT a vital source of tax revenue but being a consumption tax, it also has some valuable economic advantages over other taxes. Not taxing intermediate supplies
12avoids distortions in the production process. Furthermore, taxing only consumption avoids disincentives on savings and investments (IFS et al., 2011).
As mentioned above, Member States are entitled to introduce up to two reduced VAT rates of at least 5 %. In addition to these reduced rates, some Member States also have super-reduced rates, parking rates (see below) and zero rates.
13The main reasons for the existence of reduced rates are equity concerns (this applies especially to every day goods that lower-income households spend a higher fraction of their income on, e.g.
foodstuffs) and accounting for positive externalities and internalities (IFS et al., 2011).
14Even if a good or service is not listed in Annex III of the VAT Directive, Member States can tax it at a reduced rate, if it was subject to a reduced rate before 1 January 1991 and the reduced rate is at least 12 % (a “parking rate”). Furthermore, regardless of whether or not a good or service is listed in Annex III of the Directive, if it was subject to a zero rate or a rate lower than 5 % before 1 January 1991, Member States may continue using this rate, provided that the reductions are “in accordance with Community law and […] have been adopted for clearly defined social reasons and for the benefit of the final consumer” (the zero and the so called super-reduced rates).
Table 2 gives a general overview of the different VAT rates in place in all Member States. The table reflects the VAT rates applicable in 2011 which have been used for the analysis carried out in this study. An updated situation of the VAT rates applied in the Member States can be found on the Commission's website.
15In addition to the already large number of exceptions, one can find further special rates scattered across some of the EU-27 Member States for very specific supplies, such as
12 VAT is applied at each stage of production; however, businesses have a right to deduct the tax on their inputs.
13 In addition, several supplies are completely exempt from VAT. In article 132, the VAT directive lists supplies that shall be exempt from VAT; Annex X, part b lists supplies Member States can continue to exempt. A zero rate is different from an exemption of VAT in so far as a zero rate indeed guarantees a tax free product. The producer can deduct VAT on inputs for the production of zero rated supplies, which is not the case for supplies that are exempted from VAT. In that case, although the final consumption good is tax free, the producers have no right to deduct the VAT they had to pay on their input goods.
14 The following section 1.2 will summarise the discussion on reduced rates in economic theory.
15http://ec.europa.eu/taxation_customs/resources/documents/taxation/vat/how_vat_works/rates/vat_rates_e n.pdf [2013/06/29]
for tolls on bridges in the Lisbon area, or for the supply of liquid petroleum gas (LPG)
in cylinders in Cyprus. Generally speaking, the VAT systems in place across the
European Union are still quite heterogeneous, despite the common legal framework and
guidelines in place.
Table 1: Total VAT revenue – in absolute terms and relative to GDP (as of 2011) Country VAT Revenue
(in millions of €) % of GDP
BE 26,021 7.0
BG 3,352 8.7
CZ 10,994 7.0
DK 23,870 9.9
DE 189,920 7.3
EE 1,363 8.5
EL 15,027 7.2
ES 57,376 5.4
FR 140,506 7.0
IE 9,782 6.2
IT 98,557 6.2
CY 1,517 8.4
LV 1,368 6.8
LT 2,444 7.9
LU 2,667 6.3
HU 8,517 8.5
MT 520 7.9
NL 41,610 6.9
AT 23,447 7.8
PL 29,843 8.0
PT 14,235 8.3
RO 11,412 8.7
SI 3,049 8.4
SK 4,711 6.8
FI 16,915 8.9
SE 36,642 9.5
UK 128,299 7.3
EU 27 903,961 7.2
Source: Eurostat16
Note: Exchange rates of 1.956 Bulgarian levs, 24.590 Czech koruny, 7.451 Danish kroner, 0.706 Latvian lats, 3.453 Lithuanian litai, 279.370 Hungarian forints, 4.121 Polish zloty, 4.239 Romanian lei, 9.030 Swedish kronor and 0.868 British pounds to 1 Euro.
16 http://epp.eurostat.ec.europa.eu/portal/page/portal/statistics/search_database, Economy and finance, Government statistics, Annual government finance statistics, Main national accounts tax aggregates [2013/06/29]
Table 2: VAT rates in Member States (as of 2011) Country Standard
Rate Reduced Rate(s)
Super Reduced
Rate
Parking
Rate Zero Rate
BE 21 6|12 - 12 Yes
BG 20 9 - - No
CZ 20 10 - - No
DK 25 - - - Yes
DE 19 7 - - No
EE 20 9 - - No
EL 23 6.5|13 - - No
ES 18 8 4 - No
FR 19.6 5.5 2.1 - No
IE 21 9|13.5 4.8 13.5 Yes
IT 20 10 4 - Yes
CY 15 5|8 - - No
LV 22 12 - - No
LT 21 5|9 - - No
LU 15 6|12 3 12 No
HU 25 5|18 - - No
MT 18 5|7 - - Yes
NL 19 6 - - No
AT 20 10 - 12 No
PL 23 5|8 - - No
PT 23 6|13 - 13 No
RO 24 5|9 - - No
SI 20 8.5 - - No
SK 20 10 - - No
FI 23 9|13 - - Yes
SE 25 6|12 - - Yes
UK 20 5 - - Yes
Note: All countries have VAT exemptions in place for some supplies.
Source: European Commission (2011a).
1.2
The case for a diversification of VAT rates – insights from economic theoryIn this section, we discuss differentiated VAT rates from the perspective of economic theory, relying on general economic reasoning and recent literature on the subject. The aim of this section is to review which arguments have been put forward in favour of taxing some goods and services at zero or reduced rates, and assess the theoretical merit of reduced VAT rates as compared to other policy instruments. Any conclusions in this section are based on the cited literature and not on the original results of this study (for conclusions based on our own results, see chapter 4).
The theory of optimal taxation takes as a benchmark the case in which consumption taxes are uniform on all final consumption goods, and zero on all intermediate goods.
Not taxing (intermediate) production inputs
17prevents distortions in the allocation of factor inputs, while taxing final consumption at a uniform rate avoids the distortion of consumption choices (e.g. Mankiw et al., 2009). In addition to distorting consumption choices, VAT exemptions distort competition (as exempt sectors, most prominently the financial sector, face different input prices across EU countries)
18, and create a bias towards self-supply and towards imports
19(Crawford et al., 2010).
Reasons put forward for nevertheless taxing some goods and services at reduced rates can be grouped into three categories (IFS et al., 2011, Copenhagen Economics, 2007):
equity concerns (alleviate the potentially regressive nature of consumption taxes)
efficiency (counteract adverse effects of other features of the tax system on the incentive to purchase goods and services on the market, or produce them at home)
positive production/consumption externalities, and what IFS et al.
(2011) and Copenhagen Economics (2007) call “internalities”, that is, positive effects of the consumption of a good or service on the
17 VAT is applied at each stage of production; however, businesses have a right to deduct the tax on their inputs.
18 Financial service providers face different input taxes in different countries of the European Union, which distorts competition if financial services are especially transferable across countries.
19 To understand why VAT exemptions can create a bias towards imports, consider a sector that is exempt in country A. As a domestic exempt firm cannot deduct VAT on its inputs, unrecovered VAT is cascading into the cost price of this supplier. In contrast, a firm producing in country B (not an exempt firm, just a firm producing supplies that are exempt in country A) and exporting to country A can deduct VAT on inputs. As the price of the supplies of the foreign firm does not include VAT on its inputs, this creates a bias towards imports (Crawford et al., 2010, p. 305)
consumers themselves, that are not fully taken into account when making consumption decisions.
1. Equity concerns
The first point – equity concerns – relates to the frequently asserted regressive nature of consumption taxes. Poorer households tend to spend a larger share of their income on consumption than wealthier households, who tend to have a higher savings rate. As a consequence, VAT payments disproportionally burden households at the bottom of the income distribution (European Commission, 2012). Taxing goods and services that are considered to cover basic needs, such as food, water or social housing, at a reduced rate aims to ease this burden. The reasoning is that, as wealthier households have more income left to spend on non-essential goods after fulfilling their basic needs, taxing non-essential goods at higher rates means that a larger share of the total tax revenue is being borne by higher income households. The reduced rates therefore work to redistribute purchasing power from richer to poorer households (IFS et al., 2011), softening the burden on the latter (note that introducing reduced rates on necessities make the VAT system more progressive, regardless of the ex-ante distributional impact of a VAT system). This notion is supported empirically: it has been shown that the regressive effect of consumption taxes varies considerably between countries, and that countries with similar levels of standard VAT rates can exhibit very different overall distributional effects of the VAT system (European Commission, 2012, O’Donoghue et al., 2004). For instance, Belgium and France have nearly the same standard VAT rate (21 % and 19.6 %, respectively), but the incorporation of consumption taxes into an assessment of disposable income inequality leaves the Gini Coefficient
20of Belgium nearly unchanged (it increases by less than 0.25 percentage points), while France’s Gini Coefficient increases by more than 3.3 percentage points (O’Donoghue et al., 2004).
The authors attribute this primarily to the share of goods and services that are exempt from VAT or taxed at a lower rate, and to the differences in savings rates across the income distribution (European Commission, 2012).
The VAT system is regressive when the analysis is based on VAT payments expressed in terms of (disposable) income. However, this conclusion no longer holds when the relationship between VAT payments and total expenditures is considered (IFS et al.,
20 The Gini Coefficient is a measure of income inequality that takes the value of 0 if income is distributed equally, and 1 if one household (or person) has all income in the economy. That is, a lower Gini Coefficient corresponds to a more equal income distribution.
2011). When looking at VAT payments as a percentage of total expenditure (as opposed to disposable income), Figari and Paulus (2012) conclude that for the five European countries they consider (Belgium, Greece, Ireland, Hungary and the UK), the VAT system does not seem to be regressive. Indeed, households in the richest disposable income decile pay a higher fraction of their total expenditure on VAT than households in the lowest income decile (because they spend a higher proportion of their expenditure on goods and services that are taxed at higher rates).
Richer households also pay more VAT in absolute terms (Crawford et al., 2010), and, since expenditures rise with income, also benefit more from VAT exemptions and reduced rates in absolute terms (IFS et al., 2011).
Furthermore, there exist other policy tools, such as means-tested transfers and income tax exemptions, which might be better suited to reach distributional objectives, because they can be more effectively targeted at low income households. Revenues generated by the abolition of reduced rates could be used to increase income related benefits to low income households (Crawford et al., 2010).
From a theoretical point of view, the main argument against using differentiated consumption taxes as a tool for redistribution is that if personal
preferences forconsumption do not directly depend on income (or the underlying ability determining income)
21, any information conveyed by individual consumption choices is also available in individual incomes. But redistributing income through the income tax is less costly in efficiency terms, because it does not distort individual consumption (Mankiw et al., 2009). That is, if the policy objective is to tax individuals based on their income, it is preferable to directly tax income, unless consumption choices reveal something about income that cannot be captured by personal income tax (e.g. there is significant tax evasion and underreporting that hinders the efficient collection of income tax, and consumption tax is less prone to evasion).
2221 It is important to distinguish preferences from demand, because demand will typically be influenced by a household’s budget constraint, and therefore household income.
22 Consider a country in which all high income individuals have a well-known proclivity for caviar, while all low-income individuals despise it, and personal income tax collection is problematic because of prevalent misrepresentation of income and fraud. In this country, consumption of caviar would convey information about income that income does not, because income is not correctly reported, and caviar consumption is a tell-tale sign of high income. If, on the other hand, income is observable, income can be taxed directly without distorting the caviar price; therefore, taxing caviar is not necessary.
2. Efficiency
A second reason for taxing some goods and services at a lower rate is to mitigate distortions that arise elsewhere in the tax system. This applies to labour intensive services that can be substituted by (tax-free) household production, such as household cleaning, minor repairs (Do-It-Yourself) or food preparation.
23Income tax and VAT generate a disparity between the market price of work and take-home pay; therefore, workers value hours worked less than the market does. Individuals might choose to perform tasks themselves (which is tax free) rather than to buy the same service on the market and work additional hours in their normal job (both of which are taxed), if the price of the service including taxes exceeds the take-home pay they would receive if they worked the time necessary to perform the task themselves. If the same services would have been purchased on the market in the absence of earnings and commodity taxation, the result is a welfare loss. Therefore, there is an economic case for taxing services that can be substituted by home production at a lower rate, because subsidising their consumption in fact counteracts inefficiencies caused by the tax system. But this argument in favour of differentiated VAT rates only applies to services that can reasonably be substituted by home-production (e.g. childcare services). Other labour intensive, though professionalised services (such as hairdressing), that are in fact eligible for a reduced VAT rate under EU law
24, are less suitable to be substituted by (untaxed) home production. Therefore, the case for taxing such services favourably is weak (IFS et al., 2011, Copenhagen Economics 2007).
Also, as IFS et al. (2011) observe, some goods and services that are presently eligible for a reduced VAT rate under EU law do not correspond well with the labour intensive services prone to substitution by home production. For example, basic food supplies that are taxed at a reduced rate in many countries should be seen as a substitute for work because they require preparation (and hence time input), whereas expenditure on restaurants, which are currently taxed at the standard rate in 15 Member States, generally rises with hours worked. Nonetheless, 12 Member States currently apply a reduced rate to restaurants.
23 Specifically, EU VAT law allows for reduced rates on minor repairs of bicycles, shoes, leather goods, clothing and household linen, renovation and repairs of private dwellings (excluding materials), domestic cleaning and cleaning of windows in private households, as well as restaurant services, in all Member States (IFS et al., 2011, pp. 539).
24 IFS et al., 2011, p. 540.
Another reason to tax labour intensive sectors at a lower rate is to promote employment in general by promoting products and services provided by low-skilled workers. This argument is not limited to sectors that are at risk to be substituted by home production, but products and services produced or provided primarily by lower skilled workers.
This argument relies on the assertion that structural unemployment by low skilled workers is at least partly due to restrictive labour market regulations, high minimum wages and non-wage labour costs that have disproportionally affected low skilled workers. Taxing sectors that primarily employ low skilled workers at favourable rates is therefore an adequate way to boost demand, drive up wages and increase employment in those sectors; while employment in other sectors characterised by a higher skilled workforce is not harmed to the same extent, because labour markets for higher skilled workers are more flexible, and therefore better able to adjust to changes in demand (Copenhagen Economics, 2007).
25This argument only applies if the joint design of labour market regulations, minimum wages and unemployment benefits is such that it creates structural unemployment to a markedly higher degree for low skilled than for higher skilled workers. If this is not the case, any reductions in low skilled unemployment will be matched by an increase in structural unemployment of highly skilled workers (due to a distortion of demand away from the goods and services that are primarily produced by them). In addition, favourable VAT treatment is unlikely to reduce structural unemployment if the targeted products or services are tradable, and the boost in demand will partly boost imports. Furthermore, differences in employment shares of low-skilled workers between sectors are actually rather modest (Copenhagen Economics, 2007), which implies that allowing VAT reductions to improve the employment prospects of low skilled workers is a poorly targeted policy measure.
3. Production/consumption externalities
A third reason why some products are taxed at reduced rates is that their consumption is deemed desirable in a way that is assumed not to be fully internalised by consumers.
For example, some goods may have positive production and/or consumption externalities to the wider society that are not fully taken into account by individual consumers, such as public transport or other environmentally friendly products. Other supplies may be more beneficial to the consumers than they themselves realise, such as
25 See also Report (COM(2003) 309) from the Commission on the experimental application of a reduced rate of VAT to certain labour-intensive services.
http://ec.europa.eu/taxation_customs/taxation/vat/how_vat_works/labour_intensive_services/ind ex_en.htm, [2013/06/30]
sports activities, books and other cultural or educational events, and should therefore be promoted through favourable VAT treatment. Also here, the question is whether a subsidy through the VAT rates system is the best policy to boost consumption of these goods and services. The first issue is that, because VAT is calculated as a fraction of the product price, reduced VAT rates provide a larger subsidy to more expensive products than to cheaper ones. Therefore, for reduced VAT rates to be a well-designed subsidy, the social benefit of a product needs to rise with its price. In many cases this would be hard to argue – why would it be desirable to subsidise first class train tickets more than second class train tickets, as the former reduce the trains capacity by more than the latter, driving up ticket prices? Why would one want to subsidise the hard cover version of a book by more than the soft cover version? Also, reduced VAT rates on such products can only incentivise consumers, not businesses, because VAT paid on immediate inputs can be deducted by most businesses. Therefore, subsidising environmentally friendly technology and the like through reduced VAT rates only encourages their use by private consumers, not businesses. Likewise, in this case, the problem of the VAT as a subsidy is that it cannot be specifically targeted at certain groups of consumers. For example, if under-consumption of books and other educational activities is seen as a problem for certain groups of people – e.g. young people or those on moderate incomes – significant subsidies may be enjoyed by those who already read aplenty. So, even if aggregate demand for books is higher because they are less burdened by VAT, it is not certain that the original problem is alleviated.
More targeted policies apart from reduced VAT rates – such as direct price subsidies for cultural or educational events for young people, or people on moderate incomes – are thinkable to reach the goal of boosting consumption of goods and services that are deemed desirable.
4. Conclusion
To sum up, whether zero and reduced VAT rates are the best means to achieve the goals they have been introduced for is questionable, although an economic case for a differentiated VAT rates structure does exist for some very specific goods and services (Copenhagen Economics, 2007). This already somewhat ambiguous case in support of zero and reduced rates is accompanied by adverse effects of the heterogeneous VAT rates structure in the EU: differentiated VAT rates distort consumption choices and can therefore decrease efficiency. Furthermore, the complexity of the current VAT system generates important compliance costs for businesses and may harm the functioning of the internal market by discouraging intra-EU trade (European Commission, 2011b).
The European Commission’s communication on the future of VAT (European
Commission, 2011b) therefore suggests a fundamental overhaul of the EU VAT structure towards a simpler, more unified design.
This study sets out to assess the likely effects of a change in the differentiated VAT structures that presently exist in the EU-27 Member States. It aims to inform policy makers about the likely risks and benefits of changes to this important source of revenue.
1.3
Tasks performed, reform scenarios and report outlineWe analyse the current VAT rates structure in 27 Member States of the European Union and calculate the distributional, revenue and macroeconomic effects of reforms of this structure. For this purpose we perform four tasks.
The first three tasks are purely static. We calculate the effects of three reform scenarios on VAT payments of households and non-household entities assuming no behavioural reactions.
Scenario 1: zero and reduced rates are abolished, and all goods and services that were taxed at these rates are now taxed at the standard rate applicable in each Member State.
Scenario 2: the abolition of zero and reduced rates is compensated by lowering the standard VAT rate to a level that makes the reform budget neutral for each Member State.
Scenario 3: zero and reduced rates are abolished, but households in the first and second (3a) or first (3b) income quintile (bottom 40 % or 20 % of the income distribution, respectively) are compensated for their (average) loss with lump sum transfers.
Task 1
For scenarios 1 and 2, we analyse how much, broken down by category of goods and services (12 expenditure categories following the COICOP
26classification), households pay on average in VAT in absolute terms and in relation to household expenditure.
We disaggregate these results by the following household characteristics:
activity status of the household head
26 Classification Of Individual COnsumption by Purpose; a description of categories can be found in the Annex (section A.2).
number of household members who are active in the labour force
income quintile
household type (single person household, single person household with dependent children etc.)
age of the household head.
Task 2
Broken down by categories of goods and services, we analyse how much the different types of non-taxable persons and taxable persons other than households, who carry out exempt activities, spend on VAT payments in the status quo and how much they would spend if zero and reduced rates were abolished.
Task 3
We provide an estimate of the additional revenues that would be generated if all zero and reduced rates were abolished and if low income households were compensated for their additional VAT payments, separately for 27 Member States and for the EU as a whole.
Task 4
We analyse the effects of an abolishment of zero and reduced rates on macroeconomic indicators using a computational general equilibrium (CGE) model of the European economy, WorldScan. WorldScan, as CGE models in general, is a complex model that incorporates all major parts of an economy (firms, households, and government), their interaction and their behavioural adjustments to external shocks. The results of WorldScan are medium-term and show the difference of the new equilibrium values of important macroeconomic indicators (GDP, consumption, employment, foreign trade) following an external shock (such as a change in effective VAT rates due to a change in the VAT rates structure) compared to the status quo.
Due to the conceptual differences to the analyses performed in tasks 1 to 3, the reform
scenarios analysed in task 4 are similar but not identical to those examined in the first
part.
Scenario A: Zero and reduced rates are raised to the level of the standard rate. The additional government revenues are channelled back into the economy according to the share of public spending (consumption and transfers).
27
Scenario B: Zero and reduced rates are abolished and the standard rate is replaced by a new rate that is calculated to be revenue neutral after behavioural response.
28
Scenario C: We would expect that the abolition of zero and reduced rates eases the administrative burden associated with VAT collection. The practicalities of tax collection (and any compliance or administrative costs to governments or firms) are not modelled in WorldScan. Hence, scenarios A and B do not take into account possible gains from a decreased administrative burden that could result from a simpler, uniform VAT rates structure. In scenario C, we therefore explore the economic effects of simplifying VAT compliance and administration.
Scenario D: In this scenario, the VAT increase of scenario A is compensated by a decrease in the capital-investment tax such that the reform is overall budget neutral.
Scenario E: This scenario simulates the same VAT increase as scenario A, but the additional tax revenues associated with the VAT increase are transferred to low- skilled unemployed and employed households.
This report is structured according to these four tasks. Tasks 1 to 3 are tackled in chapter 2. In section 2.1 we describe the data and procedures used in the analysis.
Section 2.2 gives a short introduction to the results for the EU-27 Member States.
Section 2.3 presents the analysis for private households, section 2.4 for non-household entities with non-refundable VAT liabilities on their intermediate consumption, section 2.5 presents the additional VAT revenues expected from reform scenarios 1 and 3.
Chapter 3 presents the methodology and discusses the results of the general equilibrium analysis performed to answer the questions of task 4. Chapter 4 concludes.
This report includes several annexes. Section A.1 contains the growth rates used to uprate the data for the household analysis to the reference year (2011). Section A.2 shows the COICOP classification, used for the break-down of household consumption expenditures. Section A.3 compares our results based on aggregate data to results of an analysis using micro data as a validation exercise. Section A.4 deals with goods and services that are eligible for zero and reduced VAT rates, while potentially being in
27 In WorldScan as in other CGE models the government cannot save or borrow money – all additional revenues are spent. As some of this additional spending is transferred to low-income households by an increase in transfers, scenario A is more comparable to scenario 3 than to scenario 1.
28 This new standard rate takes into account behavioural responses and therefore differs from the one calculated in scenario 2.