A study on the economic effects of the current VAT rates structure
Addendum: Country Analyses
TAXUD/2012/DE/323
FWC No. TAXUD/2010/CC/104
Client: European Commission, TAXUD
Institute for Advanced Studies (Project Leader)
CPB Netherlands Bureau for Economic Policy Analysis (Consortium Leader)
In consortium with:
CAPP CASE CEPII ETLA IFO IFS Vienna, 08 October 2013
TAXUD/2012/DE/323
CPB Netherlands Bureau for Economic Policy Analysis Van Stolkweg 14
P.O. Box 80510
2508 GM The Hague, the Netherlands
Telephone +31 70 338 33 80 Telefax +31 70 338 33 50 Internet www.cpb.nl
Study on VAT rates structure – Addendum
Contents
Preface ... 15
1 Belgium ... 17
1.1 VAT paid by private households ... 17
1.2 VAT paid by non-household entities ... 20
2 Bulgaria ... 22
2.1 VAT paid by private households ... 22
2.2 VAT paid by non-household entities ... 25
3 Czech Republic ... 27
3.1 VAT paid by private households ... 27
3.2 VAT paid by non-household entities ... 31
4 Denmark ... 33
4.1 VAT paid by private households ... 33
5 Germany ... 37
5.1 VAT paid by private households ... 37
5.2 VAT paid by non-household entities ... 40
6 Estonia ... 42
6.1 VAT paid by private households ... 42
6.2 VAT paid by non-household entities ... 45
7 Greece ... 47
7.1 VAT paid by private households ... 47
7.2 VAT paid by non-household entities ... 50
8 Spain ... 52
8.1 VAT paid by private households ... 52
8.2 VAT paid by non-household entities ... 56
9 France ... 58
9.1 VAT paid by private households ... 58
9.2 VAT paid by non-household entities ... 61
10 Ireland ... 63
10.1 VAT paid by private households ... 63
10.2 VAT paid by non-household entities ... 67
TAXUD/2012/DE/323
11 Italy ... 69
11.1 VAT paid by private households ... 69
11.2 VAT paid by non-household entities ... 73
12 Cyprus ... 75
12.1 VAT paid by private households ... 75
12.2 VAT paid by non-household entities ... 78
13 Latvia... 81
13.1 VAT paid by private households ... 81
13.2 VAT paid by non-household entities ... 84
14 Lithuania ... 86
14.1 VAT paid by private households ... 86
14.2 VAT paid by non-household entities ... 89
15 Luxembourg ... 91
15.1 VAT paid by private households ... 91
15.2 VAT paid by non-household entities ... 94
16 Hungary ... 97
16.1 VAT paid by private households ... 97
16.2 VAT paid by non-household entities ... 100
17 Malta ... 103
17.1 VAT paid by private households ... 103
17.2 VAT paid by non-household entities ... 106
18 Netherlands ... 109
18.1 VAT paid by private households ... 109
18.2 VAT paid by non-household entities ... 112
19 Austria ... 114
19.1 VAT paid by private households ... 114
19.2 VAT paid by non-household entities ... 117
20 Poland ... 120
20.1 VAT paid by private households ... 120
20.2 VAT paid by non-household entities ... 123
21 Portugal ... 125
21.1 VAT paid by private households ... 125
Study on VAT rates structure – Addendum
21.2 VAT paid by non-household entities ... 128
22 Romania ... 131
22.1 VAT paid by private households ... 131
22.2 VAT paid by non-household entities ... 134
23 Slovenia ... 136
23.1 VAT paid by private households ... 136
23.2 VAT paid by non-household entities ... 139
24 Slovakia ... 141
24.1 VAT paid by private households ... 141
24.2 VAT paid by non-household entities ... 144
25 Finland ... 146
25.1 VAT paid by private households ... 146
25.2 VAT paid by non-household entities ... 149
26 Sweden... 151
26.1 VAT paid by private households ... 151
26.2 VAT paid by non-household entities ... 155
27 United Kingdom ... 157
27.1 VAT paid by private households ... 157
27.2 VAT paid by non-household entities ... 161
28 A short guide for the use of the result spreadsheets (Estonia)163 29 Assumptions for VAT Rates Application ... 164
TAXUD/2012/DE/323
List of Tables
Table 1: Belgium – average VAT rates for private households broken down by
categories of goods and services according to COICOP ... 17 Table 2: Belgium – average VAT paid in Euros and as share of total expenditure,
ranked by amount... 18 Table 3: Belgium – average VAT bill of private households as a proportion of
expenditure and in Euros per year, by income quintile... 19 Table 4: Belgium – average VAT bill of private households as a proportion of
expenditure and in Euros per year, separately for households with and without active members ... 19 Table 5: Belgium – average VAT bill of private households as a proportion of
expenditure and in Euros per year, by household type ... 20 Table 6: Belgium – scenario 1: main product composition, non-households ... 21 Table 7: Bulgaria – average VAT rates for private households broken down by
categories of goods and services according to COICOP ... 22 Table 8: Bulgaria – average VAT paid in Euros and as share of total expenditure,
ranked by amount... 23 Table 9: Bulgaria – average VAT bill of private households as a proportion of
expenditure and in Euros per year, by income quintile... 24 Table 10: Bulgaria – average VAT bill of private households as a proportion of
expenditure and in Euros per year, separately for households with and without active members ... 24 Table 11: Bulgaria – average VAT bill of private households as a proportion of
expenditure and in Euros per year, by household type ... 25 Table 12: Bulgaria – scenario 1: main product composition, non-households ... 26 Table 13: Czech Republic – average VAT rates for private households broken down by
categories of goods and services according to COICOP ... 28 Table 14: Czech Republic – average VAT paid in Euros and as share of total
expenditure, ranked by amount ... 29 Table 15: Czech Republic – average VAT bill of private households as a proportion of
expenditure and in Euros per year, by income quintile... 29 Table 16: Czech Republic – average VAT bill of private households as a proportion of
expenditure and in Euros per year, separately for households with and without active members ... 30 Table 17: Czech Republic – average VAT bill of private households as a proportion of
expenditure and in Euros per year, by household type ... 31 Table 18: Czech Republic – scenario 1: main product composition, non-households ... 32 Table 19: Denmark – average VAT rates for private households broken down by
categories of goods and services according to COICOP ... 33
Study on VAT rates structure – Addendum Table 20: Denmark – average VAT paid in Euros and as share of total expenditure,
ranked by amount... 34 Table 21: Denmark – average VAT bill of private households as a proportion of
expenditure and in Euros per year, by income quintile... 35 Table 22 Denmark – average VAT bill of private households as a proportion of
expenditure and in Euros per year, separately for households with and without active members ... 35 Table 23: Denmark – average VAT bill of private households as a proportion of
expenditure and in Euros per year, by household type ... 36 Table 24: Germany – average VAT rates for private households broken down by
categories of goods and services according to COICOP ... 37 Table 25: Germany – average VAT paid in Euros and as share of total expenditure,
ranked by amount... 38 Table 26: Germany – average VAT bill of private households as a proportion of
expenditure and in Euros per year, by income quintile... 39 Table 27 Germany – average VAT bill of private households as a proportion of
expenditure and in Euros per year, separately for households with and without active members ... 39 Table 28 Germany – average VAT bill of private households as a proportion of
expenditure and in Euros per year, by household type ... 40 Table 29: Germany – scenario 1: main product composition, non-households ... 41 Table 30: Estonia – average VAT rates for private households broken down by
categories of goods and services according to COICOP ... 42 Table 31: Estonia – average VAT paid in Euros and as share of total expenditure,
ranked by amount... 43 Table 32: Estonia – average VAT bill of private households as a proportion of
expenditure and in Euros per year, by income quintile... 44 Table 33 Estonia – average VAT bill of private households as a proportion of
expenditure and in Euros per year, separately for households with and without active members ... 44 Table 34 Estonia – average VAT bill of private households as a proportion of
expenditure and in Euros per year, by household type ... 45 Table 35: Estonia – scenario 1: main product composition, non-households ... 46 Table 36: Greece – average VAT rates for private households broken down by
categories of goods and services according to COICOP ... 47 Table 37: Greece – average VAT paid in Euros and as share of total expenditure,
ranked by amount... 48 Table 38: Greece – average VAT bill of private households as a proportion of
expenditure and in Euros per year, by income quintile... 49 Table 39: Greece – average VAT bill of private households as a proportion of
expenditure and in Euros per year, separately for households with and without active members ... 49
TAXUD/2012/DE/323
Table 40: Greece – average VAT bill of private households as a proportion of
expenditure and in Euros per year, by household type ... 50 Table 41: Greece – scenario 1: main product composition, non-households ... 51 Table 42: Spain – average VAT rates for private households broken down by categories of goods and services according to COICOP ... 53 Table 43: Spain – average VAT paid in Euros and as share of total expenditure, ranked
by amount ... 54 Table 44: Spain – average VAT bill of private households as a proportion of
expenditure and in Euros per year, by income quintile... 54 Table 45: Spain – average VAT bill of private households as a proportion of
expenditure and in Euros per year, separately for households with and without active members ... 55 Table 46: Spain – average VAT bill of private households as a proportion of
expenditure and in Euros per year, by household type ... 56 Table 47: Spain – scenario 1: main product composition, non-households ... 57 Table 48: France – average VAT rates for private households broken down by
categories of goods and services according to COICOP ... 58 Table 49: France – average VAT paid in Euros and as share of total expenditure, ranked by amount ... 59 Table 50: France – average VAT bill of private households as a proportion of
expenditure and in Euros per year, by income quintile... 60 Table 51: France – average VAT bill of private households as a proportion of
expenditure and in Euros per year, separately for households with and without active members ... 60 Table 52: France – average VAT bill of private households as a proportion of
expenditure and in Euros per year, by household type ... 61 Table 53: France – scenario 1: main product composition, non-households ... 62 Table 54: Ireland – average VAT rates for private households broken down by
categories of goods and services according to COICOP ... 64 Table 55: Ireland – average VAT paid in Euros and as share of total expenditure,
ranked by amount... 65 Table 56: Ireland – average VAT bill of private households as a proportion of
expenditure and in Euros per year, by income quintile... 65 Table 57: Ireland – average VAT bill of private households as a proportion of
expenditure and in Euros per year, separately for households with and without active members ... 66 Table 58: Ireland – average VAT bill of private households as a proportion of
expenditure and in Euros per year, by household type ... 66 Table 59: Ireland – scenario 1: main product composition, non-households ... 68 Table 60: Italy – average VAT rates for private households broken down by categories
of goods and services according to COICOP ... 69
Study on VAT rates structure – Addendum Table 61: Italy – average VAT paid in Euros and as share of total expenditure, ranked
by amount ... 70 Table 62: Italy – average VAT bill of private households as a proportion of expenditure and in Euros per year, by income quintile ... 71 Table 63: Italy – average VAT bill of private households as a proportion of expenditure
and in Euros per year, separately for households with and without active
members ... 72 Table 64: Italy – average VAT bill of private households as a proportion of expenditure and in Euros per year, by household type ... 72 Table 65: Italy – scenario 1: main product composition, non-households ... 74 Table 66: Cyprus – average VAT rates for private households broken down by
categories of goods and services according to COICOP ... 75 Table 67: Cyprus – average VAT paid in Euros and as share of total expenditure,
ranked by amount... 76 Table 68: Cyprus – average VAT bill of private households as a proportion of
expenditure and in Euros per year, by income quintile... 77 Table 69: Cyprus – average VAT bill of private households as a proportion of
expenditure and in Euros per year, separately for households with and without active members ... 78 Table 70: Cyprus – average VAT bill of private households as a proportion of
expenditure and in Euros per year, by household type ... 78 Table 71: Cyprus – scenario 1: main product composition, non-households ... 80 Table 72: Latvia – average VAT rates for private households broken down by
categories of goods and services according to COICOP ... 81 Table 73: Latvia – average VAT paid in Euros and as share of total expenditure, ranked
by amount ... 82 Table 74: Latvia – average VAT bill of private households as a proportion of
expenditure and in Euros per year, by income quintile... 83 Table 75: Latvia – average VAT bill of private households as a proportion of
expenditure and in Euros per year, separately for households with and without active members ... 83 Table 76: Latvia – average VAT bill of private households as a proportion of
expenditure and in Euros per year, by household type ... 84 Table 77: Latvia – scenario 1: main product composition, non-households ... 85 Table 78: Lithuania – average VAT rates for private households broken down by
categories of goods and services according to COICOP ... 86 Table 79: Lithuania – average VAT paid in Euros and as share of total expenditure,
ranked by amount... 87 Table 80: Lithuania – average VAT bill of private households as a proportion of
expenditure and in Euros per year, by income quintile... 88
TAXUD/2012/DE/323
Table 81: Lithuania – average VAT bill of private households as a proportion of expenditure and in Euros per year, separately for households with and without active members ... 88 Table 82: Lithuania – average VAT bill of private households as a proportion of
expenditure and in Euros per year, by household type ... 89 Table 83: Lithuania – scenario 1: main product composition, non-households ... 90 Table 84: Luxembourg – average VAT rates for private households broken down by
categories of goods and services according to COICOP ... 92 Table 85: Luxembourg – average VAT paid in Euros and as share of total expenditure,
ranked by amount... 92 Table 86: Luxembourg – average VAT bill of private households as a proportion of
expenditure and in Euros per year, by income quintile... 93 Table 87: Luxembourg – average VAT bill of private households as a proportion of
expenditure and in Euros per year, separately for households with and without active members ... 94 Table 88: Luxembourg – average VAT bill of private households as a proportion of
expenditure and in Euros per year, by household type ... 94 Table 89: Luxembourg – scenario 1: main product composition, non-households ... 96 Table 90: Hungary – average VAT rates for private households broken down by
categories of goods and services according to COICOP ... 97 Table 91: Hungary – average VAT paid in Euros and as share of total expenditure,
ranked by amount... 98 Table 92: Hungary – average VAT bill of private households as a proportion of
expenditure and in Euros per year, by income quintile... 99 Table 93 Hungary – average VAT bill of private households as a proportion of
expenditure and in Euros per year, separately for households with and without active members ... 100 Table 94: Hungary – average VAT bill of private households as a proportion of
expenditure and in Euros per year, by household type ... 100 Table 95: Hungary – scenario 1: main product composition, non-households ... 102 Table 96: Malta – average VAT rates for private households broken down by categories of goods and services according to COICOP ... 103 Table 97: Malta – average VAT paid in Euros and as share of total expenditure, ranked
by amount ... 104 Table 98: Malta – average VAT bill of private households as a proportion of
expenditure and in Euros per year, by income quintile... 105 Table 99: Malta – average VAT bill of private households as a proportion of
expenditure and in Euros per year, separately for households with and without active members ... 106 Table 100: Malta – average VAT bill of private households as a proportion of
expenditure and in Euros per year, by household type ... 106 Table 101: Malta – scenario 1: main product composition, non-households ... 108
Study on VAT rates structure – Addendum Table 102: Netherlands – average VAT rates for private households broken down by
categories of goods and services according to COICOP ... 109 Table 103: Netherlands – average VAT paid in Euros and as share of total expenditure,
ranked by amount... 110 Table 104: Netherlands – average VAT bill of private households as a proportion of
expenditure and in Euros per year, by income quintile... 111 Table 105: Netherlands – average VAT bill of private households as a proportion of
expenditure and in Euros per year, separately for households with and without an active head ... 111 Table 106: Netherlands – scenario 1: main product composition, non-households ... 113 Table 107: Austria – average VAT rates for private households broken down by
categories of goods and services according to COICOP ... 114 Table 108: Austria – average VAT paid in Euros and as share of total expenditure,
ranked by amount... 115 Table 109: Austria – average VAT bill of private households as a proportion of
expenditure and in Euros per year, by income quintile... 116 Table 110 Austria – average VAT bill of private households as a proportion of
expenditure and in Euros per year, separately for households with and without active members ... 117 Table 111 Austria – average VAT bill of private households as a proportion of
expenditure and in Euros per year, by household type ... 117 Table 112: Austria – scenario 1: main product composition, non-households ... 119 Table 113: Poland – average VAT rates for private households broken down by
categories of goods and services according to COICOP ... 120 Table 114: Poland – average VAT paid in Euros and as share of total expenditure,
ranked by amount... 121 Table 115: Poland – average VAT bill of private households as a proportion of
expenditure and in Euros per year, by income quintile... 122 Table 116: Poland – average VAT bill of private households as a proportion of
expenditure and in Euros per year, separately for households with and without active members ... 122 Table 117: Poland – average VAT bill of private households as a proportion of
expenditure and in Euros per year, by household type ... 123 Table 118: Poland – scenario 1: main product composition, non-households ... 124 Table 119: Portugal – average VAT rates for private households broken down by
categories of goods and services according to COICOP ... 126 Table 120: Portugal – average VAT paid in Euros and as share of total expenditure,
ranked by amount... 126 Table 121: Portugal – average VAT bill of private households as a proportion of
expenditure and in Euros per year, by income quintile... 127
TAXUD/2012/DE/323
Table 122: Portugal – average VAT bill of private households as a proportion of expenditure and in Euros per year, separately for households with and without active members ... 128 Table 123: Portugal – average VAT bill of private households as a proportion of
expenditure and in Euros per year, by household type ... 128 Table 124: Portugal – scenario 1: main product composition, non-households... 130 Table 125: Romania – average VAT rates for private households broken down by
categories of goods and services according to COICOP ... 131 Table 126: Romania – average VAT paid in Euros and as share of total expenditure,
ranked by amount... 132 Table 127: Romania – average VAT bill of private households as a proportion of
expenditure and in Euros per year, by income quintile... 133 Table 128: Romania – average VAT bill of private households as a proportion of
expenditure and in Euros per year, separately for households with and without active members ... 133 Table 129: Romania – average VAT bill of private households as a proportion of
expenditure and in Euros per year, by household type ... 134 Table 130: Romania – scenario 1: main product composition, non-households ... 135 Table 131: Slovenia – average VAT rates for private households broken down by
categories of goods and services according to COICOP ... 137 Table 132: Slovenia – average VAT paid in Euros and as share of total expenditure,
ranked by amount... 137 Table 133: Slovenia – average VAT bill of private households as a proportion of
expenditure and in Euros per year, by income quintile... 138 Table 134: Slovenia – average VAT bill of private households as a proportion of
expenditure and in Euros per year, separately for households with and without active members ... 139 Table 135: Slovenia – scenario 1: main product composition, non-households ... 140 Table 136: Slovakia – average VAT rates for private households broken down by
categories of goods and services according to COICOP ... 141 Table 137: Slovakia – average VAT paid in Euros and as share of total expenditure,
ranked by amount... 142 Table 138: Slovakia – average VAT bill of private households as a proportion of
expenditure and in Euros per year, by income quintile... 142 Table 139: Slovakia – average VAT bill of private households as a proportion of
expenditure and in Euros per year, separately for households with and without active members ... 143 Table 140: Slovakia – average VAT bill of private households as a proportion of
expenditure and in Euros per year, by household type ... 143 Table 141: Slovakia – scenario 1: main product composition, non-households ... 145 Table 142: Finland – average VAT rates for private households broken down by
categories of goods and services according to COICOP ... 146
Study on VAT rates structure – Addendum Table 143: Finland – average VAT paid in Euros and as share of total expenditure,
ranked by amount... 147 Table 144: Finland – average VAT bill of private households as a proportion of
expenditure and in Euros per year, by income quintile... 148 Table 145 Finland – average VAT bill of private households as a proportion of
expenditure and in Euros per year, separately for households with and without active members ... 148 Table 146 Finland – average VAT bill of private households as a proportion of
expenditure and in Euros per year, by household type ... 149 Table 147: Finland – scenario 1: main product composition, non-households ... 150 Table 148: Sweden – average VAT rates for private households broken down by
categories of goods and services according to COICOP ... 152 Table 149: Sweden – average VAT paid in Euros and as share of total expenditure,
ranked by amount... 153 Table 150: Sweden – average VAT bill of private households as a proportion of
expenditure and in Euros per year, by income quintile... 153 Table 151 Sweden – average VAT bill of private households as a proportion of
expenditure and in Euros per year, separately for households with and without active members ... 154 Table 152: Sweden – average VAT bill of private households as a proportion of
expenditure and in Euros per year, by household type ... 154 Table 153: Sweden – scenario 1: main product composition, non-households ... 156 Table 154: United Kingdom – average VAT rates for private households broken down
by categories of goods and services according to COICOP ... 157 Table 155: United Kingdom – average VAT paid in Euros and as share of total
expenditure, ranked by amount ... 158 Table 156: United Kingdom – average VAT bill of private households as a proportion
of expenditure and in Euros per year, by income quintile ... 159 Table 157: United Kingdom – average VAT bill of private households as a proportion
of expenditure and in Euros per year, separately for households with and without active members ... 160 Table 158: United Kingdom – average VAT bill of private households as a proportion
of expenditure and in Euros per year, by household type ... 160 Table 159: United Kingdom – scenario 1: main product composition, non-households
... 162
TAXUD/2012/DE/323
Study on VAT rates structure – Addendum
Preface
Supplementing the main report, this addendum provides more detailed analysis of the effects of the VAT rates structure on households and non-household entities for each country. The 27 country chapters complement the respective sections of the main report. In addition, chapter 28 contains guidance on how the spreadsheets delivered with this report should be read. These spreadsheets contain additional tables on the household analysis. Chapter 29 lists the assumptions we made concerning the mapping of VAT rates to COICOP categories in the household analysis.
TAXUD/2012/DE/323
Study on VAT rates structure – Addendum
1 Belgium
Belgium applies a standard rate of 21 %, two reduced rates of 6 % and 12 %, respectively, a parking rate of 12 %, and a zero rate. The zero rate applies to supplies of daily and weekly newspapers of general interest. The reduced rate of 6 % applies to the supply of certain foodstuffs, non-alcoholic beverages, water, firewood and heat energy, some pharmaceutical products, medical products, therapeutic appliances, domestic passenger transport, plants and flowers, recreational and cultural services, some newspapers and periodicals and accommodation services. The reduced rate of 12 % applies to some oils and fats and to food consumed in restaurants or cafés, whereas the parking rate applies to some solid fuels (such as coal, coke or peats) and to tyres and inner tubes.
1.1 VAT paid by private households
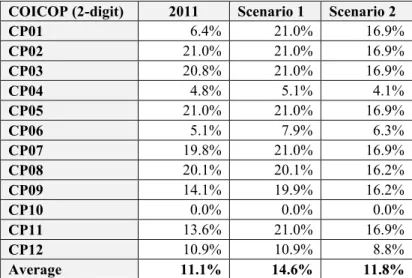
Table 1: Belgium – average VAT rates for private households broken down by categories of goods and services according to COICOP
COICOP (2-digit) 2011 Scenario 1 Scenario 2
CP01 6.4% 21.0% 16.9%
CP02 21.0% 21.0% 16.9%
CP03 20.8% 21.0% 16.9%
CP04 4.8% 5.1% 4.1%
CP05 21.0% 21.0% 16.9%
CP06 5.1% 7.9% 6.3%
CP07 19.8% 21.0% 16.9%
CP08 20.1% 20.1% 16.2%
CP09 14.1% 19.9% 16.2%
CP10 0.0% 0.0% 0.0%
CP11 13.6% 21.0% 16.9%
CP12 10.9% 10.9% 8.8%
Average 11.1% 14.6% 11.8%
Source: Household Budget Surveys, National Accounts (Eurostat), own calculations.
New standard rate in scenario 2: 16.9 %.
Taking into account all deviations from the standard rate, the average VAT rate in Belgium (according to HBS data) is 11.1 %. Belgium’s VAT regime is very heterogeneous with many goods and services being taxed at one of the two reduced rates, the parking rate or the zero rate. Therefore, abolishing these reduced rates
TAXUD/2012/DE/323
(scenario 1) leads to quite substantial changes as compared to the situation in 2011. But also scenario 2, a reform that is revenue neutral when all contributors to VAT are taken into account, leads to a higher VAT burden of private households.
Table 2: Belgium – average VAT paid in Euros and as share of total expenditure, ranked by amount
2011 VAT payments Scenario 1 VAT payments
COICOP (2-digit) in % in € COICOP (2-digit) in % in €
CP07 2.2% 815 CP01 2.6% 991
CP12 1.2% 454 CP07 2.3% 866
CP04 1.2% 433 CP09 1.6% 600
CP09 1.1% 424 CP04 1.2% 465
CP05 0.9% 354 CP12 1.2% 454
CP03 0.8% 304 CP11 1.2% 450
CP01 0.8% 304 CP05 0.9% 354
CP11 0.8% 292 CP03 0.8% 308
CP08 0.4% 136 CP06 0.4% 137
CP02 0.4% 131 CP08 0.4% 136
CP06 0.2% 88 CP02 0.3% 131
CP10 0.0% 0 CP10 0.0% 0
Sum 10.0% 3,735 Sum 12.7% 4,892
Source: Household Budget Surveys, National Accounts (Eurostat), own calculations.
Table 2 illustrates average VAT paid by households broken down by COICOP categories in 2011. From the table we can see that category CP07 “Transport” accounts for the largest share of VAT payments1, followed by CP12 “Miscellaneous goods and services” and CP04 “Housing, water, electricity, gas and other fuels”. The composition of VAT payments changes considerably in scenarios 1 and 2, with no single category (except for education) ranked the same as in 2011: In the scenarios without zero and reduced rates category CP01 “Food and non-alcoholic beverages” accounts for the biggest share of VAT payments.
1 VAT on transport is mainly paid for CP072 “Operation of personal transport equipment” (59 %), followed by CP071 “Purchase of vehicles” (39 %).
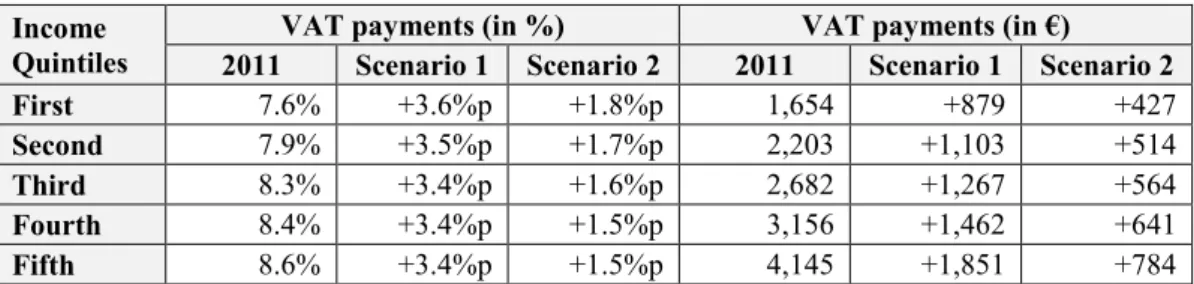
Study on VAT rates structure – Addendum Table 3: Belgium – average VAT bill of private households as a proportion of expenditure and in Euros per year, by income quintile
Income Quintiles
VAT payments (in %) VAT payments (in €)
2011 Scenario 1 Scenario 2 2011 Scenario 1 Scenario 2
First 8.8% +2.9%p +0.9%p 2,061 +780 +228
Second 9.3% +2.8%p +0.7%p 2,889 +1,003 +248
Third 9.7% +2.8%p +0.6%p 3,567 +1,159 +242
Fourth 10.2% +2.8%p +0.5%p 4,303 +1,349 +253
Fifth 11.1% +2.4%p +0.1%p 5,850 +1,487 +62
Source: Household Budget Surveys, National Accounts (Eurostat), own calculations.
New standard rate in scenario 2: 16.9 %.
Table 3 shows VAT payments in 2011 and in both reform scenarios disaggregated by income quintile. The share of VAT payments in total expenditure varies with income:
The fifth quintile has the highest and the first quintile the lowest VAT payments as a share of expenditure, at 11.1 % and 8.8 % respectively. The absolute amount paid in VAT increases with income, with the fifth quintile paying more than 2.8 times as much VAT as the first quintile. Abolishing the zero and reduced rates (scenario 1) has a substantial effect on the financial burden households face, as the categories taxed at reduced rates form a large part of total household expenditure. In absolute terms the effect is higher for high-income households, whose VAT bill increases by € 1,487. As a fraction of expenditures low-income households suffer more, facing an increase of 2.9 percentage points. Nonetheless, the VAT rates structure remains progressive, in that it imposes a lower burden in relative and absolute values on low income households.
Scenario 2 yields higher VAT bills for all income groups, the relative change being highest for low income households, the absolute change being highest for the fourth quintile, followed by the second and third. Again, although to a lesser extent, the VAT rates structure remains progressive.
Table 4: Belgium – average VAT bill of private households as a proportion of expenditure and in Euros per year, separately for households with and without active members Activity
status
VAT payments (in %) VAT payments (in €)
2011 Scenario 1 Scenario 2 2011 Scenario 1 Scenario 2
Active 10.2% +2.7%p +0.6%p 4,442 +1,368 +240
Non-active 9.2% +2.8%p +0.7%p 2,596 +890 +213
Source: Household Budget Surveys, National Accounts (Eurostat), own calculations.
New standard rate in scenario 2: 16.9 %.
TAXUD/2012/DE/323
Breaking down the results by the number of active household members, we find that the current VAT regime favours households without active members. VAT as a share of total expenditure is 1 percentage point lower for them than for households with active members. Scenario 1 leads to an increase in VAT payments that is higher for active households in absolute terms and about the same for both groups as a fraction of expenditure. The same applies to scenario 2.
Table 5: Belgium – average VAT bill of private households as a proportion of expenditure and in Euros per year, by household type
Household Size
VAT payments (in %) VAT payments (in €)
2011 Scenario 1 Scenario 2 2011 Scenario 1 Scenario 2
Single 9.4% +2.4%p +0.4%p 2,258 +662 +96
Single + 9.5% +2.7%p +0.5%p 2,893 +928 +187
Multi 9.9% +2.8%p +0.6%p 3,919 +1,266 +259
Multi + 10.3% +2.8%p +0.5%p 5,211 +1,634 +304
Source: Household Budget Surveys, National Accounts (Eurostat), own calculations.
New standard rate in scenario 2: 16.9 %.
“+” indicates a household with dependent children
Table 5 summarises the effects of the two reform scenarios on different types of households, single and multi-adult, with and without children. As a proportion of expenditure single households pay the least VAT, multi-adult households with children the most. Abolishing zero and reduced rates leads to higher increases for multi-adult households, in absolute terms and in proportion to expenditure. Scenario 2 has quite similar effects on all four groups as a fraction of expenditure.
1.2 VAT paid by non-household entities
As shown in the main report, in Belgium, scenario 1 leads to an overall increase in VAT liability of 24 % (corresponding to 2.0 % of GDP). For sectors which are VAT exempt, this translates into an increase of 23 %, while for the category “Others” the increase is 20 %. Table 6 shows the five categories of goods and services that, taken together, make up the largest share of the expenditure of the sectors Intermediate Consumption, Government Consumption and NPISHs. In the case of Belgium, these are: Construction, Manufacture of chemicals and chemical products, Recreational, cultural and sporting activities, Land transport, transport via pipelines, and Other business activities. The table documents the change in the liability associated with the various goods and services, as well as the percentage share of each good in the total VAT bill of the sector in question.
TAXUD/2012/DE/323
Table 6: Belgium – scenario 1: main product composition, non-households
Product Construction Manufacture of
chemicals and chemical products
Recreational, cultural and sporting activities
Land transport;
transport via pipelines
Other business
activities Other products Total increase
in million € Sector
Increase in million €
Share in VAT by sector
Increase in million €
Share in VAT by sector
Increase in million €
Share in VAT by sector
Increase in million €
Share in VAT by sector
Increase in million €
Share in VAT by sector
Increase in million €
Share in VAT by sector Post and
Telecommunications 0 0% 0 0% 0 0% 1 1% 1 20% 2 44% 4
Real Estate Activities 490 24% 1 0% 1 0% 5 0% 17 31% 24 8% 536
Financial Intermediation 0 0% 0 0% 7 0% 13 0% 41 49% 27 15% 89
Public Admin and Defence;
Compulsory Social Security 74 3% 9 2% 13 1% 15 1% 19 26% 85 13% 216
Education 22 3% 3 3% 2 0% 3 0% 4 21% 27 17% 60
Health and Social Work 36 1% 199 32% 0 0% 6 0% 21 23% 179 18% 441
Other Community, Social
and Personal Services 16 2% 5 3% 67 8% 6 1% 7 30% 23 14% 124
Other sectors 2 0% 2 1% 7 1% 8 1% 22 71% 15 7% 58
Government final
consumption 0 0% 126 0% 196 0% 201 0% 0 0% 19 0% 542
NPISH 0 0% 0 0% 23 0% 0 0% 0 0% 0 0% 23
Total increase by product 640 345 317 258 131 403
% increase in VAT liability
by product 207% 37% 190% 207% 6% 42%
Source: WIOD, EUROSTAT, IBFD, European Commission, Own Submissions and own calculations.
Note: Differences in totals may occur due to rounding
Study on VAT rates structure – Addendum
2 Bulgaria
The standard VAT rate in Bulgaria is 20 % and there is one reduced rate of 9 %, however, the latter affects only the supply of accommodation services.2 In addition to the supplies listed in section 2.1 in the main report, the supply of cultural, recreational and sporting services is exempted from VAT if they are provided by a public body.
2.1 VAT paid by private households
Taking into account all deviations from the standard rate, the average VAT rate in Bulgaria is 14.8 %.
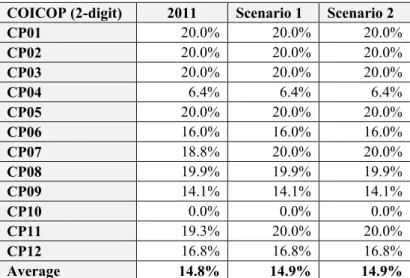
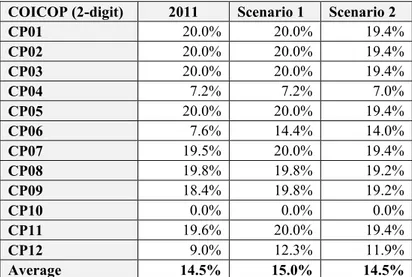
Table 7: Bulgaria – average VAT rates for private households broken down by categories of goods and services according to COICOP
COICOP (2-digit) 2011 Scenario 1 Scenario 2
CP01 20.0% 20.0% 20.0%
CP02 20.0% 20.0% 20.0%
CP03 20.0% 20.0% 20.0%
CP04 6.4% 6.4% 6.4%
CP05 20.0% 20.0% 20.0%
CP06 16.0% 16.0% 16.0%
CP07 18.8% 20.0% 20.0%
CP08 19.9% 19.9% 19.9%
CP09 14.1% 14.1% 14.1%
CP10 0.0% 0.0% 0.0%
CP11 19.3% 20.0% 20.0%
CP12 16.8% 16.8% 16.8%
Average 14.8% 14.9% 14.9%
Source: Household Budget Surveys, National Accounts (Eurostat), own calculations.
New standard rate in scenario 2: 20.0 %.
Exchange rate of 1.956 Leva to 1 Euro.
Abolishing the reduced rate has little effect on this average VAT rate, in scenario 1 it changes marginally to 14.9 %. Scenario 2 stipulates the abolition of the reduced rate, and a new standard rate such that the reform rate is budget neutral. In the case of
2 The reduced rate for accommodation services was 7 % in the beginning of 2011, in May it was increased to 9 %. We used a weighted average of 8.5 % for the analysis.
Study on VAT rates structure – Addendum Bulgaria, the standard rate of 20 % changes only marginally to 19.96 %3. Given the Bulgarian VAT rates structure and the average VAT rates shown above, it is easy to see that abolishing the reduced rate will not greatly impact households’ VAT payments. We nevertheless show the relevant tables, but concentrate the analysis on the situation in 2011.
Table 8: Bulgaria – average VAT paid in Euros and as share of total expenditure, ranked by amount
2011 VAT payments Scenario 1 VAT payments
COICOP (2-digit) in % in € COICOP (2-digit) in % in €
CP01 4.7% 232 CP01 4.7% 232
CP04 1.8% 90 CP04 1.8% 90
CP02 1.2% 62 CP02 1.2% 62
CP05 1.0% 48 CP05 1.0% 48
CP07 0.8% 38 CP07 0.8% 40
CP08 0.7% 36 CP08 0.7% 36
CP06 0.6% 32 CP06 0.6% 32
CP12 0.6% 29 CP12 0.6% 29
CP03 0.5% 24 CP03 0.5% 24
CP09 0.5% 27 CP09 0.5% 27
CP11 0.4% 21 CP11 0.4% 21
CP10 0.0% 0 CP10 0.0% 0
Sum 12.9% 639 Sum 12.9% 642
Source: Household Budget Surveys, National Accounts (Eurostat), own calculations.
Exchange rate of 1.956 Leva to 1 Euro.
Table 8 illustrates average VAT bills of households according to COICOP category in 2011. With 36 % of all VAT payments, the category CP01 “Food and non-alcoholic beverages” accounts for the biggest share, followed by “Housing, water, electricity, gas and other fuels” (CP04) with 14 % and “Alcohol and tobacco” (CP02) with 10 %.
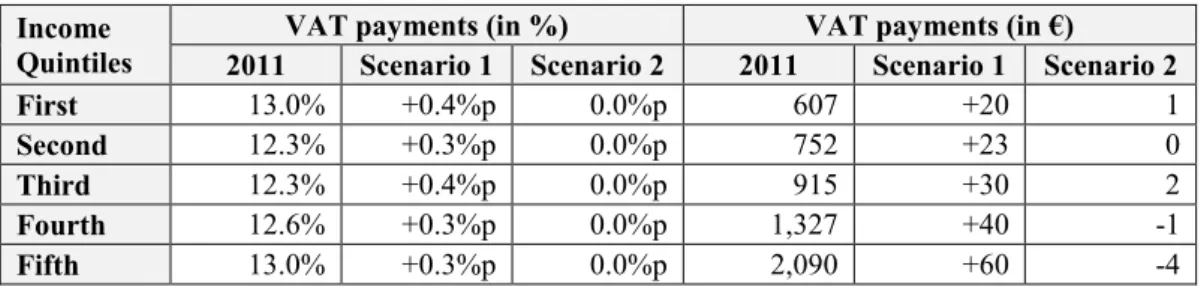
Table 9 shows VAT payments broken down by income quintile. The share of VAT payments in relation to total expenditure ranges from 12.6 % for the third quintile to 13.2 % for the poorest quintile. In absolute values, the 20 % richest households pay about 3 times as much VAT as the 20 % poorest households. Abolishing the reduced rate for accommodation services (scenario 1) and introducing a budget neutral VAT rate (scenario 2) have negligible effects on the financial burden of households, as
3 As we use only one digit for the new standard rate in scenario 2, no change occurs for private households.
TAXUD/2012/DE/323
accommodation services only account for a small part of total household expenditure and the budget neutral VAT rate is the same as the existing standard rate.
Table 9: Bulgaria – average VAT bill of private households as a proportion of expenditure and in Euros per year, by income quintile
Income Quintiles
VAT payments (in %) VAT payments (in €)
2011 Scenario 1 Scenario 2 2011 Scenario 1 Scenario 2
First 13.2% +0.0%p +0.0%p 342 +1 +1
Second 13.1% +0.0%p +0.0%p 490 +2 +2
Third 12.6% +0.1%p +0.1%p 604 +3 +3
Fourth 12.7% +0.1%p +0.1%p 729 +4 +4
Fifth 12.9% +0.1%p +0.1%p 1,030 +6 +6
Source: Household Budget Surveys, National Accounts (Eurostat), own calculations.
New standard rate in scenario 2: 20.0 %.
Exchange rate of 1.956 Leva to 1 Euro.
Table 10: Bulgaria – average VAT bill of private households as a proportion of expenditure and in Euros per year, separately for households with and without active members
Activity status
VAT payments (in %) VAT payments (in €)
2011 Scenario 1 Scenario 2 2011 Scenario 1 Scenario 2
Active 13.3% +0.1%p +0.1%p 806 +4 +4
Non-active 12.0% +0.0%p +0.0%p 395 +1 +1
Source: Household Budget Surveys, National Accounts (Eurostat), own calculations.
New standard rate in scenario 2: 20.0 %.
Exchange rate of 1.956 Leva to 1 Euro.
Broken down according to the number of active household members (Table 10), we find that on average, households with active members pay more VAT than households without active members (13.3 % of expenditures compared to 12 %). Comparing household types (Table 5) we find that the VAT burden is highest in multi-adult households with children (13.6 % of expenditures) and lowest in single households without children (11.1 %).
We find that, although almost no reductions apply, VAT payments are not equally distributed across household types. Exemptions, especially for rents, are responsible for this pattern: Single households and households without active members spend much more of their expenditures on the category CP04, especially on rents.
Study on VAT rates structure – Addendum Table 11: Bulgaria – average VAT bill of private households as a proportion of expenditure and in Euros per year, by household type
Household Size
VAT payments (in %) VAT payments (in €)
2011 Scenario 1 Scenario 2 2011 Scenario 1 Scenario 2
Single 11.1% +0.0%p +0.0%p 311 +1 +1
Single + 12.4% +0.1%p +0.1%p 627 +4 +4
Multi 13.0% +0.1%p +0.1%p 700 +3 +3
Multi + 13.6% +0.1%p +0.1%p 928 +4 +4
Source: Household Budget Surveys, National Accounts (Eurostat), own calculations.
New standard rate in scenario 2: 20 %.
Exchange rate of 1.956 Leva to 1 Euro.
“+” indicates a household with dependent children
2.2 VAT paid by non-household entities
Scenario 1 has a negligible effect on the VAT liability for Bulgaria, given the extremely low number of zero and reduced goods and services (see Table 12). As a result, small increases are only recorded for Hotels and Restaurants and Air Transport.
TAXUD/2012/DE/323
Table 12: Bulgaria – scenario 1: main product composition, non-households
Product Hotels and
Restaurants Air Transport
Total increase in 1,000 €
Sector Increase
in 1,000 €
Share in VAT by sector
Increase in 1,000 €
Share in VAT by sector
Real Estate Activities 11 0% 0 0% 11
Financial Intermediation 7 0% 5 0% 12
Public Admin and Defence;
Compulsory Social Security 26 1% 38 0% 63
Education 5 0% 1 0% 6
Health and Social Work 1 0% 11 0% 12
Other Community, Social and
Personal Services 5 0% 9 0% 14
Government final consumption 98 4% 0 0% 98
Total increase by product 153 64
% increase in VAT liability
by product 3% 0%
Source: WIOD, EUROSTAT, IBFD, European Commission, Own Submissions and own calculations.
Note: Differences in totals may occur due to rounding
Study on VAT rates structure – Addendum
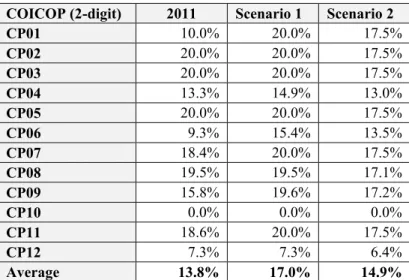
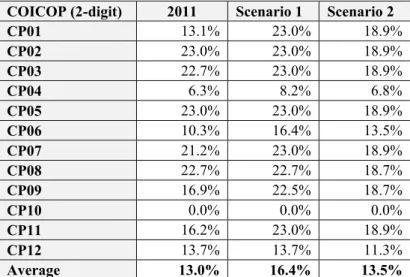
3 Czech Republic
The Czech Republic applies a standard rate of 20 % and a reduced rate of 10 %. The reduced rate covers food and non-alcoholic beverages, services for the maintenance of dwellings, water, refuse and sewerage collection, firewood, pharmaceutical and other medical products, domestic passenger transport, flowers and seeds, cultural, recreational and sporting services, books, newspapers and other printed material and accommodation services. Supplies that are VAT exempt are listed in section 2.1 in the main report.
3.1 VAT paid by private households
Taking into account all deviations from the standard rate, the average VAT rate in the Czech Republic is 13.8 %.4 Following scenario 1, the average VAT rate in the Czech Republic raises from 13.8 % to 17.0 %. This effect is primarily due to changes in the VAT rate applying to categories CP01 “Food and non-alcoholic beverages”, CP06
“Health” and CP09 “Recreation and culture”. In these categories the VAT rates double, rise by two thirds or by one fourth, respectively. Scenario 2, in which the reduced rate is abolished and a revenue neutral rate is introduced, also leads to a considerable increase in the average VAT rate for private households from 13.8 % to 14.9 %, again due to large changes in the VAT rates for the aforementioned expenditure categories.
4 This average rate on household consumption deviates from the rate mentioned in section 2.2 in the main report. The reason is that HBS data for the Czech Republic do not contain information on imputed rents as do NA and WIOD data. Therefore, NA and WIOD data contain a higher share of exempt goods and thus a lower average VAT rate in all scenarios.