• Keine Ergebnisse gefunden

Study on the economic effects of the current VAT rules for passenger transport Final Report

N/A
N/A
Protected

Academic year: 2021

Aktie "Study on the economic effects of the current VAT rules for passenger transport Final Report"

Copied!
234
0
0

Wird geladen.... (Jetzt Volltext ansehen)

Volltext

(1)

Study on the economic effects of the current VAT rules for passenger transport

Final Report

TAXUD/2012/DE/334

FWC No. TAXUD/2010/CC/104

Client: European Commission, TAXUD

CASE Center for Economic and Social Research IHS Institute for Advanced Studies

Transport and Mobility Leuven

CPB Netherlands Bureau for Economic Policy Analysis (Consortium leader)

In consortium with:

CAPP CEPII ETLA IFO IFS

Warsaw, December 2014

This report was commissioned by the European Commission (DG TAXUD) and prepared by a consortium

under the leader CPB. The views and opinions expressed in this report are not necessarily shared by the

European Commission, nor does the report anticipate decisions taken by the European Commission.

(2)

CPB Netherlands Bureau for Economic Policy Analysis Van Stolkweg 14

P.O. Box 80510

2508 GM The Hague, the Netherlands

Telephone +31 70 338 33 80 Telefax +31 70 338 33 50 Internet www.cpb.nl

Acknowledgements

This report was written by a team of experts from CASE (Center for Social and Economic Research, Warsaw), IHS (Institute of Higher Studies, Vienna) and Transport Mobility Leuven (TML). The team was directed by Luca Barbone, and composed of Robin Carruthers (CASE), Maciej Sobolewski (CASE), Hannes Zenz IHS), Alina Pohl (IHS), Alexander Schnabl (IHS), Sarah Lappöhn (IHS), Tim Breemersch (TML), Rodric Federix (TML), Christophe Heyndrickx (TML) Eef Delhaye (TML). Research assistance was provided by Katarzyna Wąsik and José Pantoya (CASE). The Project was coordinated by Iryna Shuvaieva (CASE).

We also acknowledge discussions, comments and inputs from several representatives from organizations

of transport operators, as well as Member State representatives during a review meeting in June 2014 in

Brussels. All responsibility for the estimates and the interpretation in this report remain with the authors.

(3)

3

Table of Contents

EXECUTIVE SUMMARY 13

Objective 13

Background 13

Main Messages 13

Demand For and Supply of Passenger Transport 14

The Current VAT Regime 15

Competitive Distortions Resulting from the Current VAT Regime 16

1a) Different VAT Rates within One Mode at the Domestic Level 17

1b) Different VAT Rates between Modes at the Domestic Level 17

1c) Different VAT Rates within One Mode of Transport between Domestic, Intra-EU, and Extra-EU Transport 17 1d) Different VAT Rates between Different Modes of Transport for Intra-EU and Extra-EU Travel 18 1e) Different Delimitation between Domestic, Intra-EU, and Extra-EU (Two-Sector Trips) 18

1f) Lower VAT Rates Applied in Certain Regions 18

2a) Definition of Passenger Transport and Related Incidental Services 19

2b) Consumption On Board Ships, Aircraft, or Trains 19

3a) Exemptions Following Article 148 of VAT Directive – Delay in Processing VAT Refunds 19 3b) Specification of Vehicle Use for Passenger Transport for Purposes of Input VAT 20

3c) Tax Incentives for Fuel and Electricity 20

4a) Place of VAT Liability: Complexity of Calculating Place of Supply (Distance) of Extra-EU and Intra-EU

Rail and Road Transport 20

4b) Additional Compliance Costs 20

4c) Different Treatment of Sections In or Above International Areas Outside the EU 21 4d) Difficulty in Determining Place Of Supply (Distance) of Extra-EU and Intra-EU Air and Sea Transport 21

Overall Assessment of Distortions 21

Scenarios 23

Assessment of Scenarios 23

CHAPTER 1. INTRODUCTION 27

Objective 27

Background 27

Passenger Transport Services 28

Structure of the Report 28

CHAPTER 2. PASSENGER TRANSPORT DEMAND AND SUPPLY IN THE EU 31

A. Demand for Transport in the European Union 31

Urban Transport 31

(4)

Other Domestic and Intercity Transport 35

International Intra-EU Transport 39

International Extra-EU Transport 42

Business Transport 45

B. The European Passenger Transport Market from the Operators’ Perspective 47

Transport Markets 48

Measures of Passenger Transport Supply 49

How to Measure Passenger Transport Capacity 50

Estimates of Number of Vehicles 51

Seat Capacity 54

Results of Capacity Estimates 55

Modal Share by Market Supply 57

Competition within Modes 60

Coach Tour and Maritime Cruise Passengers 62

CHAPTER 3 - THE VAT REGIME FOR PASSENGER TRANSPORT 66

A. Overview of VAT Rates 66

General National VAT Rates 67

Road Transport 68

Rail Transport 71

Inland Navigation 73

Maritime Shipping 75

Air Transport 77

B. Other Transport Taxes and User Charges 79

CHAPTER 4. ANALYSIS OF COMPETITIVE DISTORTIONS 85

Assessment of Distortions 86

The distortions assessed in this Chapter impact on competition between operators within a mode and between modes. The impacts are assessed separately at the national level and for the four main transport markets. 86

Group 1: Distortions Due to Different VAT Rates 87

Group 2: Distortions Due to the Scope of Passenger Transport Services and Associated Supplies 107 Group 3: Distortions Due to the Treatment of Inputs in the Passenger Transport Sector 108

Group 4: Distortion With Regard to Place of Supply 115

CHAPTER 5 - POLICY OPTIONS TO ADDRESS DISTORTIONS 128

VAT Reform Scenarios 128

VAT Scenario 1 128

VAT Scenario 2 128

VAT Scenario 3 128

VAT Scenario 4 129

VAT Scenario 5 129

VAT Scenario 6 129

VAT Scenario 7 129

VAT Scenario 8 129

VAT Scenario 9 129

VAT Scenario 10 130

VAT Scenario 11 130

(5)

5

Passenger Trips Excluded from the Quantitative Assessments 131

Note on Multi-Sector Trips and Definition of Place of Departure 131

Note on the Pass-Through Coefficient 133

CHAPTER 6. SIMULATION OF POLICY SCENARIOS 137

Introduction 137

Overview of Results 139

Scenario Assessments 142

Business As Usual (BAU) 142

a. Member State Passenger Demand 142

b. Demand between City Pairs 144

VAT Scenario 1: VAT Rates for Urban, Domestic, and Intra-EU International Transport Set to National

Standard Rates 145

a. Impact on Member State Passenger Demand 145

b. Impact on Demand between City Pairs 148

c. Macro-Economic and Social Effects 149

d. Environmental Impact 153

VAT Scenario 2: VAT Rates for Domestic and Intra-EU International Transport Set to National Reduced

Rates 155

a. Impact of Member State Passenger Demand 155

b. Impact on Demand between City Pairs 157

c. Macro-Economic and Social Effects 159

d. Employment in the Transport Sector 160

VAT Scenario 3: VAT Rates for Domestic and Intra-EU International Transport Set to National Standard Rates, Place of Taxation Changed to Member State of Departure/Arrival 162

a. Impact on Member State Passenger Demand 162

b. Impact on Demand between City Pairs 164

VAT Scenario 4: VAT Rates for Domestic and Intra-EU International Transport Set to National Reduced Rates, Place of Taxation Changed to Member State of Departure/Arrival 166

a. Impact on Member State Passenger Demand 166

b. Impact on Demand between City Pairs 168

VAT Scenario 5: VAT Rates for Domestic and Intra-EU International Transport Are Equal to BAU, Place of

Taxation Changed to Member State of Departure/Arrival 169

a. Impact on Member States Passenger Demand 169

b. Impact on Demand between City Pairs 170

VAT Scenarios 6 and 7: Exemptions According to Article 148 of the VAT Directive Abolished (6) or

Extended to Buses and Trains (7) 171

VAT Scenario 8: All VAT Rates Including Extra-EU are Set to National Reduced Rates, Place of Taxation

Changed to Member State of Departure/Arrival 172

a. Impact on Member States Passenger Demand 172

b. Impact on Demand between City Pairs 174

c. Macro-Economic and Social Effects 174

(6)

VAT Scenario 9: All VAT Rates Including Extra-EU are Set to National Reduced Rates, Place of Taxation Changed to Member State of Departure/Arrival, With VAT Applied to Pre-Tax Fares 177 VAT Scenario 10: Implementation of a One-Stop VAT Shop for Passenger Transport 181 VAT Scenario 11: All Domestic VAT Rates as in BAU, All International (Intra- and Extra-EU) VAT Rates

Set to Zero 183

a. Impact on Member States Passenger Demand 183

b. Impact on Demand between City Pairs 185

c. Macro-Economic and Social Effects 186

ANNEXES 188

ANNEX 1 - RELEVANT EU VAT LEGISLATION 189

Legal Framework 189

Provisions Regarding Passenger Transport (Output VAT) 189

Place of Supply 189

Rates Applicable 190

Provisions with Respect to Input VAT 195

ANNEX 2 – METHODOLOGICAL NOTE ON DEMAND DATA 199

ANNEX 3 – BACKGROUND ASSUMPTIONS AND ANALYTICAL TOOLS FOR EVALUATING VAT

REFORM SCENARIOS 201

Background Assumptions 201

The Three Models 202

Models for the Quantified Assessment of Scenarios – Outputs, Strengths and Weaknesses 202

TREMOVE 202

EDIP 205

Interaction between TREMOVE and EDIP 207

City Pairs Model (CPM) 207

ANNEX 4 – A MODEL OF PASS-THROUGH COEFFICIENTS FOR VAT IN TRANSPORT 218

Introduction 218

Theoretical Foundations of tax pass-through 219

Determinants of Taxation Pass-Through Illustrated in a Cournot Oligopoly Framework 220

Ad Valorem Tax Pass-Through 221

Empirical Evidence on VAT Pass-Through in Passenger Transport 223

Review of Previous Empirical Studies 223

Modelling Framework for VAT Pass-Through in Different Transport Modes. 224

(7)

7

Country-Mode Pass-Through Levels 227

REFERENCES 230

(8)

List of Tables

Table ES.1 – Summary and Assessment of Distortions 22

Table ES.2 – Overview of Assessment of Scenarios 25

Table 2.1 – Transport Volumes Urban Transport 33

Table 2.2 – Market Share for Urban Transport 34

Table 2.3 – Transport volumes "Other domestic transport" 36

Table 2.4 – Market shares "Other domestic transport" 37

Table 2.5 – Transport Volume and Market Share for Intercity Transport 38 Table 2.6 – Transport volumes international transport (Intra-EU) 40

Table 2.7 – Market shares international transport (Intra-EU) 41

Table 2.8 – Transport volumes international transport (Extra-EU) 43

Table 2.9 – Market shares international transport (Extra-EU) 44

Table 2.10 – Business Passenger Transport 46

Table 2.11 – Number of Vehicles by Member State 52

Table 2.12 – Share of Total Registered Vehicles Available for Passenger Services 53 Table 2.13 – Allocation of PKM by Mode among Non-Urban Markets 54 Table 2.14 – Assumed or Derived Seat Capacity per Passenger Vehicle 55

Table 2.15 – Summary of Three Measures of Capacity 55

Table 2.16 – Transport Supply by Market and Indicator 56

Table 2.17 – Modal Share of Supply (seat km) in the Intra-EU Market 58 Table 2.18 – Measures of HHI for Airlines in Select Member States 60 Table 2.19 – Measures of HHI for Bus Services in Select Member States 61 Table 2.20 – Estimated Composition of Bus Market in the EU27 (2008) 63

Table 2.21 – Estimated Vehicle Fleet 64

Table 2.22 – European Cruise Passengers, 2011 65

Table 3.1 – Overview of VAT Rates Applied by Member States (%) 67

Table 3.2 – VAT Rates on Road Transport 68

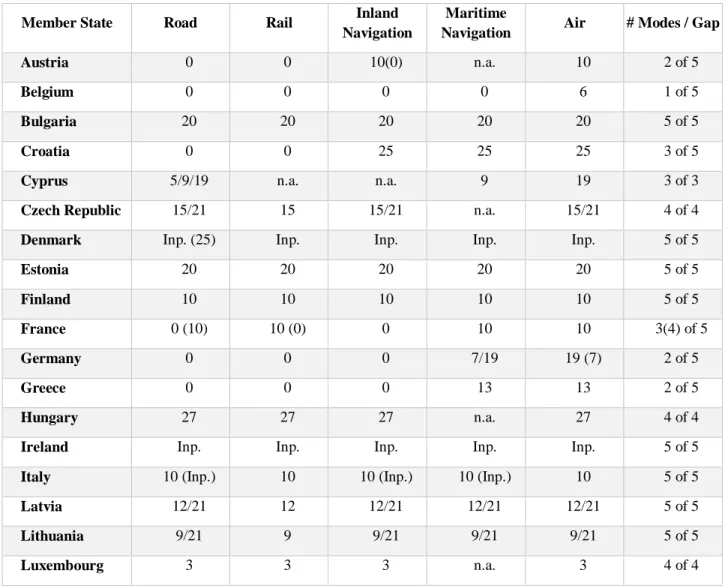
Table 3.3 – VAT Rates on Rail Transport 71

Table 3.4 – VAT Rates on Inland Navigation 73

Table 3.5 – VAT Rates on Maritime Shipping 75

Table 3.6 – VAT Rates on Air Transport 77

Table 3.7 – Internalization Charges by Mode and Level of Administration 79 Table 3.8 – Other Indirect Taxes Levied on Passenger Transport Services 82 Table 4.1 – Summary of Different VAT Rates within One Mode (Domestic) 88

Table 4.1.1 – Effects of Reduced Rates in Germany 90

Table 4.2 – VAT Rates between Modes (Domestic) 93

Table 4.3 – Gap between Rates for Domestic and International Transport by Mode 94

Table 4.4 – Loss in PKM from Distortion 1c 97

Table 4.5 – Gap between VAT Rates Applied to Transport Modes in Intra-EU and Extra-EU Passenger Transport

99 Table 4.6 – Comparison between Modes in Intra-EU and Extra-EU Transport 100

Table 4.7 – Loss of PKM from Distortion 1d 101

Table 4.7.1 – Bus and rail competitive city pairs 103

Table 4.7.2 – Rail and air competitive city pairs 103

Table 4.7.3 – Comparison modes for typical city pairs 104

Table 4.8 – Estimated Impact of VAT Distortion 1f 106

Table 4.9 – Estimated VAT Revenue from Small Public Transport Vehicles in the UK 108

Table 4.10 – Liability to Pay VAT on Inputs 110

(9)

9

Table 4.12 – Estimation of Operating Cost Impact of Abolition of Article 148 113

Table 4.13 – VAT Administrative Burden 119

Table 4.14 – VAT Compliance Costs, UK 120

Table 4.15 – Estimate of VAT Revenue from Additional Flight Distances 124 Table 4.16 – Estimate of VAT Revenue from Additional Maritime Distances 124

Table 4.17 – Summary of Distortions and Their Assessment 127

Table 5.1 – Summary of Alternative VAT Scenarios 130

Table 5.2 – Calculated Pass-Through Rates 135

Table 6.1 – Overview of Scenario Assessments 140

Table 6.2 – Summary of Business As Usual (EU28, PKM) 142

Table 6.3 – Business As Usual: VAT Revenues from Transport Sector (EUR m) 143 Table 6.4 – Business As Usual City Pairs Model: Fares, Passengers, and VAT Revenue 144 Table 6.5 – Scenario 1: Full Pass-Through: Transport Demand (EU28, PKM) 145 Table 6.6 – Scenario 1: Less-Than-Full Pass-Through: Transport Demand (EU28, PKM) 146

Table 6.7 – Scenario 1: Changes in VAT and Operator Revenues 147

Table 6.8 – Scenario 1: City Pairs Model, Full Pass-Through: Changes in Fares, Trips, and VAT Revenue (Comparison with BAU)

148

Table 6.9 – Scenario 1: GDP Effects (Comparison with BAU) 149

Table 6.10 – Scenario 1: Employment Effects 151

Table 6.11 – Scenario 1: Distributional Effects 153

Table 6.12 – Scenario 1: Environmental Effects 154

Table 6.13 – Scenario 2: Full Pass-Through: Transport Demand (EU28, PKM) 155 Table 6.14 – Scenario 2: Less-Than-Full Pass-Through: Transport Demand (EU28, PKM) 156

Table 6.15 – Scenario 2: Changes in VAT and Operator Revenues 157

Table 6.16 – Scenario 2: City Pairs Model Full Pass-Through: Changes in Fares, Trips, and VAT Revenue (Comparison with BAU)

158 Table 6.17 – BAU and Scenarios 1 and 2 City Pairs Model: Comparison of VAT Revenue 159

Table 6.18 – Scenario 2: GDP Effects (Comparison with BAU) 160

Table 6.19 – Scenario 2: Employment Effects 161

Table 6.20 – Scenario 2: Distributional Impact 161

Table 6.21 – Scenario 3: Effects of Changes in Place of Taxation (Compared to Scenario 1) 163 Table 6.22 – Scenario 3: Basic Parameters of Sample City Pairs 165 Table 6.23 – Scenario 3: Changes in Fares, Trips, and VAT Revenue (Comparison with BAU) 166

Table 6.24 – Scenario 4: Changes in PKM and VAT Revenue, 2030 167

Table 6.25 – Scenario 4: City Pairs Model: Changes in Trips and VAT Revenue 169

Table 6.26 – Scenario 5: Changes in PKM and VAT Revenue, 2030 170

Table 6.27 – Scenario 5: Changes in Trips and VAT Revenue 171

Table 6.28 – Scenario 8: Revenue Effects (Compared with Scenario 4) 173 Table 6.29 – Scenario 8: Extra-EU City Pairs Model: Fares, Passengers, and VAT Revenue 174

Table 6.30 – Scenario 8: GDP Effects (Comparison with BAU) 175

Table 6.31 – Scenario 8: Employment Effects 175

Table 6.32 – Scenario 8: Distributional Impacts 176

Table 6.33 – Scenario 9: Air Passenger Charge Revenue and VAT on Air Passengers 180

Table 6.34 – Scenario 9: Approximation of Air Passenger Charges Used in CPM 180

Table 6.35 – Scenario 9: Changes in Fares, Trips, and VAT Revenue (Comparison with BAU) 180

Table 6.36 – Scenario 11: Full Pass-Through: Transport Demand (EU28, PKM) 183

Table 6.37 – Scenario 11: Less-Than-Full Pass-Through: Transport Demand (EU28, PKM) 184

Table 6.38 – Scenario 11: Revenue Implications (Comparison with BAU) 184

Table 6.39 – Scenario 11: Changes in Fares, Trips, and VAT Revenue (Comparison with BAU) 185

(10)

Table 6.40 – Mechanical Application of Scenario Rates to 2010 Demand Structure (EUR m) 187 Table A1.1 – Derogations in VAT Directive to Passenger Transport for Member States 191

Table A2.1 – Demand Data in TREMOVE and ETISplus 199

Table A3.1 – City Pairs Distance Statistics 203

Table A3.2 – Other Domestic City Pairs 213

Table A4.1 – Estimation Results: Air Passenger Transport 225

Table A4.2 – Estimation Results: Railway Passenger Transport 226

Table A4.3 – Estimation Results: Road Passenger Transport 226

Table A4.4 – Estimation Results: Waterways Passenger Transport 226

Table A4.5 – HHI and Pass-Through for Each Transport Mode 227

Table A4.6 – Estimation Results: Impact of HHI - All Modes 227

Table A4.7 – Pass-Through Estimates for Country - Modes Pairs 228

(11)

11

List of Acronyms and Abbreviations

AEA Association of European Airlines

ALSA Automóviles Luarca, S.A.

CAPA CAPA - Center for Aviation

CES Constant Elasticities of Substitution

CGE Computable General Equilibrium Model

DG CLIMA Directorate-General for Climate Action

DG ENTR Directorate-General for Enterprise and Industry DG ENV Directorate-General for the Environment DG MOVE Directorate-General for Mobility and Transport DG TAXUD Directorate-General for Taxation and Customs Union

EDIP Economic Model for Distribution and Inequality Effects of Economic Policies

ELTIS European Local Transport Information Service ETIS European Transport Policy Information System EUROSTAT Statistical Office of the European Communities EU13 “New” Member States of the EU (after 2004) EU15 “Old” Member States of the EU (prior to 2004)

FP6 Sixth Framework Program

GDP Gross Domestic Product

HGV Heavy Good Vehicle

HHI The Herfindahl–Hirschman Index

HMRC Her Majesty's Revenue and Customs

HSR High-Speed Rail

IEA International Energy Agency

IMF International Monetary Fund

LRT Light Rapid Transit

MS Member State of the European Union

NETP Non-Established Taxable Persons

NUTS Nomenclature of Territorial Units for Statistics

OECD Organization for Economic Cooperation and Development

(12)

PKM Passenger Kilometres

SAM Social Accounting Matrix

SMR Single Market Regulation

TKM Ton Kilometres

TREMOVE Transport and Emissions Simulation Model

UIC International Union of Railways

UITP International Union of Public Transport

VAT Value Added Tax

VATA VAT Act

VATD VAT Directive

VKM Vehicle Kilometres

WIOD World Input Output Database

(13)

13

Executive Summary

Objective

The objective of this study is to provide an economic assessment of the impact of the current VAT regimes and the likely effects of alternative VAT regimes in order to assist the Commission in making policy choices.

Background

In December 2011 the European Commission set out the fundamental features of a future VAT system, one of the key priorities of which was that it should be more efficient than the current system. In respect of passenger transport services, this system, with its many exemptions and special and reduced rates, has resulted in the application of a multiplicity of different rates depending on the transport modes, the transport markets and the Member States. The current rules for passenger transport have long been believed to result in many competitive distortions. These output distortions are exacerbated by the complexity of the current place-of-supply rules, which are believed to result in high compliance costs and voluntary or involuntary non-compliance. These impacts are greater for passenger transport than most other economic activities because of the international nature of many of the services provided.

Two approaches to resolving these issues are possible – maintaining the status quo with some fine-tuning or adopting a fresh start with many fewer exemptions and compliance barriers.

This study contributes to the debate on possible options for reform by providing a summary of the current state of the passenger transport market, a review of the current VAT regime, an assessment of the impact of many of the perceived distortions and an evaluation of some of the alternative VAT structures on which a future VAT regime for the transport sector might be based 1 .

Main Messages

Since the last large-scale review in 1997, the passenger transport sector has changed in a considerable way, as a result of the greater impacts of airline deregulation, implementation of rail concessioning, and the deregulation of bus transport. The cruise industry has also changed and experienced high growth.

This study provides an update on the structure of the passenger transport industry as it relates to VAT, an assessment of the distortions arising from the current VAT rules and regulations, and an evaluation of some of the changes that might be considered to address those distortions.

The assessments carried out in this report indicate that the distortions are generally small- or medium- sized. For the distortions on output, part of the explanation is in the low elasticities of demand; while for input distortions, it is the ability of operators to reclaim any VAT incurred on inputs, so the only cost is that of financing these costs between when they are paid and when they are rebated. These costs are relatively small because of the reduced times between payment and reimbursement and the current low interest rates on that financing.

1 There are other taxes and subsidies than those pertaining to the VAT regime in the sector (most importantly subsidised

infrastructure and the system of charges related to that). This report concentrates exclusively on the current VAT rules.

(14)

The study identifies one set of measures that addresses the output distortions with regard to different VAT rates and the place of supply rules and another to address the input distortions. These changes would require a large amount of consensus among Member States and the European Commission.

The study also provides valuable insights for tax administrations. It reveals the enormous potential of the application of VAT in the passenger transport sector with regard to generating revenue and the limited impact of applying reduced VAT rates and exemptions on the demand for passenger transport services due to low elasticities of demand and pass-through rates that vary between 7% and 50%.

We can conclude that the above mentioned characteristics of the passenger transport sector suggest a simplified and harmonised application of VAT to all modes and markets. At least the benefits from changing the place of supply rules can be obtained at virtually no cost.

Demand For and Supply of Passenger Transport

The demand for and supply of passenger transport services were considered in terms of four markets:

urban, other domestic, intra-EU (between Member States), and extra-EU (between Member States and non- EU countries), and each of these from the perspective of each Member State.

The first two markets dominate, accounted in 2010 for more than 99% of total passengers, of which about two-thirds (63.1%) are urban and 36.0% are other domestic. Intra-EU passengers account for only 0.7% of the total and extra-EU passengers for only 0.2%. However, because of different trip lengths, urban passengers account for only 24% of passenger kilometres (PKM), other domestic passengers for 41%, intra- EU for 15%, and extra-EU for 20%.

 Within the urban market, metro passengers account for about 46% of passengers, but only 24% of PKM, bus passengers for 41% of passengers and 38% of PKM, while rail accounts for only 13%

of passengers, but 35% of PKM;

 Air transport accounts for a small share of domestic passengers (0.5%), but a much larger share of PKM (7.1%), the largest share of intra-EU passengers (72%) and an even larger share (87.2%) of PKM, and a dominant share of both extra-EU passengers (91.5%) and PKM (98.6%);

 Bus transport accounts for the largest share of domestic passengers (81%), but a smaller share of domestic PKM (59.4%), and the smallest share of intra-EU passengers (8%) and PKM (4.1%) and extra-EU passengers (3.6%) and PKM (4.1%); and

 Rail has the second largest share of domestic passengers (15%) and PKM (33.5%), as well as of intra-EU passengers (20%) and PKM (8.8%). It has a slightly higher share of extra-EU passengers than bus (5%), but about the same small share of PKM (0.7%).

These market and mode shares are important in assessing the overall significance of the market distortions attributable to differences in VAT rates. Although the intra-EU and extra-EU markets attract more attention in terms of these distortions, since they account for less than 1% of all passengers, their overall impact on competitive distortions is small. The difference in market shares of PKM shows that the two international markets (intra-EU and extra-EU), which together account for 35% of the total, will be more important in assessing the impacts of any market distortions on VAT revenues.

There are four features of all passenger transport markets within the European Union that impact the

(15)

15

 They tend to be concentrated;

 Demand is more heterogeneous than supply;

 Providing transport services is highly capital-intensive; and

 There are large economies of scale, resulting in competitive advantages for larger operators and significant barriers to entry for new competitors.

While competition between modes is influenced by VAT distortions, competition within modes is less so as operators face the same VAT rates on their outputs. Within air markets, competition between airlines increased significantly after deregulation, but has since slowed down. 2 Within bus markets there is a wide range of competition, greater than for airlines. In most rail passenger markets the nature of competition is rather different; for most Member States, it is competition “for markets” (through competition for concessions) rather than competition “within markets” (through competition between different operators on the same tracks).

The Current VAT Regime

Currently the taxation of passenger transport services falls within the competence of the Member State where the transport takes place. Consequently, in the case of cross-border passenger transport, the service will be subject to the VAT rules of multiple Member States. In this case, the allocation is to be made proportionately in terms of the distances covered in each Member State.

Chapter 3 of this report provides an overview of the VAT rates in the European Union as applied to passenger transport services. For each mode of transport (road, rail, inland waterways, maritime shipping, and air), we distinguish between domestic, intra-EU, and extra-EU transport. In the case of domestic transport, a further distinction is made according to type of transport (e.g. bus, taxi, tram, metro, or scheduled or unscheduled services).

While standard VAT rates in Member States range from 15% (Luxembourg) to 27% (Hungary), passenger transport services are frequently taxed at lower rates, or even zero-rated or exempt from VAT. 3 With respect to domestic passenger transport, six Member States apply the standard rate to all domestic passenger transport services (Bulgaria, Croatia, Estonia, Hungary, Romania, and Slovakia). In 12 Member States, (primarily) reduced rates are applied (Austria, Belgium, Finland, France, Greece, Italy, Netherlands, Poland, Portugal, Slovenia, Spain, and Sweden). 4 Luxembourg is the only Member State that taxes all domestic passenger transport at a super-reduced rate of 3%. Denmark and Ireland exempt most domestic passenger transport services and in the UK, a large majority are zero-rated. The remaining six Member

2 Competitiveness is measured using the Herfindahl-Hirschman Index (HHI). The HHI has a scale between 0 and 1, with a lower value indicating a more competitive market. In the period 2003 to 2010, for the five Member States for which data is available, the HHI reduced from 0.39 to 0.32.

3 Passenger transport is among the supplies that may be taxed at the reduced rate according to the VAT Directive. In addition, intra- EU and extra-EU passenger transport services are exempt with credit (i.e. effectively zero-rated) in many Member States based on derogations in the VAT Directive.

4 With the following exceptions: Belgium: maritime shipping is zero-rated; Italy: urban transport services by taxi and ship are

exempt (without credit); Netherlands: domestic air transport is taxed at the standard rate, certain ferry services can opt for VAT

exemption.

(16)

States use different criteria to distinguish between various types of domestic services, which are also subject to different VAT rates. 5

Currently there are no differences with respect to VAT rates between intra-EU and extra-EU passenger transport services, as they are treated as international transport. While all 28 Member States zero-rate international passenger transport by maritime shipping and air, other modes are frequently subject to positive rates. International passenger transport by road is taxed in 10 Member States (Austria, Belgium, Croatia, France, Germany, Greece, Netherlands, Poland, Slovenia, and Spain) 6 and international passenger transport services by rail are subject to a positive VAT rate in 7 Member States (Austria, Belgium, Croatia, Germany, Greece, Netherlands, and Spain). 7 Most of these countries apply a reduced rate, with the exception of Croatia (road and rail), Denmark (non-scheduled bus services), and Germany (long-distance services), with international passenger transport taxed at the standard rate.

In the case of business travel, VAT incurred on passenger transport services is usually deductible. This, however, does not hold for France, Greece, Italy, and Portugal. Other Member States also apply restrictions in certain cases.

Aside from the VAT taxation of the actual passenger transport service itself, consideration must also be given to the taxation of inputs, such as means of transport and fuel. Article 148 of the VAT Directive provides exemptions from VAT for certain inputs to maritime shipping and international aviation, which are valid, with only minor implementation-specific differences, in all Member States. Other inputs are, as a general rule, subject to the standard VAT rules and, therefore, taxed at the standard rate, with VAT deductibility for the buyer. There are, however, certain exceptions from that rule (e.g. a few Member States extend provisions of Article 148 to other vessels due to special derogations, and some Member States restrict deduction with respect to certain inputs, especially passenger cars and fuel).

Other taxes on passenger transport, aside from VAT and user charges, are mostly on air transport. Air passenger taxes are currently in place in Austria, France, Germany, Italy, and the UK. Usually, they are levied per embarking passenger and the rate mostly depends on flight distance (e.g. Austria, France, Germany, and the UK), but sometimes also on the travel class (e.g. France and the UK). A special case is the tax for air taxi services in Italy, which is only applicable to chartering the whole aircraft. The highest rates are currently charged in the UK and the lowest are charged in Italy and France.

Competitive Distortions Resulting from the Current VAT Regime

A distortion is defined as the unequal treatment of passengers and/or operators with respect to any of the parameters composing the VAT regime in force in Member States in the passenger transport sector, and which leads to economic, social, and/or environmental changes in behaviour.

There are four groups of distortions deriving from the current VAT regime, those resulting from different:

5 Often scheduled services are taxed at a lower rate than unscheduled services. This is the case in the Czech Republic, Latvia, Lithuania, and Malta. In Germany, the main factor is the distance, whereas in Cyprus, the mode of transport and the location are decisive.

6 Additionally Denmark taxes non-scheduled bus services.

(17)

17

 VAT rates between transport services provided in different modes, markets, and Member States;

 Member States in the way they define passenger transport services and their associated inputs;

 Treatments by Member States of inputs in the passenger transport services by different modes in different markets; and

 VAT rates and regulations regarding the place of supply of transport services and their inputs.

1a) Different VAT Rates within One Mode at the Domestic Level

Twelve Member States have some form of this distortion. The distortion can apply to a specific mode (e.g. short distance buses and taxis might have a different rate than those used on longer distance routes), vehicle size (e.g. passengers using some sizes of vehicle might or might not be eligible for lower VAT rates than those using other sized vehicles), or scheduled versus unscheduled services.

1b) Different VAT Rates between Modes at the Domestic Level

This distortion is not very common. Unambiguous examples include: the Netherlands, where domestic air travel is taxed at the standard rate of 21%, whereas all other modes benefit from a reduced rate (6%);

Belgium, where maritime shipping is zero-rated, while other modes are taxed at 6%; and Cyprus, where the standard rate (19%) is applied to transport by air and inland waterways, and maritime shipping is taxed at the reduced rate of 9%. Road transport in Cyprus is subject to three different rates (19%, 9%, and 5%).

1c) Different VAT Rates within One Mode of Transport between Domestic, Intra-EU, and Extra-EU Transport

This distortion is one of the most widespread, and, for some Member States, the differences between domestic and intra-EU VAT rates are quite high. All but three Member States apply a lower effective VAT rate to at least one mode of intra-EU or extra-EU passenger transport than they do for that mode in domestic transport.

Fourteen Member States zero-rate all international services irrespective of mode of transport; while at the same time applying a positive VAT rate to all modes of domestic transport. One Member State has a different rate for four modes, four Member States for three modes (maritime shipping and inland navigation are included as two more modes, although the passengers are not included in the statistics of numbers of passengers), five Member States for two modes, and two Member States for one mode. 8 The practical impact of the distortion is less than its potential, as there is only limited competition between the markets that could be influenced by transport fares.

Transport cost is not the main criterion for choice of destination (and therefore of travel market) for most non-business passengers, and even less so for businesses passengers. Hence, differences in VAT rates for a given transport mode between transport markets do not have a significant impact on the choice of market for travel. The overall assessment of the distortion is that it is large, due in great measure to the distortion

8 Two Member States (Denmark and Ireland) have the same effective VAT rate for passenger transport outputs (exempt for

domestic and zero for intra-EU and extra-EU), so this makes a difference on how VAT is assessed on inputs.

(18)

in the domestic air market compared to the international air market. Other modes are less affected by this distortion.

1d) Different VAT Rates between Different Modes of Transport for Intra-EU and Extra-EU Travel

Whereas all Member States zero-rate intra-EU and extra-EU air and maritime passenger transport, 10 Member States apply positive tax rates to extra-EU road passenger transport, 7 to rail transport, and 6 to inland navigation. The gap between the rates applied to the different modes of intra-EU and extra-EU passenger transport within the same Member State ranges from 5 to 25 percentage points.

The extent of the distortion was quantified in terms of numbers of passengers and revenue to operators, but the extent of the distortion depends on what it is compared to. We have compared the current VAT rates with a situation in which all modes would be zero-rated, since 80% of the Member States and mode combinations in the two international markets are zero-rated.

The impact of this distortion is considered to be of medium impact. There would be a loss of some 0.5 billion PKM for these two modes, less than 1% of the total, but a rather greater percentage of loss of operator revenue of between 2% and 3%, and greater still for operators specializing in international passenger transport. These losses are measured against the 2013 numbers of passengers and mode shares, but as high speed rail (HSR) and international bus services expand to compete more with air services, the losses might be expected to be slightly greater.

1e) Different Delimitation between Domestic, Intra-EU, and Extra-EU (Two-Sector Trips) This distortion results from some Member States (e.g. Belgium, Denmark, France, Germany, Netherlands, Poland, Slovenia, and Spain) applying the domestic VAT rate to the domestic part of an international passenger trip.

Even where the domestic section of an international trip can be identified, the addition of the national VAT to the fare has only a small impact on competitiveness. For a typical intra-EU trip, 9 the fare increases by about 2.4%, which results in a reduction of number of trips by 0.8%, as compared to a no-VAT case.

Nevertheless, the number of multi-sector trips where the first section is domestic is a small proportion of the total, even for the Member States that currently apply this distortion. We thus assess the extent of the distortion as small for the Member States involved and very small for the EU as a whole.

1f) Lower VAT Rates Applied in Certain Regions

Some Member States apply a lower VAT rate for passenger travel within or to and from some of their less developed regions. The differences in VAT rates are small. Portugal applies 5% VAT for travel in Madeira and the Azores (and zero-rates travel to and from the islands), instead of the usual 6% for domestic passengers, and France applies a 0% rate to Corsica instead of the national reduced rate of 10% (except the section within continental France). 10 The fare reduction through the application of a lower VAT rate as a

9 With an average trip length of 1,540km, of which 300km are in the origin Member State, and an average fare of EUR 0.15/km

including an average VAT rate of 12%.

(19)

19

percentage of the total cost of a tourist trip to the affected regions is less than 1%. However, the proportion of national tourists (international tourists are mostly subject to zero rates for their air and maritime travel) to each of the two destinations is quite high, at about one-third for Madeira 11 and about two-thirds for Corsica. 12

2a) Definition of Passenger Transport and Related Incidental Services

Most Member States have a clear directive in their legislation regarding which passenger services are subject to VAT. Other Member States are less clear, particularly with respect to vehicles that are not used exclusively for passenger transport. For example, some exclude rental cars without a driver, while others apply a lower limit on vehicle size. The extent of this distortion is small, as the majority of passenger travel falls clearly within or outside Member State VAT regulations.

2b) Consumption On Board Ships, Aircraft, or Trains

This distortion is not included in the assessment, since it is covered in another report 13 and was not included in the terms of reference.

3a) Exemptions Following Article 148 of VAT Directive – Delay in Processing VAT Refunds Article 148 of the VAT Directive provides the framework for the zero-rating of supplies for maritime and international aviation, but not to the same supplies for international bus and rail services.

The impact on operators’ costs is not as great as might first appear. While these two modes do not have to pay VAT on their qualifying inputs, the competing modes of rail and bus transport can reclaim such VAT. Their additional costs derive only from the financing costs of VAT for the period between when the payments are made and the reimbursements are received.

The impact of this distortion has been measured as the total avoided cost of financing the VAT liability maritime and air passenger operators would have incurred if Article 148 were not operational. The combination of the ability of operators to recover VAT on inputs when the outputs are positively rated, the relatively short periods within which input VAT is now reimbursed by most Member States, and the current low interest rates that apply to funding the VAT during this period, result in a small overall cost impact of this distortion (EUR 121 million).

11 Anuario Estadistico da Regiao Autonoma de Madeira, 2012.

12 Ministère des Transports de Equipment du Tourisme et de la Mer, Ministère délègue au Tourisme, France.

13 For further information, see EC Report COM (2012) 605 final available on: http://ec.europa.eu/

taxation_customs/resources/documents/taxation/vat/key_documents/reports_published/com_2012_605_en.pdf and the “Expert

study on the issues arising from taxing the supply of goods and the supply of services, including restaurant and catering

services, for consumption on board means of transport” by PWC available on: https://circabc.europa.eu/w/browse/59941dff-

4fd3-47bb-8ee9-c502cab5b7b6. The report does not cover the distinction between the supply of goods and services and does

not clarify if the supply of services might be covered by the derogation listed under Annex X, Part B, Point 9 of the VAT

Directive.

(20)

3b) Specification of Vehicle Use for Passenger Transport for Purposes of Input VAT

All Member States allow for the deduction of input VAT on vehicles used for the provision of commercial passenger transport services (except for cases where passenger transport services are exempt).

A few Member States apply restrictions, though, mainly in connection with private cars that are used for passenger services. The effect of these restrictions is most likely not relevant for competition, as they address the possibility of abuse of deductions. We evaluate it as not relevant for purposes of this study.

3c) Tax Incentives for Fuel and Electricity

To encourage the use of public transport, in general, and, in select transport modes and in certain Member States, to have lower VAT rates and reduced tax and duty rates for other inputs. While possibly helping to achieve this objective, these lower rates can introduce distortions.

Energy is about 10% to 12% of train operating costs, up to 20% for bus operations, and about 30% for air passenger operations. However, all VAT expenditures on fuel used as an input to passenger transport operations can be reclaimed (other than in the Member States where services are exempt from VAT without the right to reclaim).

As with VAT on other inputs to passenger transport operations, those for energy are refundable, so the only cost distortion is that of financing the difference in energy cost from those operators who do not benefit from the distortion. Even when the refund period is long, the financial cost is a small percentage of total operator cost. The overall impact of this distortion is very small.

4a) Place of VAT Liability: Complexity of Calculating Place of Supply (Distance) of Extra- EU and Intra-EU Rail and Road Transport

The place of VAT liability has attracted much attention for the administrative costs that it is believed to impose on transport operators for its collection and distribution to the various Member States through which passenger trips pass.

Measuring VAT according to distance obliges companies in the bus and railway passenger transport sector to determine VAT for each trip separately. Whereas the use of informatics tools allow for such calculations, they do involve start-up and maintenance costs. The costs are a handicap for small operators that cannot so easily make use of professional software tools.

The correct calculation of the distances passengers travel in each country is particularly important for small Member States whose passenger travel VAT revenue is largely earned from transit passengers. This proportion is higher for Member States located closer to the geographic centre of the EU territory.

4b) Additional Compliance Costs

Although there are four different distortions in this group, they were assessed together as no data was found for the individual distortions. Supplying passenger transport services in certain Member States necessitates higher administrative costs than in others.

Coping with these differences is particularly onerous for small operators. Based on the data for the UK

(the only Member State where compliance by company size was found), compliance costs for small and

large companies is about the same, but several times higher than that for medium-sized companies. From

(21)

21

to be dealt with. Overall, the impact of this distortion is small, but it does result in some discrimination against small transport operators.

4c) Different Treatment of Sections in or above International Areas outside the EU

Each Member State has its own regulations for determining the VAT liability for passenger transport that takes place in international water or airspace when it forms part of a domestic trip. Distortions also derive from the different ways of differentiating between domestic and international trips and from measuring the domestic part of the distance when VAT is applied to that part of an international trip.

A variation of this distortion is where domestic passengers might extend their trip a short distance to an international destination and then make a return international trip to their real destination. There are very few instances of this being feasible.

Although there are anecdotal instances of each variation of this distortion occurring in practice, when taken together, they account for a very small proportion of total trips and PKM.

4d) Difficulty in Determining Place of Supply (Distance) of Extra-EU and Intra-EU Air and Sea Transport

This distortion is different to the others in that it does not yet occur and would only occur if air or maritime international passenger transport were to be subject to VAT. If this were to be implemented, it could be difficult to determine what distance had been travelled in the territorial water or air space of transited Member States and what VAT liabilities would be incurred. Rail and, to a lesser extent, road transport is constrained in its distances and routes by the fixed infrastructure that it uses, which subsequently limits the complexity of calculating the distances travelled in each Member State. Sea and air transport are less constrained in this sense.

However, technology has greatly simplified such calculations and software used by airlines to assess their liability to Eurocontrol charges could easily be adapted to assess VAT liabilities. Similar software is available to ferry and cruise line operators. This is, therefore, unlikely to be an important distortion.

However, small operators might incur proportionally higher administration costs than large operators, particularly in dealing with trips that end up taking different routes to those expected when the passenger ticket was purchased and VAT liability first estimated.

Overall Assessment of Distortions

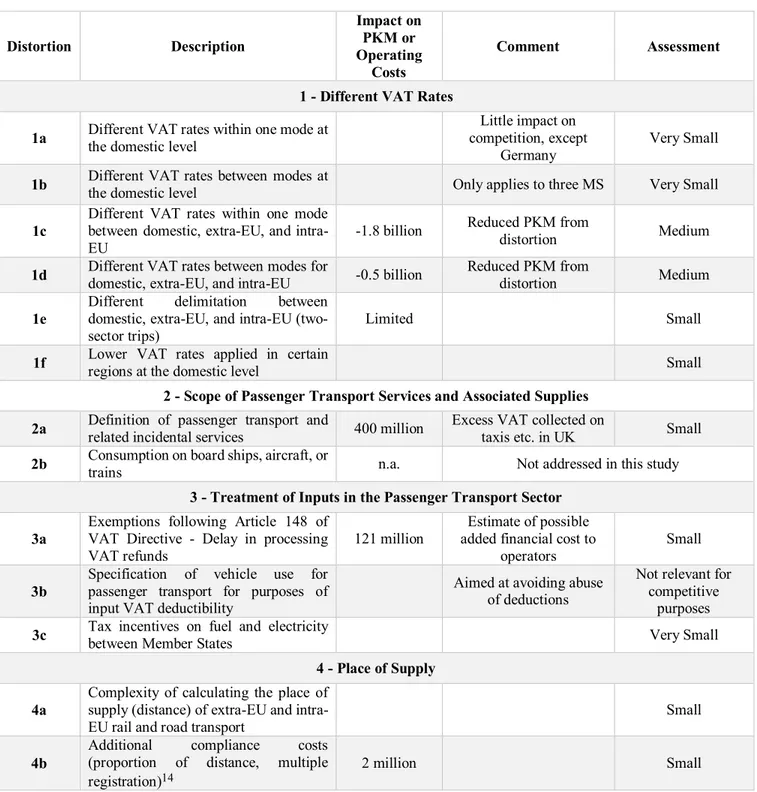
Six of the distortions have been assessed on the basis of the quantification of their impact on passenger demand, and through that on operator costs and Member States VAT revenues. Of the others, three have be assessed by the order of magnitude of their impacts, one has already been considered by other studies and actions and not considered further, and the remaining five could only be described quantitatively. None of the fifteen was found to have a large impact on passengers, operators, and Member States, but three were assessed to have a medium impact, seven a small impact, and three a very small impact.

Two of the three distortions that have a medium impacts are among those related to different VAT rates

on passenger services: within one mode between domestic, intra-EU, and extra-EU services, and between

modes for the same three markets. The third is the distortion that results from different delimitations

between the three markets.

(22)

Table ES.1 - Summary and Assessment of Distortions

Distortion Description

Impact on PKM or Operating

Costs

Comment Assessment

1 - Different VAT Rates 1a Different VAT rates within one mode at

the domestic level

Little impact on competition, except

Germany Very Small

1b Different VAT rates between modes at

the domestic level Only applies to three MS Very Small

1c Different VAT rates within one mode between domestic, extra-EU, and intra-

EU -1.8 billion Reduced PKM from

distortion Medium

1d Different VAT rates between modes for

domestic, extra-EU, and intra-EU -0.5 billion Reduced PKM from

distortion Medium

1e Different delimitation between domestic, extra-EU, and intra-EU (two-

sector trips) Limited Small

1f Lower VAT rates applied in certain

regions at the domestic level Small

2 - Scope of Passenger Transport Services and Associated Supplies 2a Definition of passenger transport and

related incidental services 400 million Excess VAT collected on

taxis etc. in UK Small 2b Consumption on board ships, aircraft, or

trains n.a. Not addressed in this study

3 - Treatment of Inputs in the Passenger Transport Sector 3a Exemptions following Article 148 of

VAT Directive - Delay in processing

VAT refunds 121 million Estimate of possible

added financial cost to

operators Small

3b

Specification of vehicle use for passenger transport for purposes of input VAT deductibility

Aimed at avoiding abuse of deductions

Not relevant for competitive

purposes 3c Tax incentives on fuel and electricity

between Member States Very Small

4 - Place of Supply 4a Complexity of calculating the place of

supply (distance) of extra-EU and intra-

EU rail and road transport Small

4b

Additional compliance costs (proportion of distance, multiple registration) 14

2 million Small

(23)

23 4c Different treatment of sections in or

above international areas outside EU Small

4d

Difficulty in determining the place of supply (distance) of extra-EU and intra-

EU air and sea transport Medium

Scenarios

Eleven indicative VAT scenarios have been used to help assess the impacts of possible ways to address the distortions. None of these scenarios address all distortions; hence, no scenario could be considered a candidate for an alternative VAT regime. The scenarios have been designed only to help determine whether each could be designed and how it might influence the three main players in passenger transport: the users, the operators, and the Member States. Some of the scenarios were amenable to quantification, others only to an order of magnitude estimate, while some could only be described quantitatively.

Scenario 1: Output VAT on all modes of passenger transport in the urban, other domestic, and intra-EU markets is set at national standard rates. VAT rates on extra-EU passengers and on all inputs to the operation of passenger transport are unchanged.

Scenario 2: Similar to Scenario 1, but with the output VAT rates set to the reduced national rates.

Scenario 3: The same as Scenario 1, but the place of taxation is changed from the Member State in which the transport service is provided to the Member State of passenger departure.

Scenario 4: The same as Scenario 2, with a change in place of taxation as in Scenario 3.

Scenario 5: Applies current VAT rates, but with the place of taxation as per Scenario 3.

Scenario 6: Applies current output VAT rates, but abolishes Article 148 of the VAT Directive exempting VAT on inputs to air and maritime intra-EU and extra-EU services.

Scenario 7: The same as Scenario 6, but instead of removing the exemptions of Article 148, it extends its provisions to inputs for bus and passenger rail services.

Scenario 8: Is similar to VAT Scenario 4, which applies national reduced VAT rates to passenger outputs, uses the Member State of passenger departure for where VAT liability is incurred, and extends that liability to the extra-EU passenger trips.

Scenario 9: is similar to VAT Scenario 8; however, the VAT liability for VAT on extra-EU passengers is based on the fare before user charges or taxes are added, with specific ticket taxes eliminated as they are replaced by VAT.

Scenario 10: Retains current input and output VAT rates, but implements the one-stop-shop provision for passenger transport VAT transactions.

Scenario 11: Applies current domestic VAT rates on inputs and outputs, but harmonizes the output VAT rates on intra-EU and extra-EU passengers to zero (or provides an exemption with the right to deduct).

Assessment of Scenarios

Table ES.2 presents an overview of the highlights of the results of the model simulations, which are

discussed in detail in the main text of this report.

(24)

By design, the various scenarios eliminate one or several of the distortions that have been identified and discussed or quantified. Thus, to the extent that the elimination of these distortions could be a desirable policy objective, the objective would be accomplished. The simulations displayed in Table ES.3, therefore, have to be considered as a quantification (to the extent possible) of the effects of the elimination of such distortions. If the elimination of the distortion is a benefit, the simulations give us an indication of the potential costs associated with these benefits. Not all of the consequences, however, are in the form of costs.

While different scenarios may be associated with reductions in transport volume, employment, or even (modestly) GDP, there are also benefits accruing from the scenarios, for instance, in the form of reduced environmental emissions and increased VAT revenues (at least in some of the scenarios), which can then, in turn, be used for other purposes by national governments.

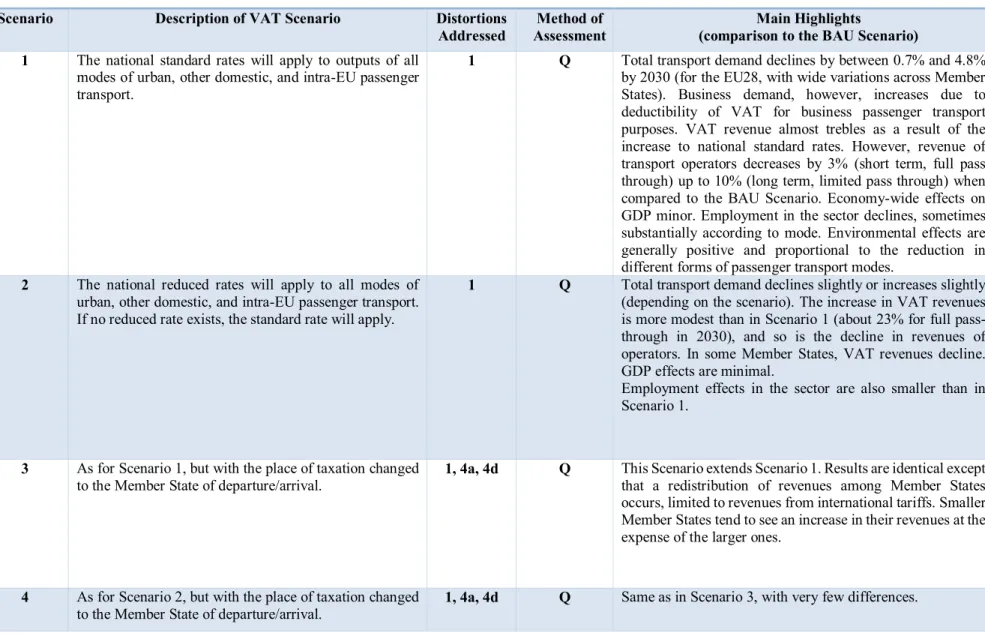
With this caveat, Table ES.3 shows that the scenario with the largest economic and environmental impact is Scenario 1, which is not surprising in view of the fact that it provides the largest shock to the existing system. Overall demand for transport declines by between 0.7% and 4.8% by 2030 (for the EU28, with wide variations across Member States). VAT revenue from passenger transport almost trebles as a result of the increase to national standard rates. However, transport operator revenue decreases by 3% (short term, full pass through) up to 10% (long term, limited pass through) when compared to the reference scenario, where the current VAT rules are maintained. 15 In addition, economy-wide effects on GDP are minor because of the hypothesis that compensatory tax reductions or transfer increases cushion households from a negative fiscal shock. However, employment in the sector declines, sometimes substantially, according to mode.

Scenario 2 has a much more moderate effect on all of the variables that have been discussed, since the increases in rates are more limited and apply to fewer Member States and modes (i.e. many Member States already use reduced rates).

Scenarios 3, 4, 5, and 8 provide information on the consequences of a change in the place of taxation.

The main message here is that, if such change were to be desirable for policy purposes, its effects would be rather marginal and we presume easily handled with minor compensatory mechanisms.

Scenarios 6 and 7 explore the consequences of removing or extending the provisions of Article 148 to all operators. Our conclusion is that the consequences are trivial.

Scenario 9 shows that using VAT based on pre-tax fares and national reduced rates for all transport modes and on the Member State of departure would not have a significant impact (on fares, demand, and competitiveness between or within modes) compared to VAT based on final ticket prices. One further option would be to replace the already existing ticket taxes by VAT.

Scenario 10 argues that the introduction of a single window for passenger transport VAT issues might be desirable, but cannot be evaluated without a specific study. We argue that such a scheme could be offered on a voluntary basis and then assessed on the basis of accumulated experience.

Finally, Scenario 11, which is the closest to the principle of subsidiarity, in that it would only affect international travel, has minimal consequences on relevant variables affecting the demand or supply of passenger transport.

(25)

Table ES.2 – Overview of Assessment of Scenarios Scenario Description of VAT Scenario Distortions

Addressed Method of

Assessment Main Highlights

(comparison to the BAU Scenario) 1 The national standard rates will apply to outputs of all

modes of urban, other domestic, and intra-EU passenger transport.

1 Q Total transport demand declines by between 0.7% and 4.8%

by 2030 (for the EU28, with wide variations across Member States). Business demand, however, increases due to deductibility of VAT for business passenger transport purposes. VAT revenue almost trebles as a result of the increase to national standard rates. However, revenue of transport operators decreases by 3% (short term, full pass through) up to 10% (long term, limited pass through) when compared to the BAU Scenario. Economy-wide effects on GDP minor. Employment in the sector declines, sometimes substantially according to mode. Environmental effects are generally positive and proportional to the reduction in different forms of passenger transport modes.

2 The national reduced rates will apply to all modes of urban, other domestic, and intra-EU passenger transport.

If no reduced rate exists, the standard rate will apply.

1 Q Total transport demand declines slightly or increases slightly (depending on the scenario). The increase in VAT revenues is more modest than in Scenario 1 (about 23% for full pass- through in 2030), and so is the decline in revenues of operators. In some Member States, VAT revenues decline.

GDP effects are minimal.

Employment effects in the sector are also smaller than in Scenario 1.

3 As for Scenario 1, but with the place of taxation changed

to the Member State of departure/arrival. 1, 4a, 4d Q This Scenario extends Scenario 1. Results are identical except that a redistribution of revenues among Member States occurs, limited to revenues from international tariffs. Smaller Member States tend to see an increase in their revenues at the expense of the larger ones.

4 As for Scenario 2, but with the place of taxation changed

to the Member State of departure/arrival. 1, 4a, 4d Q Same as in Scenario 3, with very few differences.

(26)

5 Current VAT rates, but the place of taxation changed to

the Member State of departure/arrival. 4a, 4d Q Effects of Scenario consist of re-distribution of international travel revenues among Member States. In practice, the resulting changes are small, and no Member States gain or lose more than 1% of its revenues.

6 Exemptions according to Article 148 of the VAT

Directive abolished. 3a O Minimal effects on the air and sea transport industries, provided right of deduction is allowed.

7 Exemptions according to Article 148 of the VAT

Directive extended to buses and trains. 3a O Would allow the recovery of capital costs for buses and trains more speedily. Magnitude of the effect hard to estimate, but likely of minor importance.

8 As for Scenario 4, but with an obligation to VAT extended to extra-EU passengers departing from a Member State.

1, 4a, 4c, 4d

Q Relatively small impacts given that the long-term fare elasticities of demand are quite low.

9 As for Scenario 8, but with VAT applied to pre-tax fares

as for the Air Passenger Duty. 1, 4a, 4c,

4d O Relatively small impacts once all transport modes are liable for VAT at the same rates.

10 Implementation of One-Stop-Shop for all VAT

transactions. 4a, 4b D The reform would be desirable, although estimating its

quantitative impacts would require a separate study.

11 Current rates apply on all domestic transport, intra-and

extra-EU rates set to zero for all operators. 1d, 4b Q Minimal impact on PKM and on VAT revenues from this Scenario, given the low share of bus and rail in international travel.

Q = Quantitative; O = Order of Magnitude; D = Description.

(27)

Chapter 1. Introduction

This is the Final Report for the “Study on the economic effects of the current VAT rules for passenger transport,” under FWC No. TAXUD/2010/CC/104. This study was conducted by CASE (Center for Social and Economic Studies, Warsaw), IHS (Institute for Higher Studies, Vienna), and TML (Transport and Mobility, Leuven).

Objective

The objective of this study is to provide an economic assessment of the impact of current VAT regimes and the likely effects of alternative VAT regimes to assist the Commission in making policy choices.

Background

In December 2011, the Commission published its “Communication on the Future of VAT” ((COM2011) 851 Final). In the communication, the Commission sets out the fundamental features of a future VAT system and priority areas for further work. One key priority is a more efficient VAT system. For this, broadening the tax base and limiting the use of reduced rates would promote tax neutrality and improve economic governance either by generating new revenue streams or by facilitating a reduction in standard rates without adverse revenue consequences. For passenger transport activities, public consultation has confirmed that the current situation (where services are VAT exempt or subject to reduced rates in Member States, variable by means of transport involved) creates distortions of competition. Even where exemption or reduced rates do not apply, the complexity of current place-of-supply rules increase compliance costs (in particular, for activities that extend across two or more Member States) and may cause voluntary or involuntary non-compliance. Consultation responses highlighted two possible but conflicting approaches:

maintaining the status quo with minor changes to apply exemptions in a more uniform way or abolishing the exemptions. The latter option is more in line with the objective of increasing the neutrality and efficiency of the tax. The Commission's preference is for a more neutral, consistent, and simple VAT framework for passenger transport activities.

Passenger transport activities are always, in principle, subject to VAT. Nevertheless, the European Council’s VAT Directive has a range of provisions allowing for either exemptions or reduced rates. Several of these provisions flow from derogations accorded to Member States on the basis of exemptions already in place on 1 January 1978 or at the time of accession. These exemptions are in Articles 371 to 390 and Articles 390a and 390b. 16

Businesses supplying international passenger transport services across several Member States must be familiar with the specific VAT rules for each Member State. That these rules can vary depending on the means of transport used not only adds to its complexity, but is also at odds with neutrality (e.g. VAT may be due on coach services but not on airline services).

16 All legislative references are to Council Directive 2006/112, the VAT Directive.

Abbildung

Table ES.1 - Summary and Assessment of Distortions   Distortion  Description  Impact on PKM or  Operating  Costs  Comment  Assessment
Table ES.2 – Overview of Assessment of Scenarios  Scenario  Description of VAT Scenario  Distortions
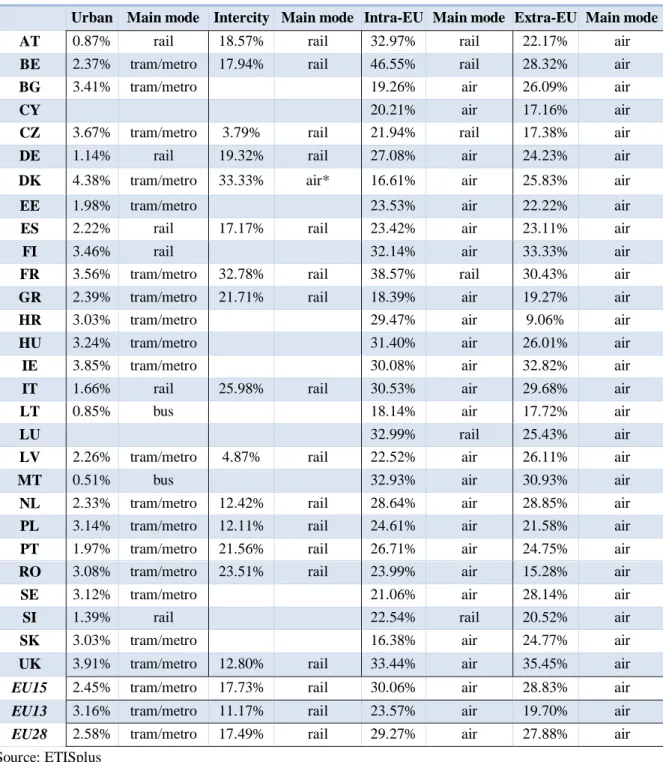
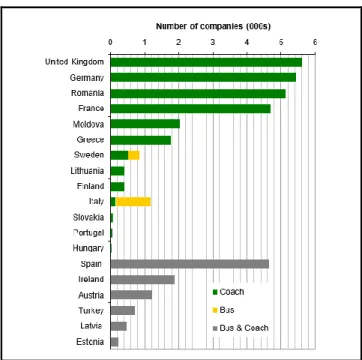
Table 2.4 - Market shares "Other domestic transport"
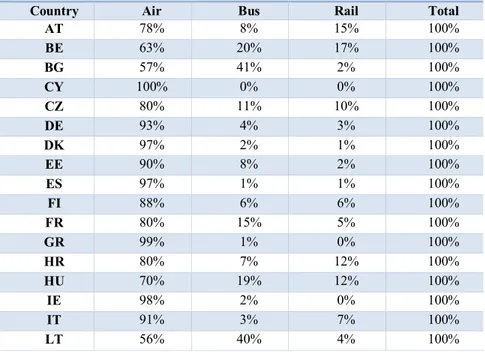
Table 2.10 – Business Passenger Transport
+7

Referenzen

ÄHNLICHE DOKUMENTE

The observed high network density brings with it a small unweighted centraliza- tion of the service networks, which contrasts with the high weighted centralization we find: while

In section 4.3 we show that the definition of new high-level domain entities, business rules and connections that were not anticipated, can also be expressed, without having to

In the African context, a range of interventions are required to create a more enabling environment including ‘know your rights’ campaigns, documentation of and

With the life-cycle analysis methodology, the Californian high-speed rail system (CAHSR) and three commercial aircraft models were compared, using MJ/PMT (Mega Joules

In Section 2.4 the infrastructure and rolling stock costs are simulated under several assumptions on demand, train capacity, speed and line length, simultaneously considering

The contribution of BS to the absolute change in total value added was much smaller than its contribution than in terms of employment growth. About one-eight of the overall EU15

They are defined as “net economic effects (e.g. on employment, incomes, government finances etc.) resulting from the contribution of air transport to tourism and trade

Moving to the asymmetric specification, it was found that the contribution of oil prices increases on manufacturing variation is greater than oil prices decreases Regarding