Multiple test procedures using an upper bound of the number of true hypotheses and their use for evaluating high-dimensional EEG data
Claudia Hemmelmann
a,∗, Andreas Ziegler
b, Volker Guiard
c, Sabine Weiss
d, Mario Walther
a, R¨udiger Vollandt
aaInstitute of Medical Statistics, Computer Sciences and Documentation, Friedrich Schiller University of Jena, Bachstraße 18, 07743 Jena, Germany
bInstitute of Medical Biometry and Statistics, University at L¨ubeck, Ratzeburger Allee 160, 23538 L¨ubeck, Germany
cResearch Unit Genetics and Biometry, Research Institute for the Biology of Farm Animals Dummerstorf, Wilhelm-Stahl-Allee 2, 18196 Dummerstorf, Germany
dInstitute of Cognitive Science, Neurobiopsychology, University of Osnabr¨uck, Albrechtstraße 28, 49046 Osnabr¨uck, Germany Received 5 October 2007; received in revised form 10 December 2007; accepted 22 December 2007
Abstract
Frequency analyses of EEG data yield large data sets, which are high-dimensional and have to be evaluated statistically without a large number of false positive statements. There exist several methods to deal with this problem in multiple comparisons. Knowing the number of true hypotheses increases the power of some multiple test procedures, however the number of true hypotheses is unknown, in general, and must be estimated.
In this paper, we derive two new multiple test procedures by using an upper bound for the number of true hypotheses. Our first procedure controls the generalized family-wise error rate, and thus is an improvement of the step-down procedure of Hommel and Hoffmann [Hommel G., Hoffmann T. Controlled uncertainty. In: Bauer P. Hommel G. Sonnemann E., editors. Multiple Hypotheses Testing, Heidelberg: Springer 1987;ISBN 3540505598:p. 154–61]. The second new procedure controls the false discovery proportion and improves upon the approach of Lehmann and Romano [Lehmann E.L., Romano J.P. Generalizations of the familywise error rate. Ann. Stat. 2005;33:1138–54]. By Monte-Carlo simulations, we show how the gain in power depends upon the accuracy of the estimate of the number of true hypotheses. The gain in power of our procedures is demonstrated in an example using EEG data on the processing of memorized lexical items.
© 2008 Elsevier B.V. All rights reserved.
Keywords:Coherence; EEG data; Multiple tests; Step-down procedure; Generalized family-wise error rate; False discovery proportion; Number of true hypotheses;
Average power
1. Introduction
EEG analysis procedures yield large sets of high-dimensional parameters, which have to be evaluated statistically. Thus there aremcomponents of the observational vector, which have to be tested simultaneously. If␣-level tests for each single component or endpoint of the observational vector were used then a large number of false positive statements results. However, there exist several techniques to cope with this general drawback in mul- tiple comparisons (see, e.g.,Hemmelmann et al., 2004, 2005).
Traditionally, multiple test procedures are designed to control the family-wise error rate (FWE). The FWE is the probability of
∗Corresponding author at: Institute of Medical Statistics, Computer Sciences and Documentation, University of Jena, Bachstraße 18, D-07740 Jena, Germany.
Tel.: +49 3641 933610; fax: +49 3641 933200.
E-mail address:claudia.hemmelmann@mti.uni-jena.de(C. Hemmelmann).
committing at least one type I error, i.e., FWE = P(V> 0). Here, Vdenotes the random number of rejected true hypotheses, i.e., of type I errors. In problems with high-dimensional data, the control of FWE appears to be too strict. The control of gener- alized family-wise error rate P(V>u), abbreviated as gFWE(u), i.e., the requirement P(V>u)≤αfor some pre-specified integer u (0≤u<m), is one of the recently proposed criteria for mul- tiple test problems when the number mof hypotheses is large (see, e.g.,van der Laan et al., 2004). A further important error rate is the so-called false discovery proportion, abbreviated as FDP(γ), for some pre-specifiedγ (0≤γ< 1) which was intro- duced byKorn et al. (2004)as well as others. The FDP(γ) is given as P(Q>γ), whereQ=V/RifR> 0, andQ= 0, ifR= 0, andR is the random number of rejected hypotheses. The false discov- ery rate FDR = E(Q), introduced by Benjamini and Hochberg (1995), is also a commonly used error rate. However its control, i.e., E(Q)≤α, does not preventQfrom attaining values much
0165-0270/$ – see front matter © 2008 Elsevier B.V. All rights reserved.
doi:10.1016/j.jneumeth.2007.12.013
greater thanαin single cases. This is a disadvantage of the FDR criterion as problems in interpretation may result. Therefore, we prefer the gFWE and the FDP criterion and we consider only these two error rates in this paper. For an overview and a discus- sion of the different error rates in multiple comparison problems, see, e.g.,Hemmelmann et al. (2005).
In this paper we propose improvements of two multiple test procedures, the gFWE procedure of Hommel and Hoffmann (1987)and the FDP procedure ofLehmann and Romano (2005), using an upper bound of the number of true hypotheses. Of course, the numberm0of true hypotheses is unknown in practice, and it needs to be estimated. But many approaches have been proposed for estimating the proportion of true hypotheses, and good overviews have been given, e.g., byBroberg (2005),Hsueh et al. (2003)andLangaas et al. (2005). For our new procedures, we only rely on an upper boundm∗0for the numberm0of true hypotheses, i.e., ensuring 1≤m0≤m∗0≤m, and thus does not discuss approaches for estimatingm0in detail. It should be noted that our procedures require an overestimate of the number of true hypotheses.
Our paper has the following aims: (a) to introduce the pro- cedures ofHommel and Hoffmann (1987) andLehmann and Romano (2005), (b) to improve these two methods by using an upper bound of the number of true hypotheses, (c) to demonstrate the resulting gain in power by Monte-Carlo simulations, and (d) to present the use of our new procedures in problems of multi- ple comparisons of coherence values obtained from EEG data recorded during the memory encoding of recalled or not-recalled abstract nouns (Weiss et al., 2000).
The procedures we discuss are not only specific to EEG data; they are equally applicable to the large data in MEG and fMRI.
2. Methods
2.1. Multiple tests
Holm’s (1979)step-down procedure for control of FWE is one of the most popular approaches to adjust for multiplic- ity. The elegance, simplicity, and robustness of this procedure have motivated several authors to develop further improvements.
Specifically,Hommel and Hoffmann (1987)and laterLehmann and Romano (2005) have derived modified constants for the stepwise comparison with thep-values which guarantee that the gFWE(u) does not exceed the significance levelαfor some pre- specified integeru (0≤u<m).Lehmann and Romano (2005) also modify Holm’s method for controlling the FDP(γ), i.e.
P(Q>γ)≤α(0≤γ< 1), under special conditions.
It is generally known that the power of FWE methods like those of the Bonferroni and Holm type can be improved if the number of true hypotheses is known (see, e.g., Hsueh et al., 2003). In a similar way, the power of the gFWE procedure of Hommel and Hoffmann (1987) and of the FDP procedure of Lehmann and Romano (2005) can be increased by utilizing information on the number m0 (m0≤m) of true hypotheses.
Throughout this work, we only consider step-down proce- dures.
2.1.1. The Hommel and Hoffmann method and its improvement
LetH1,. . .,Hm denote the hypotheses to be tested, and let p1,. . .,pm be the corresponding unadjustedp-values obtained with some appropriate tests. The orderedp-values and the cor- responding hypotheses are denoted byp(1)≤p(2)≤. . .≤p(m)
and by H(1), . . ., H(m). A step-down procedure compares the smallestp-valuep(1)withα1,p(2) withα2, etc., and continues rejecting hypotheses as long as their correspondingp-valuesp(i)
are smaller than or equal toαi. The step-down procedure of Holm (1979)compares the orderedp-valuesp(1),p(2),. . .,p(m)
withα1=α/m, α2=α/(m−1), . . ., αm=α. Holm’s procedure thus controls the FWE, i.e., P(V> 0)≤α.
An augmentation of Holm’s method which controls the gFWE(u) for all integersu(0≤u<m) instead of the FWE was introduced byHommel and Hoffmann (1987). Here, one com- paresp(i)with:
αHHi =
⎧⎪
⎨
⎪⎩
(u+1)α
m if 1≤i≤u+1 (u+1)α
m+u+1−i if u+1< i≤m
(1)
Now, an upper bound m∗0 for the number of true hypotheses such that 1≤m0≤m∗0≤mis given. We also assumem∗0> u, otherwise one can reject any hypotheses irrespective of itsp- values, becauseV ≤m0≤m∗0≤u, thus P(V>u) = 0. In the case ofm∗0≤uwe recommend a comparison of allp(i)withα. We can now improve Hommel and Hoffmann’s gFWE procedure as follows:
Statement 1. For fixed u≥0letm∗0> udenote a known upper bound for the number m0of true hypotheses(1≤m0≤m∗0≤ m).Then,the step-down procedure where p(i)is compared with
αHHi u=
⎧⎪
⎪⎨
⎪⎪
⎩
(u+1)α m∗0
if 1≤i≤m−m∗0+u+1 (u+1)α
m+u+1−i if m−m∗0+u+1< i≤m (2)
controls the gFWE(u). It thus guarantees P(V > u)≤αfor each integer u (0≤u < m).
It is obvious thatαHHi u ≥αHHi for alli= 1,. . .,m. The equal- ity holds fori > m−m∗0+u+1 and for alliifm∗0=m. The difference will be pronounced ifm∗0m.
The proof ofStatement 1is similar to the proof of Theorem 2.2 inLehmann and Romano (2005)and is given inAppendix A.
2.1.2. The Lehmann and Romano method and its improvement
Lehmann and Romano (2005) proposed a further modi- fication of Holm’s method which controls the FDP(γ), i.e., P(Q>γ)≤α for any γ (0≤γ< 1) under special conditions.
One condition is that the p-values of the m0 (m0≥1) true hypothesesqk(k= 1,. . .,m0) satisfy theSimes (1986)inequal- ity, i.e., P(m0
k=1{q(k)≤kα/m0})≤α. We point out that the Simes inequality holds true, e.g., for independent test statis- tics or for many positively dependent test statistics. Particularly,
it is fulfilled for multivariate normal distributions and central multivariatetdistributions with common and nonnegative cor- relations (Sarkar, 1998).
In the step-down procedure ofLehmann and Romano (2005) one comparesp(i)with
αLRi = (γi +1)α
m+ γi +1−i(i=1, . . . , m), (3) wherexis the largest integer≤x, and the other notation is as before. In the special case ofγ= 0, these levels are identical to αHHi given by Eq.(1) withu= 0 and consequently identical to Holm’s.
If an upper boundm∗0for the numberm0of true hypotheses is known, the procedure ofLehmann and Romano (2005)for the FDP(γ) can be improved as follows:
Statement 2. For fixedγ∈[0, 1)letm∗0denote a known upper bound for the number m0of true hypotheses(1≤m0≤m∗0≤ m).Furthermore, suppose that theSimes (1986)inequality holds for the p-values of the true hypotheses. Then the step-down procedure where p(i)is compared with
αLRi u=
⎧⎪
⎪⎨
⎪⎪
⎩
(γi +1)α m∗0
if 1≤m∗0≤m+ γi +1−i (γi +1)α
m+ γi +1−i if m+ γi +1−i < m∗0 (4) controls the FDP(γ). It thus guarantees P(Q >γ)≤α for 0≤γ< 1.
Thus,αLRi u≥αLRi for alli= 1,. . .,m. The equality holds for m+ γi +1−i < m∗0and for alliifm∗0=m. The difference will be pronounced ifm∗0m.
Furthermore, if one comparesαHHi (Eq.(1)) with αLRi (Eq.
(3)) andαHHi u(Eq.(2)) withαLRi u(Eq.(4)) it is clear that these levels are stepwise identical depending onγ(γ∈[0,1)) for suc- cessiveu= 0, 1, 2,. . .. For example, forγ= 0.1 theαLRi andαLRi u (i= 1,. . ., 9) are identical toαHHi andαHHi u (i= 1,. . ., 9) with u= 0,αLRi andαLRi u (i= 10,. . ., 19) are identical toαHHi and αHHi u(i= 10,. . ., 19) withu= 1, etc. In particular,αLR1 =α/m andαLR1 u=α/m∗0 for anyγ∈[0,1) and these are identical to αHH1 andαHH1 uwithu= 0 (i.e., equal to Holm’ method), respec- tively. This is a disadvantage compared to the gFWE methods foru> 0 whereαHH1 =(u+1)α/mandαHH1 u=(u+1)α/m∗0.
Lehmann and Romano (2005) also suggest a FDP method without any dependence assumption, and they replaceαLRi by αLRi ∗=αLRi /(γm+1
k=1 k−1). We can thus deduce the following corollary:
Corollary. A step-down procedure with levels αLRi u∗= αLRi u/(c
k=1k−1), whereαLRi u as defined inEq. (4) and c= min{γm +1, m∗0},controls theFDP(γ) for anyγ(0≤γ< 1) and for any dependence of the p-values.
Similarly to the proposed gFWE method, one can reject all mhypotheses irrespective of theirp-values ifm∗0≤γm, because V/R=m0/m≤m∗0/m≤γ, thus P(Q>γ) = 0. However, we want to accept null hypotheses with largep-values and thus our
proposed procedures do not utilize this. The proofs ofStatement 2and its corollary are given inAppendix A.
2.2. Simulated data and real data (EEG data) 2.2.1. Simulated data
Data were simulated using the following model: Letm1be the number of false hypotheses and thusm=m0+m1. We generated m-dimensional normal distributed random vectorsxj∼N(μ,) (j= 1,. . .,n) with meansμ= (μ1,. . .,μm)’, whereμi= 1.5 for i= 1,. . .,m1andμi= 0 fori=m1+ 1,. . .,mand= (ρik) for i,k= 1,. . .,m. The numberm1of false hypotheses was varied between 1 andm−1.p-Values were calculated from two-sided one-samplet-tests, i.e., test the null hypotheses:μi= 0, for each component. We chose n= 8 and m= 100, and we considered the following cases of constant correlation coefficients:ρik= 0, ρik= 0.2,ρik= 0.5,ρik= 0.8 andρik= 0.9 fori,k= 1,. . .,mand i=k. The number of replicates was 60,000, and the significance level was set toα= 0.05.
2.2.2. EEG data
The experimental setup and the methods of EEG analysis have been described in detail elsewhere (Weiss et al., 2000;
Weiss and Rappelsberger, 2000). In brief, the EEG data are m= 171 coherence values fromn= 23 female German native speakers, see, e.g.,Hemmelmann et al. (2005). They auditorily perceived two wordlists each containing 25 disyllabic abstract nouns. Participants had to memorize the nouns and they were asked to recall the words previously encoded immediately after the presentation of each list. The pairs of electrodes showed dif- ferences in their means of coherence values for the subsequently recalled versus non-recalled nouns for the delta1 (1–2 Hz) fre- quency band.
The goal of our analysis was to identify the electrode pairs with significant coherence differences.p-Values were calculated from two-sided pairedt-tests for each component. For applying our new procedures to the EEG data we estimated the upper bound m∗0 of the number of true hypotheses by using the per- mutation method of Meinshausen and B¨uhlmann (2005)with the quantile bounding function, because this approach ensures P(m∗0≥m0)≥1−β for a specified confidence level 1−β under general dependence structures. Applied to our EEG data, we obtainedm∗0=95 for 1−β= 0.95 with this method.
3. Results
3.1. Power comparisons
Simulations were performed to demonstrate the increase in power gained by our methods, which utilize information on the numberm0 of true hypotheses. For the FDP method we used Statement 2. The standard criterion for evaluating test proce- dures is the average power (Korn et al., 2004; Kwong et al., 2002;
Troendle, 2000) which is the expected proportion of rejected hypotheses among the false hypotheses.
We estimated the average power of the original procedures and of our improved procedures for u= 5 and γ= 0.1 with
Fig. 1. Estimated average power of the original procedure (lower solid line) and our improved procedure withm∗0=m0+m1/2 (. . .),m∗0=m0+m1/4 (–·–·), m∗0=m0+m1/8 (– – –),m∗0=m0(upper solid line) andm∗0of the method ofMeinshausen and B¨uhlmann (2005)(circle) for controlling of gFWE(5) (left side) and FDP(0.1) (right side) andρik= 0.5.
ρik= 0.5 (Fig. 1). Form∗0in formulae(2)and(4), we used the fol- lowing values:m∗0=m0,m∗0=m0+m1/8,m∗0=m0+m1/4 and m∗0=m0+m1/2. In addition, we used the method of Meinshausen and B¨uhlmann (2005)to obtain a furtherm∗0. As expected, our improvements resulted in a gain in power, and we obtained the maximum gain in power withm∗0=m0assuming thatm0≤m∗0≤m(seeFig. 1). This gain increased with increas- ingm1and with a decrease of the overestimation ofm0. As it can be seen inFig. 1, the method ofMeinshausen and B¨uhlmann (2005)also resulted in a gain in power.
3.2. Certainty by underestimation of the number of true hypotheses
Thus far we have considered the gain of power of our pro- posed procedures if the assumptionm0≤m∗0≤mholds true.
We also explored the case that the assumptionm0≤m∗0≤mis incorrect, i.e., the number of true hypotheses is underestimated.
Specifically, we investigated by how much the number of true hypotheses may be underestimated, where the significance level held, i.e., gFWE(u)≤α and FDP(γ)≤α, respectively. Fig. 2
shows the error rates foru= 5 andγ= 0.1 withn= 8,m= 100, m0= 50, and m∗0 was varied between 5 and m for different constant correlation coefficients. The resulting values exceeded α= 0.05 approximately form∗0<15. Thus, the maximum num- ber of underestimations ofm0, abbreviated by MNU, is about 35. The MNU can be defined as formal MNU = max{j= 1,. . ., m0−1:m∗0=m0−j whereas gFWE(u)≤αand FDP(γ)≤α for the proposed procedures ofStatements 1 and 2, respectively}.
Table 1shows the MNU for other values ofm0,uandγfor the “worst case” of the constant correlation coefficients, i.e., for the other correlation coefficients the MNU can be larger.
For controlling the gFWE(u), the proportion of the MNU amongm0is approximately at least 60% and appears to be inde- pendent ofuifu> 0. Ifu= 0 (identical to Holm’s method) then no underestimation was allowed (not shown here). Furthermore, the proportion of the MNU amongm0is not independent ofγ for controlling of the FDP(γ), e.g., in analogy to Holm’s method no underestimation was allowed forγ= 0.01.
To summarize, we have demonstrated that the assumption m0≤m∗0≤mmay be violated in some cases, and thatm0may be underestimated by up to 2/3 without violating the significance
Fig. 2. Estimated gFWE(5) (left side) and FDP(0.1) (right side) for our improved procedures form0= 50 and different constant correlation coefficients for correctly and incorrectly assumed upper bounds of the number of true hypotheses.
Table 1
List of MNU for the “worst case” of the correlation. The percentages (%) are in parenthesis
m0= 20 m0= 50 m0= 80
gFWE(u) u= 1 12 (60) forρ= 0.5 31 (62) forρ= 0.5 51 (63.7) forρ= 0.5
u= 3 13 (65) forρ= 0.8 34 (68) forρ= 0.8 58 (72.5) forρ= 0.8
u= 5 13 (65) forρ= 0.9 35 (70) forρ= 0.8 58 (72.5) forρ= 0.8
u= 10 12 (60) forρ= 0.9 33 (66) forρ= 0.9 56 (70.0) forρ= 0.8
u= 15 12 (60) forρ= 0.9 32 (64) forρ= 0.9 55 (68.7) forρ= 0.9
FDP(γ) γ= 0.01 0 (0) forρ= 0 0 (0) forρ= 0 0 (0) forρ= 0
γ= 0.03 12 (60) forρ= 0.5 0 (0) forρ= 0.2 0 (0) forρ= 0
γ= 0.05 13 (65) forρ= 0.8 30 (60) forρ= 0.5 0 (0) forρ= 0
γ= 0.1 12 (60) forρ= 0.9 36 (72) forρ= 0.8 25 (31.2) forρ= 0.2
γ= 0.15 12 (60) forρ= 0.9 36 (72) forρ= 0.8 51 (63.7) forρ= 0.5
level. These results were also confirmed by further simulations including other dimensions ofm, or mixed positive and nega- tive correlation coefficientsρik. Details are available from the corresponding author. However, we point out that nevertheless an estimation method which overestimates the number of true hypotheses with a strong certainty should be used, because mul- tiple test procedures have to be valid for a multitude of parameter configurations. In order to ensure this, test procedures are often conservative for specific situations. This does not exclude that they hold up well in other situations. In these cases, an underes- timation of the bound might be misleading.
3.3. Applications of multiple tests to EEG coherence data The data we now evaluate are from the experiment described in Section2.2.2. For the significance levelα= 0.05Table 2dis- plays the number of significant coherence differences for the original gFWE and FDP methods and for the proposed improved procedures. For controlling the FDP(γ) we used the method of Statement 2 again. The FDP method of the corollary is very conservative and results only in a gain in power compared to the Holm method if the number of false hypotheses is very large.
Of course, the number of rejected hypotheses is small with both methods, given that there are at least m−m∗0= 76 false hypotheses. Possibly, many coherence differences between recalled and non-recalled nouns are too small and
Table 2
Number of significant coherence differences when applying the original proce- dures and the proposed improved procedures withm∗0=95 (α= 0.05)
Original approach New approach
gFWE(u)≤0.05
0 6 8
1 9 13
2 12 15
5 15 23
10 25 37
FDP(γ)≤0.05
0.01 6 8
0.05 6 8
0.10 6 8
0.15 9 15
0.20 12 18
the corresponding variances are too large. But our improved procedure yields at least 25% more rejections when control- ling the gFWE(u) and at least 33% more when controlling the FDP(γ).
As noted in Section2.1.2the first levels of the FDP meth- ods are identical to the first levels of Holm’s method. Therefore, the FDP methods do not reject more hypotheses than the gFWE methods withu= 0 if they do not reject enough hypotheses to compare the p-values with the levels in analogy to u= 1. For example, the FDP methods with γ= 0.1 cannot reject more hypotheses than the gFWE methods with u= 0, if the corre- sponding gFWE method withu= 0 reject less than 9 hypotheses because the first 9 levels are identical. But the 10th levels of the FDP methods are identical to the 10th levels of the gFWE methods withu= 1.
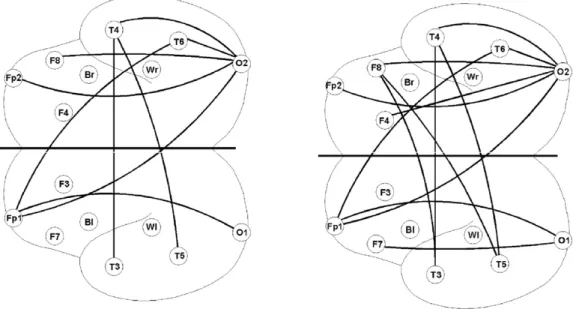
The improved procedure both supports and extends signifi- cant findings of the original approach. While processing of both subsequently recalled and non-recalled nouns elicited higher coherence at anterior sites, only the recalled nouns were asso- ciated with enhanced coherence between the distant frontal and posterior (temporal, parietal and occipital) electrodes of both hemispheres. The improved statistical procedure (with u= 1) emphasizes these findings by showing an additional coherence increase between frontal and temporal/occipital electrode pairs.
Specifically, frontal electrodes are activated, which supports the well-known role of the frontal cortex in memory processes (Tulving et al., 1994). The improved procedure also stresses the interhemispheric fronto-temporal coherence increase, which could not be found with the original statistical approach (see Fig. 3).
4. Discussion
In this article we have described the improvements of the step-down procedures of Hommel and Hoffmann (1987)and Lehmann and Romano (2005) for testing multiple hypotheses if an upper boundm∗0 for the numberm0of true hypotheses is available. Alternative methods that also control the gFWE(u) and the FDP(γ) can be found inKorn et al. (2004),van der Laan et al. (2004)as well as others. However, the method of Korn et al. (2004)is based on permutation tests and is very complex.
Possibly, these procedures can be improved in a similar way if an upper boundm∗0for the numberm0of true hypotheses is known.
Fig. 3. View on the top of the unfolded hemispheres with electrodes used (circles) and lines denoting significant coherence differences. Left side: Hommel and Hoffmann method. Right side: our improved procedure (u= 1,α= 0.05).
However, more work is needed to address the question of how these procedures can be improved.
In this work we assume thatm∗0≥m0is available. In recent years many different estimation methods ofm0have been intro- duced, e.g., byBenjamini and Hochberg (2000),Nettleton et al.
(2006),Schweder and Spjotvoll (1982),Storey (2002),Storey et al. (2004)andTurkheimer et al. (2001). But these methods do not ensure that the number of true hypotheses is overesti- mated. In contrast, the methods ofMeinshausen and B¨uhlmann (2005)andMeinshausen and Rice (2006)are constructed to hold P(m∗0≥m0)≥1−βfor a specified confidence level 1−β, i.e., they overestimated the number of true hypotheses. Therefore, we used the method ofMeinshausen and B¨uhlmann (2005)to evaluate the EEG data. When using this method to computem∗0 then the corresponding error rate was always controlled in our simulation analysis.
Other methods exist to control the false discovery rate which estimatem0in the first step, for example the method of Benjamini et al. (2006)and the method “significance analysis of microarrays” ofTusher et al. (2001). In contrast to our proce- dures, the estimation ofm0is an inherent part in these methods.
We have shown theoretically and by Monte-Carlo simulations that our new procedures are more powerful than the original pro- cedures byHommel and Hoffmann (1987) andLehmann and Romano (2005)if m∗0m. Furthermore, we have illustrated by an example using EEG data that our proposed procedures reject more hypotheses than the original procedures. It could be shown that the coherence difference between recalled and non- recalled nouns is emphasized by additional significant coherence changes. In particular, an increased relationship between sig- nals at right frontal and left temporal electrodes is indicated by our method. Frontal and temporal regions have frequently been shown to be involved with memory formation of words (Wagner et al., 1998). Thus, the improved statistical procedure allows us to detect additional coherence changes important for the interpretation of cognitive findings.
Acknowledgements
We are grateful to Manfred Horn for helpful discussions and for many valuable suggestions that greatly improved the clarity of the paper. We would also like to thank the referees for their helpful comments. This work was supported by the Deutsche Forschungsgemeinschaft (VO 683/2-1).
Appendix A
Letq(1)≤. . .≤q(m0)denote the orderedp-values of them0
true hypotheses.
Proof of Statement 1. No proof is required for m0<u+ 1.
Therefore, we considerm0≥u+ 1. Letjbe the smallest random index satisfyingp(j)=q(u+1), sou+ 1≤j≤m−m0+u+ 1. With αHHi u of Eq. (2), we have gFWE(u)=P(V>u)=P(p(1)≤ αHH1 u, . . ., p(j)≤αHHj u)≤P(P(j)≤αHHj u) for the step-down procedure. Thus, we only need to considerp(j)≤αHHj u. The following case differentiation for j is the only modifica- tion of the proof of Theorem 2.2 in Lehmann and Romano (2005).
• Case 1: letu+1≤j ≤m−m∗0+u+1.
It follows q(u+1)=p(j)≤αHHj u=(u+1)α/m∗0≤(u+ 1)α/m0.
• Case 2: letm−m∗0+u+1< j≤m−m0+u+1. It follows q(u+1) =p(j)≤αHHj u=(u+1)α/(m+u+ 1−j)≤(u+1)α/m0.
In both casesp(j)≤αHHj uimpliesq(u+1)≤(u+ 1)α/m0, so that gFWE(u)≤P(q(u+1)≤(u+ 1)α/m0). Hommel and Hoffmann (1987) and Lehmann and Romano (2005) (proof of Theo- rem 2.1(i)) have shown gFWE(u)≤m0α/mwhenmhypotheses were tested using a single-step method with constant levels (u+ 1)α/m. Thus, gFWE(u)≤αwhen replacing αby αm/m0,
i.e., using constant levels (u+ 1)α/m0. We therefore finally have P(q(u+1)≤(u+ 1)α/m0)≤α.
Proof of Statement 2 and of Corollary. The proof of Statement 2 is a direct consequence of Lehmann and Romano (2005) (proof of Theorem 3.2). The range of γi (0≤γ< 1; 1≤i≤m) is divided into γi< 1, 1≤γi< 2, . . ., γm ≤γi<γm+ 1. Let j≤m be the smallest random index where the proportion of false rejections Q exceeds γ for the first time. Then:
p(j)≤αLRj u, H(j) is true and γj+ 1≤m0. We thus have FDP(γ) = P(Q>γ)≤P({γj< 1}∪{1≤γj< 2}∪. . .∪{b−1≤γj
<b}) withb= min{γm+ 1,m0}.
Letk−1≤γj<kfor anyk∈{1,. . .,b}. Thenp(j)=q(k)≤ αLRj u because (k−1)/j≤γ and k/j>γ. This implies thatH(j)
is thekth rejected true hypothesis, andk≤j≤m−m0+k. We consider the case differentiation forjin analogy to the proof of Statement 1.
• Case 1: let k≤j≤m−m∗0+k, thus m∗0≤m+k−j= m+ γj +1−j and, according to Eq. (4), q(k)=p(j)≤ αLRj u=(γj +1)α/m∗0≤kα/m0.
• Case 2: letm−m∗0+k < j≤m−m0+k, thusm0≤m+ γj +1−j < m∗0and, according to Eq.(4),q(k)=p(j)≤ αLRj u=(γj +1)α/(m+ γj +1−j)≤ mkα0.
Next, k−1≤γj<k implies q(k)≤kα/m0 for any k∈{1, . . .,b}, so that FDP(γ)=P(Q > γ)≤P({γj <1} ∪ {1≤γj <
2} ∪. . .∪ {b−1≤γj < b})≤P(b
k=1{q(k)≤kα/m0}). The step-down procedure withαLRi ufrom Eq.(4)thus con- trols the FDP(γ) by αif the Simes inequality is true for the p-valuesq1, . . . , qm0 of them0true hypotheses.
Furthermore, the inequality of Hommel (1983) P(m0
k=1{q(k)≤kα/m0})≤αm0
k=1k−1 and its general- ization by Lehmann and Romano (2005) P(s
k=1{q(k)≤ βk})≤m0
s
k=1(βk−βk−1)k−1 with any s≤m0, and 0 =β0≤β1≤. . .≤βs≤1 hold for any dependency of qk
for k= 1, . . ., m0. From b= min{␥m+ 1, m0} it fol- lows P(b
k=1{q(k)≤kα/m0})≤m0b
k=1(kα/m0−(k− 1)α/m0)k−1=αb
k=1k−1≤αc
k=1k−1which completes the proof of the corollary.
References
Benjamini Y, Hochberg Y. Controlling the false discovery rate: a practical and powerful approach to multiple testing. J Roy Stat Soc Ser B Stat Methodol 1995;57:289–300.
Benjamini Y, Hochberg Y. On the adaptive control of the false discovery fate in multiple testing with independent statistics. J Educ Behav Stat 2000;25:60–83.
Benjamini Y, Krieger AM, Yekutieli D. Adaptive linear step-up procedures that control the false discovery rate. Biometrika 2006;93:491–507.
Broberg P. A comparative review of estimates of the proportion unchanged genes and the false discovery rate. BMC Bioinformatics 2005:6.
Hemmelmann C, Horn M, Reiterer S, Schack B, S¨uße T, Weiss S. Multivariate tests for the evaluation of high-dimensional EEG data. J Neurosci Methods 2004;139:111–20.
Hemmelmann C, Horn M, S¨uße T, Vollandt R, Weiss S. New concepts of multiple tests and their use for evaluating high-dimensional EEG data. J Neurosci Methods 2005;142:209–17.
Holm S. A simple sequentially rejective multiple testing procedure. Scand J Stat 1979:65–70.
Hommel G. Tests of the overall hypothesis for arbitrary dependence structures.
Biom J 1983;25:423–30.
Hommel G, Hoffmann T. Controlled uncertainty. In: Bauer P, Hommel G, Sonne- mann E, editors. Multiple Hypotheses Testing. Heidelberg: Springer; 1987.
p. 154–61.
Hsueh H-M, Chen JJ, Kodell RL. Comparison of methods for estimating the number of true null hypotheses in multiplicity testing. J Biopharm Stat 2003;13:675–89.
Korn EL, Troendle JF, McShane LM, Simon R. Controlling the number of false discoveries: application to high-dimensional genomic data. J Stat Plan Infer 2004;124:379–98.
Kwong KS, Holland B, Cheung SH. A modified Benjamini–Hochberg multiple comparisons procedure for controlling the false discovery rate. J Stat Plan Infer 2002;104:351–62.
Langaas M, Lindqvist BH, Ferkingstad E. Estimating the proportion of true null hypotheses, with application to DNA microarray data. J Roy Stat Soc Ser B Stat Methodol 2005;67:555–72.
Lehmann EL, Romano JP. Generalizations of the familywise error rate. Ann Stat 2005;33:1138–54.
Meinshausen N, B¨uhlmann P. Lower bounds for the number of false null hypotheses for multiple testing of associations under general dependence structures. Biometrika 2005;92:893–907.
Meinshausen N, Rice J. Estimating the proportion of false null hypothe- ses among a large number of independently tested hypotheses. Ann Stat 2006;34:373–93.
Nettleton D, Hwang JTG, Caldo RA, Wise RP. Estimating the number of true null hypotheses from a histogram ofp-values. J Agric Biol Environ Stat 2006;11:337–56.
Sarkar SK. Some probability inequalities for ordered MTP2random variables:
a proof of the Simes conjecture. Ann Stat 1998;26:494–504.
Schweder T, Spjotvoll E. Plots ofP-values to evaluate many tests simultaneously.
Biometrika 1982;69:493–502.
Simes RJ. An improved Bonferroni procedure for multiple tests of significance.
Biometrika 1986;3:751–4.
Storey JD. A direct approach to false discovery rates. J Roy Stat Soc Ser B Stat Methodol 2002;64:479–98.
Storey JD, Taylor JE, Siegmund D. Strong control, conservative point estimation and simultaneous conservative consistency of false discovery rates: a unified approach. J Roy Stat Soc Ser B Stat Methodol 2004;66:187–205.
Troendle JF. Stepwise normal theory multiple test procedures controlling the false discovery rate. J Stat Plan Infer 2000;84:139–58.
Tulving E, Kapur S, Craik FIM, Moscovitch M, Houle S. Hemispheric encod- ing/retrieval asymmetry in episodic memory: positron emission tomography findings. Proc Natl Acad Sci USA 1994;91:2016–20.
Turkheimer FE, Smith CB, Schmidt K. Estimation of the number of “true”
null hypotheses in multivariate analysis of neuroimaging data. Neuroimage 2001;13:920–30.
Tusher VG, Tibshirani R, Chu G. Significance analysis of microarrays applied to the ionizing radiation response. Proc Natl Acad Sci USA 2001;98:5116–21.
van der Laan MJ, Dudoit S, Pollard KS. Augmentation procedures for control of the generalized family-wise error rate and tail probabilities for the proportion of false positives. Stat Appl Genet Mol Biol 2004:3.
Wagner AD, Schacter DL, Rotte M, Koutstaal W, Maril A, Dale AM, et al.
Building memories: remembering and forgetting of verbal experiences as predicted by brain activity. Science 1998;281:1188–91.
Weiss S, Rappelsberger P. Long-range EEG synchronization during word encoding correlates with successful memory performance. Cogn Brain Res 2000;9:299–312.
Weiss S, M¨uller HM, Rappelsberger P. Theta synchronization predicts effi- cient memory encoding of concrete and abstract nouns. NeuroReport 2000;11:2357–61.