The Indus Basin of Pakistan
The Impacts of Climate Risks on Water and Agriculture
Winston Yu, Yi-Chen Yang, Andre Savitsky, Donald Alford, Casey Brown, James Wescoat, Dario Debowicz, and Sherman Robinson
The I ndus Basin of P ak istan
D I R E C T I O N S I N D E V E L O P M E N T Countries and Regions
Yu, Yang, Savitsky, Alford, Brown, Wescoat, Debowicz, and RobinsonTHE WORLD BANK
Recent times have been volatile in Pakistan’s Indus Basin. In 2009, a weak summer monsoon created drought conditions throughout the country, exacerbating an already tenuous situation for many rural households faced with high fuel and fertilizer costs and the impacts of rising global food prices. Then catastrophic monsoon flooding in 2010 affected more than 20 million people, laying devastation to their housing, infrastructure, and crops. Damages from this single flood event were estimated at US$10 billion, half of which were losses in the agriculture sector alone.
It is timely, if not critical, to focus on climate risks for water, agriculture, and food security in this region.
The Indus Basin of Pakistan: The Impacts of Climate Risks on Water and Agriculture presents a greatly needed investigation into the extent to which the country is resilient to such shocks. The authors use several different modeling environments—among the best mathematical representations available—to describe the physical and economic responses to future exogenous climate risks, including hydrologic models, an agro-economic optimization model of the irrigation system, and a computable general-equilibrium model of Pakistan’s economy. The integrated systems framework used in this study provides a broad and unique approach to estimating the hydrologic and crop impacts of climate change risks, the macro-economic and household- level responses, and an effective method for assessing a variety of adaptation investments and policies.
A better understanding of how the climate, water, and agriculture sectors are linked will help decision makers plan for future investments. The authors integrate the insights of multiple disciplines to benefit the assessment of future climate impacts in this region. The assessment approach developed in this volume will help to sharpen critical policies and interventions by the Pakistan government, especially, and will be a resource to professionals and students of water and agricultural sector management everywhere.
ISBN 978-0-8213-9874-6
Public Disclosure AuthorizedPublic Disclosure AuthorizedPublic Disclosure AuthorizedPublic Disclosure Authorized
77022
The Indus Basin of Pakistan
Countries and Regions
The Indus Basin of Pakistan
The Impacts of Climate Risks on Water and Agriculture
Winston Yu, Yi-Chen Yang, Andre Savitsky, Donald Alford, Casey Brown,
James Wescoat, Dario Debowicz, and Sherman Robinson
Telephone: 202-473-1000; Internet: www.worldbank.org Some rights reserved
1 2 3 4 16 15 14 13
This work is a product of the staff of The World Bank with external contributions. Note that The World Bank does not necessarily own each component of the content included in the work. The World Bank therefore does not warrant that the use of the content contained in the work will not infringe on the rights of third parties. The risk of claims resulting from such infringement rests solely with you.
The findings, interpretations, and conclusions expressed in this work do not necessarily reflect the views of The World Bank, its Board of Executive Directors, or the governments they represent. The World Bank does not guarantee the accuracy of the data included in this work. The boundaries, colors, denominations, and other information shown on any map in this work do not imply any judgment on the part of The World Bank concerning the legal status of any territory or the endorsement or acceptance of such boundaries.
Nothing herein shall constitute or be considered to be a limitation upon or waiver of the privileges and immunities of The World Bank, all of which are specifically reserved.
Rights and Permissions
This work is available under the Creative Commons Attribution 3.0 Unported license (CC BY 3.0) http://creativecommons.org/licenses/by/3.0. Under the Creative Commons Attribution license, you are free to copy, distribute, transmit, and adapt this work, including for commercial purposes, under the following conditions:
Attribution—Please cite the work as follows: Yu, Winston, Yi-Chen Yang, Andre Savitsky, Donald Alford, Casey Brown, James Wescoat, Dario Debowicz, and Sherman Robinson. 2013. The Indus Basin of Pakistan: The Impacts of Climate Risks on Water and Agriculture. Washington, DC: World Bank.
doi: 10.1596/978-0-8213-9874-6. License: Creative Commons Attribution CC BY 3.0
Translations—If you create a translation of this work, please add the following disclaimer along with the attribution: This translation was not created by The World Bank and should not be considered an official World Bank translation. The World Bank shall not be liable for any content or error in this translation.
All queries on rights and licenses should be addressed to the Office of the Publisher, The World Bank, 1818 H Street NW, Washington, DC 20433, USA; fax: 202-522-2625; e-mail: pubrights@worldbank.org.
ISBN (paper): 978-0-8213-9874-6 ISBN (electronic): 978-0-8213-9875-3 DOI: 10.1596/978-0-8213-9874-6
Cover photo: Donald Alford; Cover design: Naylor Design.
Library of Congress Cataloging-in-Publication Data Yu, Winston H.
The Indus Basin of Pakistan : the impacts of climate risks on water and agriculture / Winston Yu, Yi-Chen Yang, Andre Savitsky, Donald Alford, Casey Brown, James Wescoat, Dario Debowicz, and Sherman Robinson.
p. cm.
Includes bibliographical references.
ISBN 978-0-8213-9874-6 — ISBN 978-0-8213-9875-3 (electronic)
1. Climatic changes—Pakistan. 2. Crops and climate—Pakistan 3. Water resources development—
Environmental aspects—Pakistan. 4. Indus River Watershed—Economic conditions. 5. Indus River Watershed—Environmental conditions. I. World Bank. II. Title.
QC903.2.P18Y82 2013
551.48095491—dc23 2013008111
Acknowledgments xiii
About the Authors xv
Abbreviations xvii
Executive Summary 1
Study Objective 2
Policies and Plans 3
Upper Indus Basin Hydrology and Glaciers 4
Future Climate Scenarios 6
Modeling Water, Climate, Food, and the Economy 7
Climate Risk Scenarios 8
Adaptation Investment Scenarios 10
Conclusions 14 Note 14 References 15
Chapter 1 Two Years in the Life of the Indus River Basin 17Background and Problem Statement 17
Difficult Years for the Indus Basin: 2009–11 23 Study Approach: A Framework for Integrated Water
and Agriculture Assessment 29
Note 31 References 31
Chapter 2 The Current Water and Agriculture Context,Challenges, and Policies 35
Key Messages 35
Limited Water Storage 36
Problematic Trends in Surface Water and Groundwater
Usage 37
Inflexible and Uncertain Water Allocation Institutions 42
Low Water-Use Efficiencies and Productivity 46
National Policies and Plans on Water and Agriculture 47
Notes 52
References 53
Chapter 3 Hydrology and Glaciers in the Upper Indus Basin 57
Key Messages 57
The Indus River 58
Hydrology of the Upper Indus Basin 61
Glacier Climates of the Upper Indus Basin 63 Distributed Process Models of Glaciers
and Total Basin Runoff 65
Climate and Stream Flow Variability in
the Upper Indus Basin 72
Note 75 References 75
Chapter 4 Future Climate Scenarios for the Indus Basin 77Key Messages 77
Overview of Historical Patterns and Trends 78
Future Climate Change Risks 86
Future Climate in the Indus Basin Irrigation System 86 Future Climate in the Upper Indus Basin 90 Notes 91 References 92
Chapter 5 Modeling Water, Climate, Agriculture, and the Economy 95 Section 1: Indus Basin Model Revised (IBMR-2012)95
Economic Objective 95
Water Balance 97
Input Data, Equations, Constraints, and Output Data 99
Baseline: Year 2008/09 106
Section 2: Computable General Equilibrium Model
108
CGE Model Structure 108
Social Accounting Matrix for Pakistan 114
Integration of the Two Models 116
Model Limitations 116
Notes 117 References 117
Chapter 6 Sensitivity and Scenario Results 119Key Messages 119
Sensitivities of Hydrologic Parameters
and the DIVACRD Constraint 120
Future Climate Risk Scenarios 123
Adaptation Investment Scenario Analyses 130
Environmental Issues 137
References 142
Chapter 7 The Way Forward 145
Key Messages 146
Final Thoughts 148
Appendix A Structure of IBMR 151
Description of 12 Agro-Climatic Zones 151
Appendix B IBMR Updating to IBMR 2008 155
Model Structure Change: The Lateral
Groundwater Flow in IBMR 155
Model Structure Change: The Refined Sugar
and Sugar Cane Issue 156
Model Structure Change: Removed Variables
and Equations in IBMR 2008 156
Data Updating 157
IBMR Model Diagnosis 157
References 162
Appendix C Details of the Pakistan Social Accounting Matrix (SAM) 163Figures
ES.1 Contributions of Snowmelt and Ice Melt to Total Runoff for
Sub-Basins in the Upper Indus Basin 5
ES.2 CGE and IBMR Economic Outcomes under Climate
Risk Scenarios 9
ES.3 Different Household Income Changes under Climate
Risk Scenarios 9
ES.4 Crop Production Changes under Climate Risk Scenarios 10 ES.5 Cumulative Distribution Functions of IBMR-2012 Objective
Value for Different Adaptation Investments (without
Climate Risk Scenarios) 11
ES.6 Sector Outcomes for Adaptation Investments under
Climate Change Conditions 12
1.1 Value and Growth of Agricultural Production 20 1.2 Pakistan per Capita Food Supply, 1961–2009 23
1.3 Agriculture Prices, 2000–09 24
1.4 Framework for Integrated Water and Agriculture Assessment 30 2.1 Water Storage per Capita in Semi-Arid Countries 36
2.2 Water Storage per Capita over Time 37
2.3 Pakistan Population Prospects under Low, Medium,
and High Scenarios 38
2.4 Growth in Use of Tubewells, 1960–2003 39
2.5 Growing Role of Groundwater Irrigation, 1960–99 39
2.6 Historical Changes in Groundwater Levels 40
2.7 Depth of Water Table by Province 41
2.8 Water Table Trends for Wells in Sialkot District of Punjab,
2003–08 41
2.9 Canal Water Distribution System 43
2.10 Trends in Crop Yields, 1991–2008 46
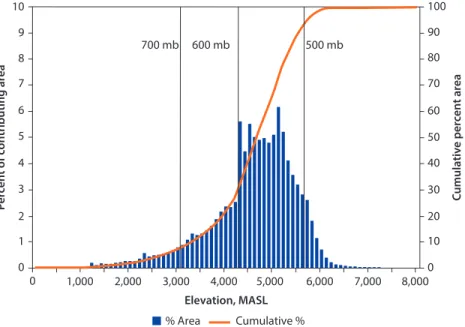
3.1 Area-Altitude Distribution (Hypsometry) of the UIB
Catchment above Besham Gauging Station 60
3.2 Hydrograph Showing Mean Monthly Runoff per Year at Besham 62 3.3 Annual Hydrographs of Gilgit and Hunza Basins 63 3.4 Upper Indus Basin Hypsometries of Table 3.1 66 3.5 Orographic Runoff Gradient for the Western Himalaya and
Karakoram Sub-Basins 68
3.6 The Ablation Gradient 68
3.7 Four Years of Mass Budget Variation with Altitude,
Chhota Shigri Glacier, Chenab Basin, Western Himalaya 69 3.8 Elevation of the Freezing Level for Monthly Maximum
and Minimum Temperatures, Karakoram Himalaya 70 3.9 Estimated Stream Flow Sources for the UIB Primary
Glacierized Sub-Basins 71
3.10 Percent Variation from Mean Annual Stream Flow at Besham, 1969–97 72 3.11 Summer Season and Annual Stream Flow in Besham Basin,
1970–95 73 3.12 Summer Season Stream Flow in Hunza Basin
(Significant Glacier Cover), 1966–96 74
3.13 Summer Season Stream Flow in Astore Basin
(Limited Glacier Cover), 1974–99 74
4.1 CRU Mean Temperature Data for Pakistan over
the 20th Century 78
4.2 CRU Precipitation Data over Pakistan over the 20th Century 79
4.3 Histogram of Annual Indus Inflow 81
4.4 Histogram of Annual Chenab, Jhelum, Kabul, Ravi,
Sutlej, Swat, Soan, and Harro Inflows 81
4.5 Frequency Analysis of Major Tributaries in the Indus Basin 83 4.6 Average Monthly Inflow in IBMR from Nine Tributaries 84
4.7 Indus Inflows, 1937–2011 85
4.8 Time Series of Flows on the Indus, Jhelum, and Chenab,
1922–2009 85 4.9 Ensemble Change of Temperature and Precipitation for
the A2 Scenario 87
4.10 Future Indus Inflow Histogram Using the UIB Model 91 5.1 The Zonal Supply-Demand Relationship in IBMR-2012 96
5.2 Conceptual Diagram of IBMR 97
5.3 The Node-Link System Map of IBMR 100
5.4 Surface-Water Balance in IBMR 101
5.5 Water Balance in IBMR 101
5.6 Model Irrigation Use by Source and Province 107
5.7 CGE Conceptual Diagram 108
5.8 Flow in the CGE Model 109
5.9 Integration of IBMR and CGE 117
6.1 IBMR Sensitivity Analysis Results 121
6.2 CGE and IBMR Outcomes under Climate Risk Scenarios 125 6.3 Household Income Changes under Various Climate
Scenarios for Different Households 125
6.4 Crop Production Changes under Climate Risk Scenarios 126 6.5 Commodities Revenue under Climate Risk Scenarios 127 6.6 CGE and IBMR Outcomes under Hydrograph Monthly
Shift Scenarios 128
6.7 CGE and IBMR Outcomes under the “Worst” and “Best”
Case Scenarios 129
6.8 Cumulative Distribution Functions of IBMR-2012 Objective Value for Different Adaptation Investments (without Climate
Risk Scenarios) 132
6.9 Economic Outcomes from CGE under Different Investments 133 6.10 IBMR Outcomes under Different Investments 135
6.11 Multiyear Flow to the Sea, 1961–2009 137
6.12 Historical Flows below Kotri Barrage, 1938–2004 138 6.13 Environmental Related Outcome under Different Investments 140 6.14 Salt Accumulation in Soil Layer in Fresh and Saline Areas 141 B.1 Cropped Area and Production from IBMR
Baseline and ASP 2008–09 in Punjab 158
B.2 Cropped Area and Production from IBMR
Baseline and ASP 2008–09 in Sindh 159
B.3 Cropped Area and Production from IBMR
Baseline and ASP 2008–09 in NWFP 160
B.4 Cropped Area and Production from IBMR
Baseline and ASP 2008–09 in Balochistan 161 maps
1.1 Indus Basin Irrigation System 19
1.2 Glaciers and Drainage Area in Upper Indus Basin, Pakistan 21 3.1 The Mountain Catchment Basins of the Indus River 59 5.1 Indus River and IBMR Agro-Climatic Zones in Pakistan 98 5.2 Indus River and IBMR Canal Command Areas in Pakistan 99 tables
ES.1 Impact of Different Adaptation Investments under
Climate Risk Scenarios 12
ES.2 Protein and Carbohydrate Supply and Requirement under
Climate Change Estimates 13
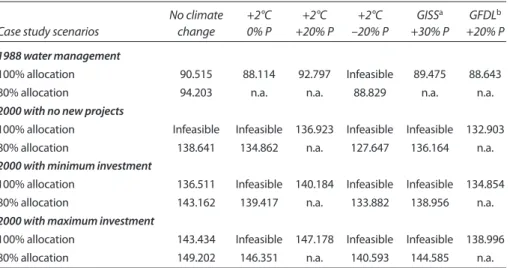
1.1 Increased Agricultural Production with and without
the Basic Plan 27
1.2 Indus Basin Case Study Results: Total Economic Value-Added 28
2.1 Allocations per the Indus Accord 45
2.2 Seepage Losses in Irrigation System 47
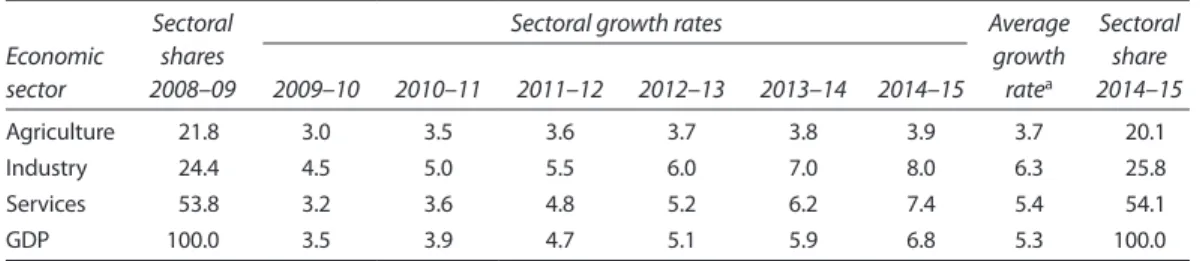
2.3 Average Yields of Selected Crops in Various Countries, 2005 48 2.4 Crop Yield Targets of Major Agricultural Products 49 2.5 Projected Sectoral Growth Rates during Mid-Term
Development Framework Plan Period 49
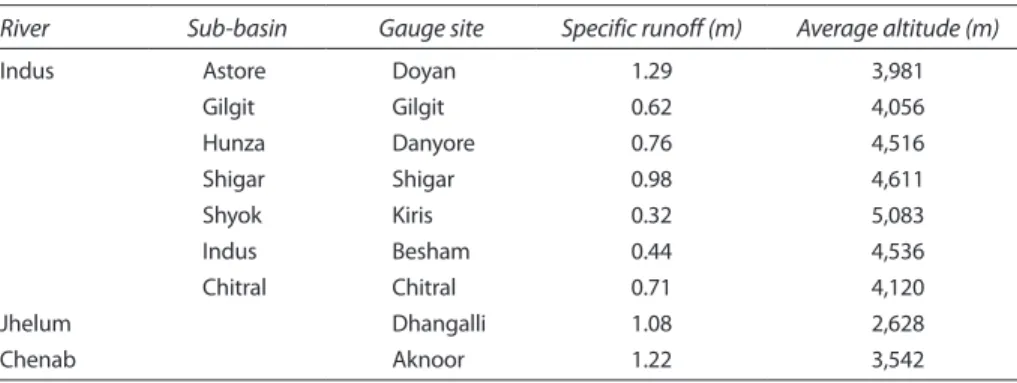
3.1 UIB Catchment Basins with Total Areas and Area-Altitude
Distribution 66 3.2 Basic Descriptive Statistics of the Basins in This Study 67 3.3 Estimated Contribution of Glacier Melt and Snowmelt to
Total Runoff for UIB Sub-Basins 71
4.1 Annual and Seasonal Average Precipitation by Zone, 1951–2000 79
4.2 Precipitation Trends, 1951–2000 80
4.3 Annual Stream Inflow, 1961–2010 80
4.4 Coefficient of Variation for Major World Rivers 84 4.5 Ensemble Mean of Climate Change Projections Based on
IPCC-AR4 Using 17 GCMs and the A2 Special Report
on Emissions Scenarios 88
4.6 Ensemble Mean of Climate Change Projections Based on IPCC-AR4 Using 17 GCMs and the A1B Special Report
on Emissions Scenarios 89
4.7 Projected Summer Changes Using 17 GCMs 89
4.8 Projected Winter Changes Using 17 GCMs 89
4.9 Ensemble Mean of Climate Change Projections for the Upper Indus Basin Based on IPCC-AR4 Using 17 GCMs and the A2 Special Report on Emissions Scenarios 90 4.10 First-Order Effects of Temperature and Precipitation Changes
on Discharge into the Indus Main Stem 90
5.1 Typical Canal, Watercourse, and Field Efficiency for
Different Provinces 102
5.2 Major IBMR Outcome under Baseline Condition 106 5.3 Commodity Revenue Breakdown for the Baseline Condition 107 5.4 Farm Cost Breakdown under Baseline Condition 108 5.5 General Structure of a Social Accounting Matrix 113 6.1 Analysis of Impact across Provinces with and without
the Provincial Accord 122
6.2 Mean and Standard Deviation Objective Value for
50 Years from Different Investments 133
6.3 Impact of Different Adaptation Investments under
Climate Risks 134
6.4 Projected Temperature, Precipitation, and Inflow Changes 136 6.5 Protein and Carbohydrate Supply and Requirements
under Climate Change Estimates 136
6.6 Baseline Environmental Conditions 138
6.7 Baseline vs. Sustainable Groundwater Usage Model 139 6.8 Irrigation Mix under Different Adaptation Investments 140 A.1 Hierarchal Structure of Provinces, Agro-Climatic Zones,
and Canal Command Areas 153
B.1 Livestock Comparison between IBMR 2008 and ASP 2008–09 162
C.1 SAM Accounts 163
C.2 Structure of the 2008 Pakistan SAM 165
This volume was prepared by a team led by Winston Yu (World Bank).
Yi-Chen Yang (University of Massachusetts, Amherst) and Casey Brown (University of Massachusetts, Amherst) generated model scenarios for the Indus Basin Model Revised (IBMR); Andre Savitsky (consultant) updated the IBMR and improved upon the original GAMS (General Algebraic Modeling System) code. Donald Alford (consultant) provided an analysis of the snow- melt and ice melt hydrology in the upper reaches of the Indus Basin; James Wescoat (Massachusetts Institute of Technology) provided an overview of the institutional and policy issues on water and agriculture in Pakistan; and Dario Debowicz (International Food Policy Research Institute) and Sherman Robinson (International Food Policy Research Institute) developed a comput- able general equilibrium model for the economy of Pakistan. Masood Ahmad (World Bank) and Paul Dorosh (International Food Policy Research Institute) provided invaluable technical assistance and guidance throughout this study.
Their generous contributions have lent clarity and focus to this work. The authors are also grateful for the support of the World Bank management team and the Pakistan country office, including Rachid Benmessaoud (Country Director), Simeon Ehui, John Henry Stein, and Gajan Pathmanathan. The authors extend their sincere thanks and appreciation to John Prakash, Venkatakrishnan Ramachandran, and Shabir Ahmad for their administrative support. Editorial support of Valerie Ziobro and Natalie Giannelli is gratefully acknowledged.
The authors benefited enormously from the many technical discussions with colleagues and officers of the Water and Power Development Authority (WAPDA), Government of Pakistan: Irshad Ahmad, Syed Raghib Abbas Shah, Allah Bakhsh Sufi, Daniyal Hashmi, Abdul Rehman, Muhammad Siddique, Iabal Masood Siddiqui, Mushtaq Ahmad, Rao Shafiq-ur-Rehman, and Shafeeq ur Rehman. Useful guidance during the early stages of the study was provided by Shams Ul Mulk (former WAPDA Chairman), Ishfaq Ahmad (Planning Commission), Zafar Altaf (Pakistan Agricultural Research Council), and scientists from the Global Change Impact Studies Centre (GCISC). These discussions helped to shape the approach developed in this study.
The authors also acknowledge constructive comments and suggestions from
the following reviewers: Julia Bucknall, Nagaraja Harshadeep, Daryl Fields,
Marinos Tsigas, Luis Andres, Usman Qamar, Rita Cestti, Aziz Bouzaher, Madhur Gautum, Mahwash Wasiq, and Tahira Syed. Their contributions have enhanced the quality of this document, which is intended to support Pakistan in its efforts to better manage climate risks in the water and agriculture sectors.
Generous support was provided by the World Bank, the Bank Netherlands
Water Partnership Program, the Bank–Dutch Trust Fund for Pakistan, and the
South Asia Water Initiative.
Winston H. Yu is a senior water resources specialist at the World Bank. He has
extensive experience in technical and institutional problems in the water sector and has carried out a number of research and investment projects in developing countries. His special interests include river basin management tools, hydrologic modeling, flood forecasting and management, groundwater hydrogeology, international rivers, and climate change. Prior to joining the World Bank he was a researcher at the Stockholm Environment Institute and served as a Science and Technology Officer at the U.S. Department of State. He is also an Adjunct Professor at the School of Advanced International Studies at Johns Hopkins University where he is associated with the Johns Hopkins Global Water Program.
He received a PhD from Harvard University.
Yi-Chen E. Yang is a postdoctoral research scientist at University of Massachusetts
Amherst, and recently received a doctoral degree in Civil and Environmental Engineering from the University of Illinois. His research interests are water resources management, water policy development, climate change impact assessment, coupled natural and human complex systems, agent-based modeling, decentralized optimization, hydroecology, and geographic information science.
He has a BS in geography and an MS in bio-environmental system engineering from the National Taiwan University.
Andre Savitsky is an independent consultant. He has published more than
50 articles on hydrology, hydrodynamics, and water resources management and continues research in these areas, specifically in the wide usage of mathematical modeling and programs for water accounting and management internationally.
He studied hydrology at the State University of Uzbekistan and mathematics at the Tashkent Pedagogical Institute, and received a PhD in hydrology and hydraulics.
Donald Alford is an independent consultant. He has studied mountain glacier
and hydrometeorological environments ranging from northern Greenland to
Southeast Asian subtropics. His Himalayan studies began as a visiting scientist at
the East-West Center in Honolulu and at the International Centre for Integrated
Mountain Development in Kathmandu. Recent studies have involved the
relationship of climate change, glaciers, and water resources in the Pamir and
Hindu Kush–Himalaya regions. He studied earth sciences at Montana State University and the Institute of Hydrology and Glaciology at the University of Zurich and obtained a PhD with a dissertation on cirque glaciers from the Institute of Arctic and Alpine Research, University of Colorado.
Casey Brown is an assistant professor in the Department of Civil and
Environmental Engineering at the University of Massachusetts at Amherst and adjunct associate research scientist at Columbia University in New York. He has worked extensively on projects around the world in climate and water resources.
He has received awards, including the Presidential Early Career Award for Science and Engineering, the National Science Foundation CAREER Award, and the Huber Research Prize from the American Society of Civil Engineers. He has a PhD in environmental engineering science from Harvard University and led the water team at the International Research Institute (IRI) for Climate and Society at Columbia University.
James L. Wescoat is the Aga Khan Professor in the School of Architecture and
Planning at the Massachusetts Institute of Technology. His research has concen- trated on water systems in South Asia and the United States at the river basin scales. He has contributed to studies of climate, water, agriculture, and energy in the Indus Basin, and to historical research on waterworks of the Mughal period in India and Pakistan. He served on the U.S. National Research Council’s Committee on Himalayan Glaciers, Water Resources, and Water Security.
Wescoat received his PhD in geography from the University of Chicago.
Dario Debowicz is a postdoctoral researcher at the International Food Policy
Research Institute in Washington, DC. He has lectured on macroeconomics at the University of Buenos Aires and other universities in Argentina and on development economics at the Institute of Development Studies. Debowicz conducts macro-micro countrywide modeling and has worked with computable general equilibrium (CGE) models, dynamic stochastic general equilibrium models, and behavioral micro-simulation models. His research interests include development macroeconomics, monetary policy and international finance, labor economics, the macroeconomics of poverty reduction, and the partial and general equilibrium effects of conditional and unconditional cash transfers.
He received his PhD in economics from the University of Sussex.
Sherman Robinson is a senior research fellow at the International Food Policy
Research Institute in Washington, DC, and professor of economics (emeritus) at
the University of Sussex, U.K. He is a leading expert on CGE simulation models,
and his research interests include international trade, economic growth, climate
change adaptation, linked water-economy models, macroeconomic policy,
income distribution, and maximum-entropy econometrics applied to estimation
problems in developing countries. He has published widely in international trade,
growth strategies, regional integration, income distribution, empirical modeling
methodologies, and agricultural economics.
ACZ agro-climatic zone
AF acre-foot
AR4 Intergovernmental Panel on Climate Change Fourth Assessment Report
ASL above sea level
ASP Agricultural Statistics of Pakistan BKWH billion kilowatt-hours
BRW Balochistan Rice Wheat
CANEFF canal and watercourse efficiency improvements CCA culturable command area
CDF cumulative distribution function CGE computable general equilibrium CPI consumer price index
CPS consumer and producer surplus CRU Climatic Research Unit
CV coefficient of variation CYIELD crop yield
DEM digital elevation model
DIVACRD 1991 Provincial Water Allocation Accord
FAOSTAT Food and Agricultural Organization of the United Nations Statistical Database
GAMS General Algebraic Modeling System GCISC Global Change Impact Study Centre GCM general circulation model
GDP gross domestic product GM genetically modified GRDC Global Runoff Data Centre HKK Hindu-Kush-Karakoram
IBDP Indus Basin Development Programme
IBIS Indus Basin Irrigation System
IBM Indus Basin Model
IBMR Indus Basin Model Revised IBMY Indus Basin Multi-Year
IPCC Intergovernmental Panel on Climate Change IRSA Indus River System Authority
IWT Indus Waters Treaty
JJAS June, July, August, and September MAF million acre-feet
MASL meters above sea level
MTDF mid-term development framework NEWDAM construction of new reservoirs NSIDC National Snow and Ice Data Center NWFP North-West Frontier Province NWKS North West Kabul Swat NWMW North West Mixed Wheat
ONDJ October, November, December, and January PCWE Punjab Cotton Wheat East
PCWW Punjab Cotton Wheat West
PMD Pakistan Meteorological Department
PMW Punjab Mixed Wheat
PRs Pakistani rupees
PRW Punjab Rice Wheat
PSW Punjab Sugarcane Wheat ROW rest of the world
SAM social accounting matrix
SCARP Salinity Control and Reclamation Projects SCWN Sindh Cotton Wheat North
SCWS Sindh Cotton Wheat South SRTM Shuttle Radar Topography Mission SRWN Sindh Rice Wheat North
SRWS Sindh Rice Wheat South SWAT Soil and Water Assessment Tool SWE snow-water equivalent
UIB Upper Indus Basin
USEPA United States Environmental Protection Agency
WAPDA Water and Power Development Authority
WSIPS Water Sector Investment Planning Study
Executive Summary
This study, The Indus Basin of Pakistan: The Impacts of Climate Risks on Water and
Agriculture, was undertaken at a pivotal time in the region. The weak summermonsoon in 2009 created drought conditions throughout the country. This followed an already tenuous situation for many rural households faced with high fuel and fertilizer costs and the impacts of rising global food prices. Then cata- strophic monsoon flooding in 2010 affected over 20 million people, devastating their housing, infrastructure, and crops. Damages from this single flood event were estimated at US$10 billion (ADB and World Bank 2010), half of which were losses in the agriculture sector. Notwithstanding the debate as to whether these observed extremes are evidence of climate change, an investigation is needed regarding the extent to which the country is resilient to these shocks. It is thus timely, if not critical, to focus on climate risks for water, agriculture, and food security in the Indus Basin of Pakistan.
Pakistan relies on the largest contiguous irrigation system in the world. Known as the Indus Basin Irrigation System (IBIS) for its basic food security and water supply for all sectors of the economy, it supports the basin comprising the Indus River main stem and its major tributaries—the Kabul, Jhelum, Chenab, Ravi, and Sutlej rivers. IBIS has 3 major multipurpose storage reservoirs, 19 barrages, 12 inter-river link canals, 45 major irrigation canal commands (covering over 18 million hectares), and more than 120,000 watercourses delivering water to farms and other productive uses. These canals operate in tandem with a vast and growing process of groundwater extraction from private tubewells.
IBIS is the backbone of the country’s agricultural economy. The agriculture
sector it supports plays a critical role in the national economy and livelihoods of
rural communities. Agriculture contributes some 22 percent to Pakistan’s gross
domestic product (GDP), down from 27 percent in 1989 and 46 percent in 1960,
due primarily to more rapid growth in the services sector. Forty-five percent
of the labor force is employed in the agriculture sector. The value of agricultural
production continues to grow at an average annual rate of approximately
3 percent. However, the inter-annual variability of agricultural value-added to
GDP is high, which demonstrates existing vulnerabilities to climate risks.
Irrigated land supplies more than 90 percent of agricultural production.
Agriculture in most areas of the basin is not possible without irrigation because Pakistan’s climate is arid to semi-arid with low and variable rainfall. Only 28–35 percent of the total land area is arable, and that proportion has not increased significantly in recent decades. However, the irrigated portion of arable land has grown over the past decade—from about 65 percent in 2001 to almost 75 percent in 2009—contributing to increased agricultural production and yields.
The rivers of the Indus Basin have glaciated headwaters and snowfields that, along with monsoon runoff and groundwater aquifers, are the major sources of water for Pakistan. Currently, about 50–80 percent of the total average river flows in the Indus system are fed by snow and glacier melt in the Hindu-Kush- Karakoram (HKK) part of the Greater Himalayas, with the remainder coming from monsoon rain on the plains. Variability in the distribution and timing of snowfall and changes in snow and ice melt may be amplified by climate change, which has implications for managing basin water resources.
Managing groundwater resources continues to be a major challenge in the Indus Basin. Waterlogging and salinity have been major concerns over the past century, following the expansion of canal irrigation. Groundwater levels and water quality vary across the plains during the irrigation and monsoon seasons.
When tubewells tap into brackish groundwater, they accelerate the secondary salinization of irrigated soils, which injures crops and reduces yields.
Food self-sufficiency is an escalating concern in Pakistan. Although agricul- tural production and yields continue to grow, the population growth rate also remains high, at an annual 2.2 percent. Per capita food supply varies from year to year and falls below the global average of 2,797 kilocalories (kcal) per capita per day. Despite increased food production, there has been no change over the past two decades in the estimated 25 percent of the population who are under- nourished (FAOSTAT 2012). The National Nutrition Survey 2011 (Bhutta 2012) reports that 57 percent of the population does not have food security.
Water and agricultural production depend on managing these many forms of resource variability and uncertainty. An overarching pattern in the issues presented above is that while the Indus Basin is richly endowed with land and water resources vital for the agricultural economy, it faces high levels of variability and uncertainty in climate, hydrology, agricultural sustainability, food consumption, and natural hazards.
study objective
The objective of this study is to assess the impacts of climate risks and various
development alternatives on water and agriculture in the Indus Basin of
Pakistan. The study analyzes inter-relationships among the climate, water, and
agriculture sectors of the country. A better understanding of how these sectors
are linked will help plan future investments in these sectors. Many different
forums and policy reports in Pakistan recognize the important role of water
management in the productivity of the agriculture sector and overall food security. However, the factors affecting the availability and use of water and its connection to the factors mentioned above are not always comprehensively addressed (with systems-based models) in federal and provincial planning documents and budgeting. This study provides a systems modeling framework for these purposes.
Analytically, this objective is achieved by integrating several different modeling environments, including a model of Upper Indus snow and ice hydrology (critical for determining overall water availability), an agro-economic optimization model of the IBIS, and an updated computable general equilibrium (CGE) model of Pakistan’s wider macro-economy. This integration of models helps to frame recommendations for strengthening water, climate, and agriculture planning, policies, and research priorities for the Indus Basin.
The key climate risk challenges to be examined in the context of this modeling framework include: (1) limited water storage, (2) problematic trends in surface water and groundwater use, (3) inflexible and uncertain water allocation institutions, and (4) low water-use efficiencies and productivity.
policies and plans
The Indus Basin of Pakistan, like other complex river basins, faces a common set of institutional and policy challenges: (1) international treaty tensions over upstream development; (2) sectoral integration across water, agriculture, environment, climate, and energy agencies at the national level; (3) national- provincial coordination in a federal system of government; and (4) interprovin- cial water conflict resolution. The Government of Pakistan has responded to these tensions in several creative ways, beginning with the establishment of the Water and Power Development Authority (WAPDA) as a semiautonomous federal water agency, followed by the Indus River System Authority (IRSA) as a federal-provincial coordinating organization. The Planning Commission’s Vision
2030 (GPPC 2007) and reports of the Intergovernmental Task Force on ClimateChange (GPPC 2010) and Task Force on Food Security (GPPC 2009) articulate integrative analyses and recommendations. While a comparably broad national water policy is needed, reform of provincial irrigation institutions has been initi- ated over the past decade in Punjab and Sindh provinces. Notwithstanding earlier efforts at integrative planning, much more institutional coordination, integration, and conflict transformation will be required to address the substantive water, climate, and agriculture issues highlighted.
This common set of water and agricultural policy challenges is complicated by
several dynamic stresses and institutional shifts in the Indus Basin. First, a series
of catastrophic floods, droughts, and earthquakes over the past decade have led
to the establishment of new, but not yet adequate, national and provincial disas-
ter management agencies. Second, growing concerns about climate change led in
2012 to the adoption of a national climate change policy and creation of a
Ministry of Climate Change. These new developments are promising but require
major capacity-building and rigorous coordination with established water, power, and agricultural agencies.
Furthermore, these structural pressures and responses are occurring within the context of major constitutional devolution from the national to the provincial level. The 18th amendment to the constitution, passed in April 2010, eliminated the concurrent list of federal and provincial responsibilities and devolved most of the functions on that list to the provincial level. This constitutional change requires stronger policy links between the federal water sector and the provincial irrigation and agricultural sectors, which will require both vision and budget support at the federal and provincial levels. Moreover, assessments of climate impacts and adaptations (as they relate to the agriculture and water sectors) must devote increased emphasis to provincial planning, management, and governance.
Most national and provincial development plans continue to focus on the role of infrastructure in addressing challenges of water and agriculture. However, recent documents highlight the increasing importance of improving irrigation efficiency and reducing fiscal shortfalls in the irrigation revenue system.
Moreover, increasing yields is identified as a key area of needed improvement, particularly as it relates to adaptability to climate change (for example, acceler- ated crop breeding and adoption of genetically modified Bt cotton).
Various forums and policy reports increasingly recognize the important role that water management plays in agricultural productivity; however, this relation- ship is not always comprehensively addressed (with systems-based models) in federal and provincial planning documents and budgets. This discrepancy underscores the need to address sector gaps and reduce uncertainties among the irrigation, agricultural, and climate change policies for Indus Basin management.
Upper indus Basin Hydrology and Glaciers
While it is generally agreed that a significant percentage of the Indus River flow originates in the mountain headwaters of the Karakoram Himalaya, western Himalaya, and Hindu Kush Mountains, there is no consensus regarding the role or importance of this runoff for the complex hydrometeorological environments that characterize the mountain catchments. In particular, there has been consider- able speculation concerning the importance of glaciers in the flow volume and timing of the Indus River and its tributaries, as well as on the potential impact of climate change on this water supply. Although these concerns are recognized, few analyses have described the role of glaciers in the hydrologic regime of these mountains, in large part due to the inaccessibility and altitude (4,000–7,000 meters [m]) of Himalayan glaciers.
Estimates of the potential impact of a continued retreat of the glaciers are
derived on the basis of use of disaggregated low-altitude databases, topography
derived from satellite imagery, and simple process models of water and energy
exchange in mountain regions. The surface area of the Upper Indus Basin (UIB)
is approximately 220,000 square kilometers (km
2). Of this surface area, more
than 60,000 km
2is above 5000 m, the estimated mean altitude of the summer- season freezing level. It is assumed that significant melt of glaciers does not occur over most of this upper zone. The glaciers of the region flowing outward from this zone have been estimated to have a surface area of approximately 20,000 km
2, of which 7,000–8,000 km
2is below the summer-season freezing level. It is this 7,000–8,000 km
2area, in the ablation zone, that is the source of the bulk of the annual glacier melt water flowing onto the Indus River tributaries.
The two principal sources of runoff from the UIB are winter precipitation, as snow that melts the following summer, and glacier melt. Winter precipitation is most important to the seasonal snow runoff volume, while summer temperature contributes most to glacier melt volume. Drawing a clear distinction between the runoff volumes resulting from snow melt and glacier melt is difficult. The primary zone of melt water from both sources is maximized at around 4,000–5,000 m, as a result of a combination of maximum terrain surface area, maximum glacier surface area, and maximum snow water equivalent deposition occurring there.
This is the altitudinal zone generally reached by the upward migration of the freezing level during the months of July and August, which is also the time of maximum runoff.
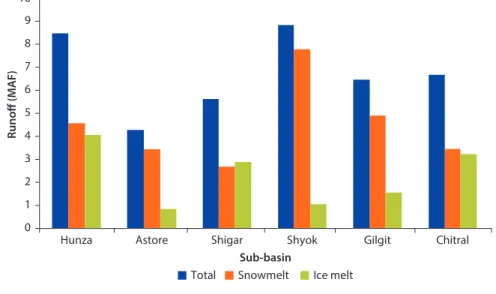
Using a simple model of these dynamics, it is estimated that glacier runoff contributes approximately 19.6 million acre-feet (MAF) to the total annual flow of the UIB: 14.1 MAF from the Karakoram Himalaya, 2.3 MAF from the western Himalaya, and 3.2 MAF from the Hindu Kush. This represents an estimated 18 percent of the total flow of 110 MAF from the mountain headwaters of the Indus River. Thus, the most probable source for a majority of the remaining 82 percent is melt water from the winter snowpack (figure ES.1). Approximately
Figure es.1 contributions of snowmelt and ice melt to total runoff for sub-Basins in the Upper indus Basin
Hunza Astore Shigar
Sub-basin
Shyok Gilgit Chitral
0 1 2 3 4 5 6 7 8 9 10
Runoff (MAF)
Total Snowmelt Ice melt Note: MAF = million acre-feet.
80 percent of the annual stream flow volume in the tributaries of the UIB occurs during the summer months of mid-June to mid-September.
In order to assess the potential impact of climate change scenarios on stream flow in the UIB, it is useful to distinguish between changes that may result from variations in precipitation and those related to changes in temperature. The volume of runoff from winter snowmelt will be determined primarily by varia- tions in winter precipitation. On the other hand, glacier melt water production will vary with the energy availability (changes in temperature, primarily during summer) during the melt season at the glacier surface.
Because of the complexities at these high elevations, general circulation models (GCMs) are unlikely to have much value for forecasting purposes.
Therefore, a major investment is needed in snow and ice hydrology monitoring stations, further scientific research, and forecasting to improve the hydrologic predictability of the UIB.
Future climate scenarios
Analysis of GCM outputs supports the subsequent modeling approach in which ranges of climate risks are informed by GCM outputs but not driven directly by them. Moreover, given the uncertainties these outputs demonstrate, a wider and more extreme range of possible climate futures is considered.
Historically, over the entire country, the mean temperature has increased by about 0.6°C over the last century. Annual precipitation has also increased by about 25 percent (63 millimeters [mm]) over the same period. Precipitation patterns across provinces and within the year are less clear. Each river in the Indus system has its own hydrologic regime (for example, Chenab, Indus, and Jhelum). In general, the Indus system exhibits less variability in a year than other major river basins in the world (for example, the Ganges). In part this is a reflec- tion of the moderating impact that snow and ice play in the overall hydrology.
The general findings from a wide range of GCM outputs (and emissions scenarios) show agreement among models regarding continued increases in temperature into the future. Increases are estimated to be at worst close to 3°C by the 2050s. The temperature increases in both summer and winter are higher in northern Pakistan than in southern Pakistan. Moreover, temperature increases tend to be on average higher during winter than summer. The models do not agree on changes in precipitation because standard errors are large; however, there is some indication of a general trend in increased precipitation during the summer and a decrease during the winter. The changes appear to be more pro- nounced in the southern parts of the country. These models are likely to be more reliable for the irrigated plains than for the mountainous upper basin.
Given the orographic complexity of the UIB, future projections of volumes
entering the Indus system are inconclusive. Moreover, using the snow and ice
hydrology model developed in this study and a wide range of climate futures,
the postulated impact of climate change on inter-annual stream flow variations
is generally comparable with the current inter-annual variations. Therefore, it is
anticipated that for the UIB, the primary impact of all but the most extreme climate change scenarios could be a shift in the timing of peak runoff, and not a major change in annual volume.
modeling Water, climate, Food, and the economy
The modeling framework developed in this study integrates two models in addition to the snow and ice hydrology model. The first model is an agro- economic optimization model that takes a variety of inputs (for example, agronomic, irriga- tion system data, water inputs) to generate the optimal crop production across the provinces (subject to a variety of physical and political constraints) in the existing IBIS for every month of the year. The objective function for this model is primarily the sum of consumer and producer surpluses. The second model is a CGE model for the Pakistan macro-economy. This integration helps to better understand how changes in climate risks impact the macro-economy and different household groups through the agriculture sector.
Sensitivity analyses indicate that the objective value is most sensitive to stream inflow, crop water requirement, and depth to groundwater parameters.
The objective value decreases to almost 60 percent of the baseline when the inflows drop to its 90 percent exceedance level (101 MAF). When the inflow increases to its 10 percent exceedance level (209 MAF), the objective value shows no significant change because the system is unable to generate more economic benefits in the basin. This may be due to crop productivity limits, policy constraints on water allocation, or physical constraints. Increasing crop water requirements, which are proportional to air temperature in the study’s analysis, also results in a substantive decrease in the objective function; for example, about a 40 percent reduction occurs with a crop water requirement increase of 35 percent (corresponding to a 6.5°C increase) of the baseline value.
Meanwhile, the 1991 Indus Water Accord (“the Accord”), which determines
the provincial allocations of the Indus, is a critical constraint in the system. The
difference in objective value is a factor of 2 between strict adherence to
the Accord and relaxation of the Accord. According to this study model
results, if the Accord is relaxed and water is allocated economically and opti-
mally within and among provinces, both Punjab and Sindh could benefit. The
system-wide net revenue will increase by about PRs 158 billion (almost
US$2 billion)—with PRs 83 billion additional in Punjab and PRs 82 billion
additional in Sindh. Moreover, by relaxing the Accord and implementing eco-
nomically based water allocation mechanisms, provinces will be better able to
manage extreme events (for example, drought) by more reliably meeting
system-wide demands. However, this effort would need to be supported by
investment in effective, transparent, real-time water delivery measurement
systems; capacity-building in IRSA and WAPDA for technical decision-support
systems and forecasting; and equally substantial investment in trust-building
among stakeholders. Finally, even though it is unlikely and probably unwise
that the Accord constraint should—by itself—be relaxed, there is room for
flexible policy adjustments and mechanisms within the wider framework of the present Accord (for example, interprovincial exchange of surplus alloca- tions, water banking, and leasing arrangements),
1as well as for improved water allocation within provinces, which the modeling results suggest should be pursued on agro- economic grounds.
climate risk scenarios
Climate change projections show great uncertainty and questionable skill in this region. To generate a wider range of potential climate scenarios, the study team used combinations of corresponding inflow and crop water requirement param- eters. Inflow was varied from 10 to 90 percent exceedance probability, and the crop water requirement was varied to correspond to a 1°–4.5°C temperature increase (possibly occurring around the 2020s and 2080s, respectively).
Furthermore, since much of the waters in the system originate in the UIB in the Himalayas, climate change impacts (using corresponding temperature and pre- cipitation changes) on snow and ice in the UIB, and ultimately on the inflows into the Indus main-stem basin, were considered. These climate futures represent a plausible range of climate changes within the next 80 years, consistent with recent observations and theory.
Generally, negative impacts are estimated under these climate risk scenarios.
GDP, Ag-GDP, and household income are estimated to decrease on average by 1.1, 5.1, and 2.0 percent, respectively, on an annual basis (figure ES.2a). In the most extreme future scenario—when inflow is at 90 percent exceedance prob- ability and the temperature increases 4.5°C—GDP, Ag-GDP, and household income are estimated to decrease annually by 2.7, 12.0, and 5.5 percent, respec- tively. Most of the negative impacts on incomes will occur for those households outside of the agriculture sector (except for those living in provinces other than Punjab and Sindh) that would be faced with an increase in food prices ( figure ES.3). Since the increase in prices is larger than the decrease in produc- tion, farm-related households will likely benefit. However, nonfarm households in towns and cities will have to pay more for food, resulting in decreased household incomes.
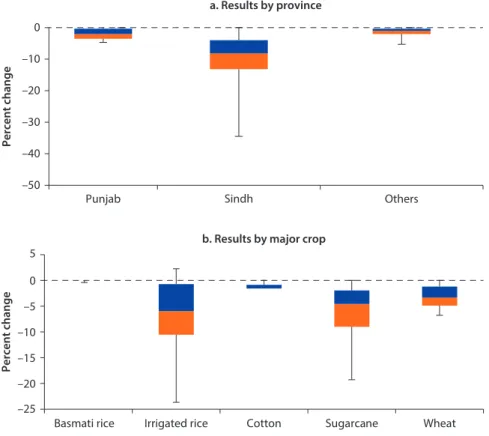
Total crop production is estimated to decrease up to 13 percent (figure ES.2b).
The change in hydropower generation varies the most, from a 22 percent increase to a 34 percent decrease. Increases are a result of more surface water becoming available from more snowmelt. Impacts are greatest for crop produc- tion in Sindh, at around 10 percent on average (figure ES.4). Irrigated rice, sug- arcane, cotton, and wheat demonstrated the greatest sensitivity to climate, and changes represent both response to climate and dynamic responses to water availability and price changes.
In order to assess the likelihood of low probability but high impact climate
changes (“surprises”), possible “worst” and “best” case climate futures were evalu-
ated. The worst case was defined as 90 percent exceedance inflow, a forward
monthly hydrograph shift, 20 percent less rainfall, 20 percent more water
Figure es.3 Different Household income changes under climate risk scenarios
–15 –10 –5 0 5 10 15 20
Agri-sector Punjab
Agri-sector Sindh
Agri-sector others
Nonfarm Urban
Percent change
Baseline
(PRs, billions) 1,706 488 518 1,425 5,295
Figure es.2 cGe and iBmr economic outcomes under climate risk scenarios
–12 –10 –8 –6 –4 –2 0
a. Impacts on GDP, Ag-GDP, and household income
GDP Ag-GDP Household income
Percent change
–40 –30 –20 –10 0 10 20 30
b. Impacts on crops and power
Crop production Power generation
Percent change
Note: CGE = computable general equilibrium, IBMR = Indus Basin Model Revised.
Figure es.4 crop production changes under climate risk scenarios
–50 –40 –30 –20 –10 0
a. Results by province
Percent change
Punjab Sindh Others
–25 –20 –15 –10 –5 5 0
b. Results by major crop
Basmati rice Irrigated rice Cotton Sugarcane Wheat
Percent change
requirement (consistent with a +4.5°C change), and groundwater table depths that are 20 percent deeper throughout the basin. The best case was defined as the 10 percent exceedance inflow, 20 percent more rainfall, no change in the existing crop water requirements, and groundwater table depths that are 20 percent shallower. In the “worst” case, GDP, Ag-GDP, and household income decrease by 3.1, 13.3, and 6.7 percent, respectively, on an annual basis. In the best case, GDP, Ag-GDP, and household income increase by 1.0, 4.2, and 1.3 percent, respec- tively. These results represent a wide range of economic futures given current conditions, including the current Accord allocation, in this basin.
Adaptation investment scenarios
Three possible adaptation investments were evaluated: (1) canal and watercourse
efficiency improvements (CANEFF) to bring the system to 50 percent system-
wide efficiency levels; (2) construction of new reservoirs to introduce an addi-
tional 13 MAF (NEWDAM); and (3) investments in agricultural technologies to
increase crop yield (CYIELD) by 20 percent. To examine the role that these
investments play over time, the original Indus Basin Model Revised-2012
(IBMR-2012) was modified for multiyear analysis.
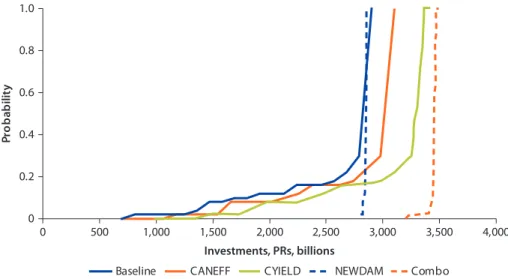
Figure es.5 cumulative Distribution Functions of iBmr-2012 objective value for Different Adaptation investments (without climate risk scenarios)
Note: CANEFF = canal and watercourse efficiency improvements, CYIELD = crop yield, NEWDAM = construction of new reservoirs. The cumulative distribution function is a graph of the value of the objective function versus the probability that value will occur.
0 0.2 0.4 0.6 0.8 1.0
0 500 1,000 1,500 2,000 2,500 3,000 3,500 4,000
Investments, PRs, billions
Probability
Baseline CANEFF CYIELD NEWDAM Combo
Figure ES.5 shows the cumulative distribution functions (CDFs) of the objective function for each of these investment scenarios. The CDF is a graph of the value of the objective function versus the probability of that value (or less) occurring. The CANEFF and CYIELD investments shift the CDF to the right of the baseline, indicating that the objective value tends to increase under these investments. The long left-side tails of the CDFs of these two investments are a result of the very low values that occur in difficult years, such as droughts.
The NEWDAM investment is unique in that it eliminates the left-side tail, showing that additional storage reduces the probability of very low objective values, thus mitigating the effects of drought years. It does not, however, increase the objective value under normal and high flow years, primarily because the objective function does not include the economic benefits from additional hydropower generation. Thus, this analysis pertains to the value of storage for irrigated agriculture but not for other services such as hydropower and flood risk reduction. In addition, while the increased reservoir volume may supply more water, due to the constraints of the Accord, that water cannot be put to use effectively.
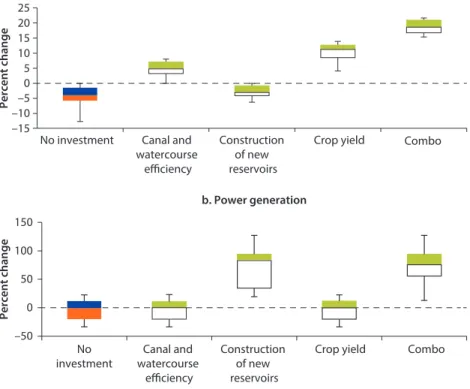
Canal efficiency and crop yield investments show a potential to minimize the impacts of future climate risks and increase food production. Investments in canal and watercourse efficiency and crop technologies are estimated to increase average crop production by 5–11 percent annually (figure ES.6a). Thus, these investments will have positive impacts on the macro-economy and households.
Instead of losses of 1.1, 5.1, and 2.0 percent of GDP, Ag-GDP, and household
income, respectively, estimated under climate change scenarios, with these
adaptation investments, gains can still be realized (see table ES.1). For example, the average Ag-GDP will decrease by 5.1 percent without any adaptation but will increase by 4.2 and 11.6 percent with the CANEFF and CYIELD invest- ments, respectively. These investments are still vulnerable under low-flow drought conditions. On the other hand, investment in additional storage (NEWDAM) reduces the impacts of climate change but does not completely mitigate them. In addition, the NEWDAM investment would also realize quite large hydropower generation benefits (figure ES.6b) despite climate changes.
table es.1 impact of Different Adaptation investments under climate risk scenarios
GDP Ag-GDP Household income
Average change without investments (%)
No investment –1.1 –5.1 –2.0
Average gain with investments (%)
CANEFF 2.04 9.32 3.21
NEWDAM 0.29 1.50 0.64
CYIELD 3.66 16.70 5.42
Combo 6.05 27.40 7.45
Note: CANEFF = canal and watercourse efficiency improvements, CYIELD = crop yield, NEWDAM = construction of new reservoirs.
Figure es.6 sector outcomes for Adaptation investments under climate change conditions
–15 –10 –5 0 5 10 15 20 25
a. Crop production
No investment Combo
Percent change
Canal and watercourse
efficiency
Crop yield Construction
of new reservoirs
–50 0 50 100 150
b. Power generation
No
investment Combo
Percent change
Canal and watercourse
efficiency
Crop yield Construction
of new reservoirs
Note: CANEFF = canal and watercourse efficiency improvements, CYIELD = crop yield, NEWDAM = construction of new reservoirs.
Changes in crop production are directly related to the achievement of food self-sufficiency. The supply and demand of wheat was used to evaluate this issue.
The protein and carbohydrate demands in the 2020s, 2050s, and 2080s were estimated based on future population estimates (table ES.2). The supply is projected to be less than the demand by the 2050s without any investment intervention. Only the CYIELD investment can maintain the necessary produc- tion to meet future protein and carbohydrate requirements. By the 2080s, none of the investments will be able to supply sufficient protein and carbohydrate requirements for the country.
Disaggregating these findings by province shows that Punjab will be able to meet its protein and carbohydrate demands, even out to 2080. The real food self- sufficiency challenge will be in Sindh, even as early as 2020. Note that it is assumed that interprovincial trading does not change. Also, the evaluation is in terms of self-sufficiency and does not evaluate changes in the ability to import food or potential changes in diet.
Without specific interventions, environmental considerations such as flow to the sea, changes in depth to groundwater, and the overall salinity situation, are projected to worsen. In particular, groundwater depletion in the fresh groundwater area and the basin-wide salinity issue will become worse if no policy intervention is made. The study analysis reveals that the decreases in net benefits (as a percentage of the baseline) are not that significant under a scenario where safe groundwater yields are enforced. However, without intervention, the long-term trends are troubling. The net recharge in fresh groundwater areas is negative in all provinces, with the largest values estimated in Punjab, suggesting continued declining water tables. This decline also contributes to increased saline water intrusion. Additionally, salt accumulation is positive in all provinces and in both fresh and saline areas. Given the scale of these issues, a new phase of truly visionary planning is needed for conjunctive management of surface and groundwater.
table es.2 protein and carbohydrate supply and requirement under climate change estimates
Population (millions)
Cereal-based protein and carbohydrate demand
(tons, millions)
Protein and carbohydrate supply (tons, millions)
Baseline CANEFF NEWDAM CYIELD
Baseline 167.4 10.1 16.3 18.0 16.4 19.8
2020-low P 227.8 13.7 16.1 17.7 16.2 19.4
2020-high P 16.2 17.8 16.3 19.5
2050-low P
307.2 18.4 15.8 17.2 15.9 19.0
2050-high P 15.9 17.4 15.9 19.1
2080-low P 386.7 23.1 15.5 16.8 15.6 18.6
2080-high P 15.5 16.8 15.6 18.7
Note: CANEFF = canal and watercourse efficiency improvements, CYIELD = crop yield, NEWDAM = construction of new reservoirs. Shaded cells indicate supply is less than demand. Baseline means current climate condition. Low and high P represent lower and higher precipitation projections from the GCMs.
conclusions
This analysis identified, first, the key hydroclimatic sensitivities and robust aspects of the IBIS. Second, the models used here are among the best mathematical representations available of the physical and economic responses to these exogenous future climate risks. However, uncertainty exists because, as in all modeling approaches, parameters may not be known with precision and functional forms may not be fully accurate. Thus, careful sensitivity analysis and an understanding of and appreciation for the limitations of these models are required. If undertaken, further collection and analysis of critical input and output observations (for example, snow and ice data), as well as practical measures for improving productivity under a changing climate, would enhance this integrated framework methodology and future climate impact assessments.
The precise impact of climate risks on the Indus Basin remains to be seen. This much is known, however: Climate change will pose additional risks to Pakistan’s efforts to meet its water and food self-sufficiency goals, goals that are key to reducing poverty, promoting livelihoods, and developing sustainably. As its popu- lation grows, Pakistan’s ability to meet basic food requirements and effectively manage water resources will be critical for sustaining long-term economic growth and rectifying widespread food insecurity and nutrition deficiencies.
These are challenges above and beyond what Pakistan is already facing, as evidenced by the extreme hydrologic events of 2009–11. Strategic prioritiza- tion and improved planning and management of existing assets and budget resources are critical. These strategic choices will be largely dependent on a sound assessment of the economics of these impacts.
The integrated systems framework used in this analysis provides a broad and unique approach to estimating the hydrologic and crop impacts of climate change risks, the macro-economic and household-level survey responses, and an effective method for assessing a variety of adaptation investments and policies. In assessing the impacts, several different modeling environments must be inte- grated to provide a more nuanced and complete picture of how water and agri- culture interrelate. Moreover, such a framework allows for extensive scenario analysis to identify and understand key sensitivities. This analysis is critical to making decisions in a highly uncertain future. Finally, through this integration of multiple disciplines, a richer and more robust set of adaptation investment options and policies for the agriculture and water sectors can be identified and tested. Continued refinements to the assessment approach developed in this volume will further help to sharpen critical policies and interventions by the Pakistan Government.
note
1. These types of approaches can be seen increasingly in basins such as the Colorado River in the United States.
references
ADB (Asian Development Bank) and World Bank. 2010. “Pakistan Floods 2010 Damage and Needs Assessment.” Pakistan Development Forum, Islamabad.
Bhutta, Z. 2012. Pakistan—National Nutrition Survey 2011. Karachi, Pakistan: Aga Khan University Pakistan Medical Research Council Nutrition Wing, and Ministry of Health.
FAOSTAT (Food and Agricultural Organization of the United Nations Statistical Database). 2012. Database of Food and Agriculture Organization of the United Nations, Rome. http://faostat.fao.org.
GPPC (Government of Pakistan, Planning Commission). 2007. “Agricultural Growth:
Food, Water and Land.” In Vision 2030, GPPC, 51–60. Islamabad. http://www.pc.gov .pk/vision2030/Pak21stcentury/vision%202030-Full.pdf.
———. 2009. “Final Report of the Task Force on Food Security.” Islamabad.
———. 2010. “Task Force on Climate Change Final Report.” Islamabad.