arXiv:1110.0016v3 [hep-ph] 22 Oct 2011
Workshop on
Precision Measurements of α s
MPI Munich, Germany February 9 to 11, 2011
Editors
Siegfried Bethke
1, Andre H. Hoang
2, Stefan Kluth
1, Jochen Schieck
3, Iain W. Stewart
41
Max-Planck-Institut f¨ ur Physik (Werner-Heisenberg-Institut), 80805 M¨ unchen
2
University of Vienna, Faculty of Physics, A-1090 Vienna
3
Fakult¨at f¨ ur Physik, Ludwig-Maximilians-Universit¨at M¨ unchen, M¨ unchen
4
Center for Theoretical Physics, MIT, Cambridge, MA 02139
Abstract
These are the proceedings of the Workshop on Precision Measurements of
αsheld at the Max-Planck-Institute for Physics, Munich, February 9-11, 2011. The workshop explored in depth the determination of
αs(m
Z) in the MS scheme from the key cat- egories where high precision measurements are currently being made, including DIS and global PDF fits,
τ-decays, electro-weak precision observables and
Z-decays, event- shapes, and lattice QCD. These proceedings contain a short summary contribution from the speakers, as well as the lists of authors, conveners, participants, and talks.
Supported by: MPI Munich, TUM/LMU Excellence Cluster, University of Vienna
Authors and Speakers
S. Aoki (U. Tsukuba), M. Beneke (RWTH Aachen), S. Bethke (MPI), J. Bl¨umlein (DESY), N. Brambilla (TUM), S. Brodsky (SLAC), S. Descotes-Genon (LPT), J. Erler (IF-UNAM), S. Forte (U. Milano), T. Gehrmann (U. Z¨urich), C. Glasman
(U. Madrid), M. Golterman (San Francisco State U.), S. Hashimoto (KEK), S. Kluth (MPI), A. Kronfeld (Fermilab), J. K¨uhn (KIT), P. Lepage (Cornell),
A. Martin (Durham U.), V. Mateu (MIT), S. Menke (MPI), Y. Nomura (UC Berkeley), C. Pahl (MPI), F. Petriello (Argonne/Northwestern), A. Pich (U.
Valencia), K. Rabbertz (KIT), G. Salam (CERN/Princeton/LPTHE), H. Schulz (HU Berlin), R. Sommer (DESY), M. Steinhauser (KIT), B. Webber (U.
Cambridge), CP. Yuan (Michigan State U.), G. Zanderighi (Oxford U.)
Conveners and Speakers without written contributions
C. Davies (U. Glasgow), Y. Dokshitzer (U. Paris-6), A. H¨ocker (CERN), W. Hollik (MPI), K. Moenig (DESY), V. Radescu (Heidelberg), B. Reisert (MPI)
Additional Participants
R. Abbate (MIT), H. Abramowicz (MPI), J. Arguin (LBL), C. Bobeth (TUM-IAS), D. Boito (U. Barcelona), D. Britzger (DESY), V. Chekelian (MPI), G. Duckeck
(LMU), M. Fickinger (U. Arizona), P. Fritzsch (HU Berlin), M. Gouzevitch (CERN), G. Grindhammer (MPI), G. Heinrich (MPI), M. Jamin (ICREA/U.
Barcelona), R. Kogler (DESY), A. Lenz (TUM), A. Levy (MPI), G. Luisoni (U. Durham), P. Mastrolia (MPI), W. Ochs (MPI), S. Peris (U. Barcelona), C. Sturm (MPI), J. Terron (U. Madrid), A. Vairo (TUM), S. Weinzierl (U. Mainz)
1 Introduction
The “Workshop on Precision Measurements of α
s” was held at the Max Planck Institute for Physics, February 9th through 11th of 2011. The meeting brought together experts from several different fields where high precision measurements of α
s(m
Z) are currently being made. Main goals of the workshop were to facilitate discussion between the groups, and in particular to give speakers the opportunity to explain details that one would normally not be able to present at a conference, but which have an important impact on the analyses. In each field the session was led off by a review speaker, followed by more specialized talks, and was closed with a dedicated time period for discussions.
There were 67 physicists who took part in the workshop, and 35 talks were presented.
Slides as well as background reference materials are available on the conference website http://www.mpp.mpg.de/alphas
The sessions and talks in the workshop program were
• Welcome
– “World Summary of α
s(2009) and beyond”, S. Bethke
• α
sfrom Deep Inelastic Scattering and Global Fits
– “Review of α
sDeterminations from Jets at HERA” by C. Glasman – “α
sfrom Deep-Inelastic Scattering: DESY Analysis” by J. Bl¨ umlein – “CTEQ-TEA Parton Distribution Functions and α
s” by C.P. Yuan – “α
sin MSTW Analyses”, A. Martin
– “Unbiased α
sfrom Global Fits: The NNPDF Approach” by S. Forte – “Hera PDF” by B. Reisert
– Discussion Session on DIS and Global Fits, convened by V. Radescu
• Measurements of α
sfrom τ Decays
– “α
sDeterminations from Hadronic τ Decays” by A. Pich
– “α
sfrom Contour Improved Perturbation Theory (CIPT)” by S. Descotes-Genon – “Fixed Order Perturbation Theory (FOPT) Analysis” by M. Beneke
– “FOPT and CIPT in τ Decays” by S. Menke
– “Duality Violations in Hadronic τ Decays” by M. Goltermaan – “Perturbative Input to τ Decays” by J. K¨ uhn
– “Running and Decoupling of α
sat Low Scales” by M. Steinhauser – Discussion Session on τ Decays, convened by A. H¨ocker
• α
sfrom Z Decays and Electroweak Observables – “α
sin Electroweak Physics” by J. K¨ uhn
– “α
swith Global Analysis of Particle Properties (GAPP)” by J. Erler – “α
sfrom the Hadronic Width of the Z ” by K. M¨onig
– Discussion Session on Elecroweak Analyses, convened by W. Hollik
• α
sfrom Event Shape Measurements
– “Review of event-shape measurements of α
s” by G. Salam
– “α
sat NNLO and NNLA from (mainly) ALEPH data” by T. Gehrmann – “NNLO and Classic Power Corrections” by B. Webber
– “α
sfrom Soft-Collinear Effective Theory analysis” by V. Mateu
– “Five jets at LEP at NLO and α
s(m
Z)” by G. Zanderighi
– “Jet and Event Shape Observables at the LHC” by K. Rabbertz – “Monte Carlo Tuning with Professor” by H. Schulz
– “Experimental Issues and Combination of Results” by S. Kluth – Discussion Session on Event Shapes, convened by Y. Dokshitzer
– MPI Colloquium, “On the Other Side of Asymptotic Freedom” by Y. Dokshitzer
• Lattice Calculations and Quarkonia
– “Lattice QCD Calculations and α
s” by A. Kronfeld
– “The QCD Coupling from Lattice QCD (HPQCD)” by G.P. Lepage – “α
sfrom Lattice QCD (PACS-CS)” by S. Aoki
– “α
sfrom Lattice QCD (JLQCD)” by S. Hashimoto – “α
sfrom Lattice QCD (ALPHA)” by R. Sommer – “α
sfrom Bottomonium” by N. Brambilla
– Discussion Session on Lattice QCD, convened by C. Davies
• Applications and Future of α
sMeasurements – “α
sfor New Physics” by Y. Nomura
– “The Strong Coupling and LHC Cross Sections” by F. Petriello – “α
sat the International Linear Collider (ILC)” by C. Pahl – “The Principle of Maximum Conformality” by S. Brodsky – Final Discussion Session, convened by S. Bethke
This web proceedings represent a collection of extended abstracts and references for the presentations, summarizing the most important results and issues. In these writeups, unless otherwise indicated, the strong coupling α
s(µ) is defined in the MS scheme, and α
s(m
Z) is the coupling with five light quark flavors.
Acknowledgments
We would like to thank all participants for their effort to travel to Munich and for making the Workshop on Precision Measurements of α
sa very stimulating meeting. We cordially thank our secretary Mrs. Rosita Jurgeleit for her excellent assistance, and the staff of the Max-Planck-Institute for their invaluable support.
Munich, May 2011
Siggi Bethke
Andr´e Hoang
Stefan Kluth
Jochen Schieck
Iain Stewart
2 Proceedings Contributions
Page S. Bethke
Workshop Introduction . . . 8 C. Glasman
Review of α
sDeterminations from Jets at HERA . . . 10 J. Bl¨ umlein
α
s(M
Z2) in NNLO Analyses of Deep-Inelastic World Data . . . 13 CP. Yuan
CTEQ-TEA Parton Distribution Functions and α
s. . . 15 A. Martin
α
Sin MSTW Analyses . . . 17 S. Forte
α
s(M
Z) with NNPDF Parton Distributions . . . 19 A. Pich
Tau Decay Determination of the QCD Coupling . . . 21 S. Descotes-Genon
α
sfrom τ Decays using Contour-Improved Perturbation Theory . . . 23 M. Beneke
Fixed-Order Analysis of the Hadronic τ Decay Width . . . 25 S. Menke
FOPT and CIPT in τ Decays . . . 27 M. Golterman
Duality Violations in Hadronic τ Decays and the Value of α
s. . . 30 H. K¨ uhn
Perturbative Input to τ Decays . . . 32
M. Steinhauser
Running and Decoupling of α
s. . . 35 J. Erler
α
swith GAPP . . . 37 G. Salam
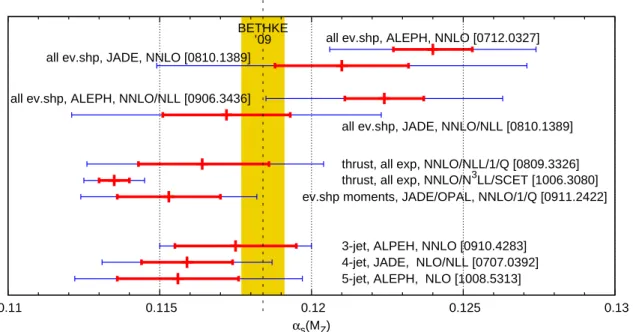
Review of Event-Shape Measurements of α
s. . . 40 T. Gehrmann
α
sat NNLO(+NLLA) from (mainly) ALEPH Data . . . 42 B. Webber
Next-to-Next-to-Leading Order and “Classic” Power Corrections . . . 44 V. Mateu
α
sfrom Thrust at N
3LL with Power Corrections . . . 46 G. Zanderighi
α
sfrom Five-Jet Observables at LEP . . . 49 K. Rabbertz
Jet and Event Shape Observables at LHC . . . 51 H. Schulz
MC tuning with Professor . . . 53 S. Kluth
α
Sfrom Event Shapes in e
+e
−: Experimental Issues and Combination of Results . . . 55 A. Kronfeld
Lattice QCD Calculations and α
s. . . .57 P. Lepage
HPQCD: α
sfrom Lattice QCD . . . 60 S. Aoki
α
sfrom PACS-CS . . . 63
S. Hashimoto
α
sfrom JLQCD . . . 64 R. Sommer
α
sfrom the ALPHA Collaboration . . . 65 N. Brambilla
α
sDetermination at the Y (1S) Mass . . . 67 Y. Nomura
α
sfor New Physics . . . 69 F. Petriello
The effect of α
Son Higgs Production at the LHC . . . 71 C. Pahl
α
sfrom the ILC . . . 73 S. Brodsky
The Principle of Maximum Conformality . . . 75 S. Bethke
Workshop Conclusion . . . 77
Workshop on Precision Measurements α
s2011:
Welcome and Introduction
Siegfried Bethke
Max-Planck-Institute of Physics, Munich, Germany
Heartiest welcome to all participants of the 2011 Workshop on Precision Measurements on α
sat the Max-Planck-Institute of Physics at Munich! The principal organisers, i.e. Andre Hoang (Vienna Univ.), Stefan Kluth (MPP Munich), Jochen Schieck (LMU Munich), Iain Stewart (MIT) and myself, are very glad to see so many representatives and world-experts from all subfields of the workshop topics present at this meeting.
Measurements of α
s, one of the basic constants of nature whose numerical value is not given by any theory, continue to be at the fore-front of theoretical and experimental endeavors in particle physics. The purpose of this workshop is
• to review the latest theoretical developments and experimental studies in this field,
• to discuss and possibly solve open questions and issues which currently limit the pre- cision to which α
sis known,
• to provide input for calculating a new 2011 world average of α
s(m
Z)
The latest comprehensive summary of α
smeasurements and calculation of a world com- bined average value of α
s(m
Z) was given in [1] in 2009, which resulted in
α
s(m
Z) = 0.1184 ± 0.0007 .
This result was also adopted by the latest review of the particle data group [2].
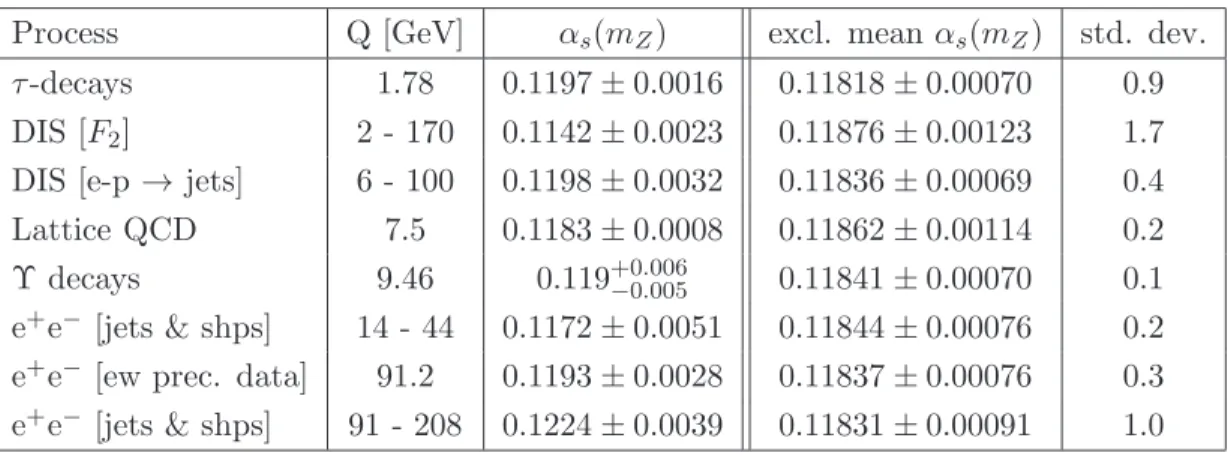
Table 1: Summary of recent measurements of
αs(m
Z). The rightmost two columns give the exclusive mean value of
αs(m
Z) calculated
withoutthat particular measurement, and the number of standard deviations between this measurement and the respective exclusive mean.
Process Q [GeV]
αs(m
Z) excl. mean
αs(m
Z) std. dev.
τ
-decays 1.78 0.1197
±0.0016 0.11818
±0.00070 0.9
DIS [F
2] 2 - 170 0.1142
±0.0023 0.11876
±0.00123 1.7
DIS [e-p
→jets] 6 - 100 0.1198
±0.0032 0.11836
±0.00069 0.4
Lattice QCD 7.5 0.1183
±0.0008 0.11862
±0.00114 0.2
Υ decays 9.46 0.119
+0.006−0.0050.11841
±0.00070 0.1
e
+e
−[jets & shps] 14 - 44 0.1172
±0.0051 0.11844
±0.00076 0.2
e
+e
−[ew prec. data] 91.2 0.1193
±0.0028 0.11837
±0.00076 0.3
e
+e
−[jets & shps] 91 - 208 0.1224
±0.0039 0.11831
±0.00091 1.0
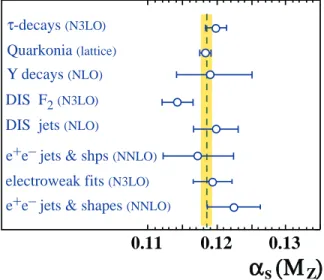
Figure 1: Summary of measurements of α
s(m
Z). The vertical line and shaded band mark the final world average value of α
s(m
Z) = 0.1184 ± 0.0007 determined from these measurements.
0.11 0.12 0.13
α (Μ ) s
Z Quarkonia (lattice)DIS F2(N3LO)
τ-decays (N3LO)
DIS jets (NLO)
e+e– jets & shps (NNLO)
electroweak fits (N3LO)
e+e– jets & shapes (NNLO)
Υ decays (NLO)
The individual results entering that determination of α
s(m
z) are given in Table 1, and a graphical representation in Fig. 1; see [1] and references therein. All results are compatible with the quoted overall world average; the largest deviation from an exclusive mean being less than two standard deviations (interpreting quoted uncertainties of α
sresults as gaussian errors). In fact, the χ
2of the overall average is close to unity per degree of freedom [1]. While the 2009 average came out in a rather consistent way, some questions and potential problems remained:
• the individual result with smallest quoted uncertainties is from lattice QCD; it largely dominates (not so much) the overall average and (mainly) its assigned error;
• there are large systematic differences between different studies of α
sfrom τ decays, depending on the type of perturbative prediction (CIPT and FOPT), leading to an increased uncertainty assigned to the value listed in Table 1;
• are there systematic unknowns in the DIS/F
2result?
• theoretical uncertainties are defined using different definitions in most of the input studies; do they lead to a consistent guess-timate of the overall uncertainties?
As will be seen in the course of this workshop, the consistency of an overall new world summary may look more unfavorable in the light of some of the most recent results (see the summary contribution to this workshop [3]).
References
[1] S. Bethke, Eur.Phys.J. C64 (2009) 689-703, arXiv:0908.1135 [hep-ph].
[2] Particle Data Group, J.Phys.G G37 (2010) 075021.
[3] S. Bethke, these proceedings.
Review of α
sdeterminations from jets at HERA
Claudia Glasman
(On behalf of the H1 and ZEUS Collaborations) Universidad Aut´onoma de Madrid, Spain
The H1 and ZEUS Collaborations at HERA have performed precise determinations of α
s(M
Z) using observables such as jet cross sections, ratios of jet cross sections, and internal structure of jets in different regimes. Some of them are reviewed in this report. In addition, the energy-scale dependence of the coupling has been determined very precisely. The results are in good agreement with the predicted running of α
swith small experimental uncertainties in a wide range of the scale.
Values of α
s(M
Z) were extracted by the H1 Collaboration from the double-differential inclusive-jet, dijet and trijet cross sections at low Q
2(5 < Q
2< 100 GeV
2) using 43.5 pb
−1of integrated luminosity [1]. Jets were searched using the k
Tcluster algorithm in the Breit frame with P
T> 5 GeV and − 1 < η
LABjet< 2.5. The values of α
s(M
Z) extracted are shown in Table 1 (rows 1, 2 and 3; row 4 shows the combined value). These values have small experimental uncertainties; however, the theoretical uncertainty, dominated by terms beyond NLO, is large. A reduction of the theoretical uncertainties can be achieved by determining α
s(M
Z) from the trijet to dijet ratio; the value obtained is shown in row 5 and has a smaller theoretical uncertainty.
Values of α
s(M
Z) were extracted by the H1 Collaboration from the double-differential inclusive-jet, dijet and trijet normalised cross sections at medium Q
2(150 < Q
2< 15000 GeV
2) using 395 pb
−1of integrated luminosity [2]. Jets were searched using the k
Tcluster algo- rithm in the Breit frame with P
T> 5 GeV and − 0.8 < η
LABjet< 2. The values of α
s(M
Z) extracted are shown in rows 6, 7 and 8. Row 9 shows the combined α
s(M
Z) value, which has a very small experimental uncertainty; the theoretical uncertainties, though still dominated by the terms beyond NLO, are smaller than for the low Q
2analysis. This reduction was accomplished by using normalised cross sections, for which correlated uncertainties cancel, and making the extraction at higher Q
2, where the contribution from the terms beyond NLO is reduced.
The ZEUS Collaboration extracted values of α
s(M
Z) from the inclusive-jet cross sections based on the k
T, anti-k
Tand SIScone jet algorithms at high Q
2(Q
2> 500 GeV
2) using 82 pb
−1of integrated luminosity [3],[4]. Jets were searched in the Breit frame with E
T,Bjet> 8 GeV and − 2 < η
Bjet< 1.5. The values of α
s(M
Z) extracted are shown in rows 10, 11 and 12. Row 13 shows an updated value using HERA II statistics ( L = 300 pb
−1) [5]. The experimental uncertainty is dominated by the jet energy scale and amounts to 2%. The theoretical uncertainties are dominated by the terms beyond NLO and amount to around 1.5% for the three jet algorithms. The reduction of the theoretical uncertainty was obtained by restricting to the high Q
2region; even though the experimental uncertainty increases at high Q
2(mainly due to statistics), the total uncertainty remains small.
Values of α
s(M
Z) were extracted by the ZEUS Collaboration from the inclusive-jet cross
section in photoproduction at high E
Tjet(21 < E
Tjet< 71 GeV) using 189 pb
−1of integrated
luminosity [6],[7]. Jets were searched using the k
T, anti-k
Tand SIScone jet algorithms in the
laboratory frame. The values of α
s(M
Z) extracted are shown in rows 14, 15 and 16. These
have similar precision. In photoproduction, there is an additional uncertainty coming from the photon PDFs, which is as large as that coming from higher orders.
A completely different approach to the extraction of α
sat HERA is given by the analysis of the internal structure of jets. The internal structure of jets can be studied by means of the integrated jet shape and the subjet multiplicity. The ZEUS Collaboration extracted values of α
s(M
Z) from the measured mean integrated jet shape [8] for E
Tjet> 21 GeV using 82.2 pb
−1of integrated luminosity and from the mean subjet multiplicity [9] for E
Tjet> 25 GeV with 38.6 pb
−1of integrated luminosity. Jets were searched using the k
Tcluster algorithm in the laboratory frame. The values of α
s(M
Z) extracted are shown in rows 17 and 18. In both cases, the experimental uncertainties are small; however, the theoretical uncertainty, dominated by the terms beyond NLO, is much bigger than for the extraction from jet cross sections.
From the results presented, it is concluded that the dominant uncertainty in the extrac- tion of α
s(M
Z) at HERA comes from terms beyond NLO. This uncertainty decreases with increasing Q
2or E
Tjet, so an extraction at high Q
2or E
Tjetis advantageous to minimise this contribution. In addition, such uncertainty cancels partially when ratios of jet cross sections are used for the extraction, and lower Q
2or E
Tjetvalues can be used. The uncertainties coming from the PDFs are also smaller as Q
2increases.
To summarise, jet physics at HERA provides precise values of α
s(M
Z) in different regimes and precise determinations of the running of the coupling over a wide range of the scale.
There is still room for improvement. All HERA data have been analysed: the values of α
s(M
Z) obtained have very small experimental uncertainties; the theoretical uncertainties are dominant, in particular that coming from terms beyond NLO. Therefore, enormous benefit will be gained from NNLO calculations for jet cross sections at HERA to improve the precision in α
s(M
Z).
References
[1] H1 Collaboration, F.D. Aaron et al., Eur. Phys. J. C 67 (2010) 1.
[2] H1 Collaboration, F.D. Aaron et al., Eur. Phys. J. C 65 (2010) 363.
[3] ZEUS Collaboration, S. Chekanov et al., Phys. Lett. B 649 (2007) 12.
[4] ZEUS Collaboration, H. Abramowicz et al., Phys. Lett. B 691 (2010) 127.
[5] ZEUS Collaboration, H. Abramowicz et al.,
http://www-zeus.desy.de/public results/functiondb.php?id=ZEUS-prel-10-002.
[6] ZEUS Collaboration, H. Abramowicz et al.,
http://www-zeus.desy.de/public results/functiondb.php?id=ZEUS-prel-10-003.
[7] ZEUS Collaboration, H. Abramowicz et al.,
http://www-zeus.desy.de/public results/functiondb.php?id=ZEUS-prel-10-015.
[8] ZEUS Collaboration, S. Chekanov et al., Nucl. Phys. B 700 (2004) 3.
[9] ZEUS Collaboration, S. Chekanov et al., Phys. Lett. B 558 (2003) 41.
[10] C. Glasman, hep-ex/0506035.
[11] H1 and ZEUS Collaborations, H1prelim-07-132 and ZEUS-prel-07-025,
http://www-zeus.desy.de/public results/functiondb.php?id=ZEUS-prel-07-025.
Process Collab. Value Exp. Th. Total (%)
(1) Inc. jets at low Q
2H1 0.1180 0.0018
+0.0124−0.0093 +0.0125−0.0095 +10.6−8.1(2) Dijets at low Q
2H1 0.1155 0.0018
+0.0124−0.0093 +0.0125−0.0095 +10.8−8.2(3) Trijets at low Q
2H1 0.1170 0.0017
+0.0091−0.0073 +0.0093−0.0075 +7.9−6.4(4) Combined low Q
2H1 0.1160 0.0014
+0.0094−0.0079 +0.0095−0.0080 +8.2−6.9(5) Trijet/dijet at low Q
2H1 0.1215 0.0032
+0.0067−0.0059 +0.0074−0.0067 +6.1−5.5(6) Inc. jets at medium Q
2H1 0.1195 0.0010
+0.0052−0.0040 +0.0053−0.0041 +4.4−3.4(7) Dijets at medium Q
2H1 0.1155 0.0009
+0.0045−0.0035 +0.0046−0.0036 +4.0−3.1(8) Trijets at medium Q
2H1 0.1172 0.0013
+0.0053−0.0032 +0.0055−0.0035 +4.7−3.0(9) Combined medium Q
2H1 0.1168 0.0007
+0.0049−0.0034 +0.0049−0.0035 +4.2−3.0(10) Inc. jets at high Q
2(anti-k
T) ZEUS 0.1188
+0.0036−0.0035 +0.0022−0.0022 +0.0042−0.0041 +3.5−3.5(11) Inc. jets at high Q
2(SIScone) ZEUS 0.1186
+0.0036−0.0035 +0.0025−0.0025 +0.0044−0.0043 +3.7−3.6(12) Inc. jets at high Q
2(k
T; HERA I) ZEUS 0.1207
+0.0038−0.0036 +0.0022−0.0023 +0.0044−0.0043 +3.6−3.6(13) Inc. jets at high Q
2(k
T; HERA II) ZEUS 0.1208
+0.0037−0.0032 +0.0022−0.0022 +0.0043−0.0039 +3.6−3.2(14) Inc. jets in γp (anti-k
T) ZEUS 0.1200
+0.0024−0.0023 +0.0043−0.0032 +0.0049−0.0039 +4.1−3.3(15) Inc. jets in γp (SIScone) ZEUS 0.1199
+0.0022−0.0022 +0.0047−0.0042 +0.0052−0.0047 +4.3−3.9(16) Inc. jets in γp (k
T) ZEUS 0.1208
+0.0024−0.0023 +0.0044−0.0033 +0.0050−0.0040 +4.1−3.3(17) Jet shape ZEUS 0.1176
+0.0013−0.0028 +0.0091−0.0072 +0.0092−0.0077 +7.8−6.5(18) Subjet multiplicity ZEUS 0.1187
+0.0029−0.0019 +0.0093−0.0076 +0.0097−0.0078 +8.2−6.6HERA average 2004 0.1186 ± 0.0011 ± 0.0050 ± 0.0051 ± 4.3
HERA average 2007 0.1198 ± 0.0019 ± 0.0026 ± 0.0032 ± 2.7
Table 1: Values of α
s(M
Z) extracted from jet observables at HERA together with their
uncertainties (rows 1 to 18). The 2004 [10] and 2007 [11] HERA averages are shown in the
last two rows.
α
s( M
2Z
) in NNLO Analyses of Deep-Inelastic World Data
S. Alekhin
1,2, J. Bl¨ umlein
1, H. B¨ottcher
1, and S.-O. Moch
11
Deutsches Elektronen-Synchrotron, DESY, Platanenallee 6, D-15738 Zeuthen, Germany
2
Institute for High Energy Physics, 142281 Protvino, Moscow Region, Russia
The present world data of deep-inelastic scattering (DIS) reached a precision which allows the measurement of α
s(M
Z2) from their scaling violations with an error of δα
s(M
Z2) ≃ 1%. This requires at least NNLO analyses, since NLO fits exhibit scale uncertainties of ∆
r,fα
s(M
Z2) ∼ 0.0050. The NNLO values for α
sobtained are summarized in the following Table.
αs
(M
Z2)
BBG 0.1134
+0.0019−0.0021valence analysis, NNLO [1]
GRS 0.112 valence analysis, NNLO [2]
ABKM 0.1135
±0.0014 HQ: FFNS
Nf= 3 [3]
ABKM 0.1129
±0.0014 HQ: BSMN-approach [3]
JR 0.1124
±0.0020 dynamical approach [4]
JR 0.1158
±0.0035 standard fit [4]
MSTW 0.1171
±0.0014 [5]
ABM 0.1147
±0.0012 FFNS, incl. combined H1/ZEUS data [6]
Gehrmann et al. 0.1153
±0.0017
±0.0023
e+e−thrust [7]
Abbate et al. 0.1135
±0.0011
±0.0006
e+e−thrust [8]
BBG 0.1141
+0.0020−0.0022valence analysis, N
3LO [1]
world average 0.1184
±0.0007 [9]
NNLO non-singlet data analyses have been performed in [1] and [2]. The analysis of Ref. [1]
is based on an experimental combination of flavor non-singlet data referring to F
2p,d(x, Q
2) for x < 0.35 and using the respective valence approximations for x > 0.35. The d − u distributions and the O(α
2s) heavy flavor corrections were accounted for. At low Q
2and at large x also at low W
2higher twist corrections have to be taken into account [10]. The corresponding region was cut out in [1] performing the fits for the leading twist terms only.
The analysis could be extended to N
3LO effectively due to the dominance of the Wilson coefficient in this order [11] if compared to the anomalous dimension, cf. [1] and [12]. This analysis led to an increase of α
s(M
Z2) by +0.0007 if compared to the NNLO value.
A combined singlet and non-singlet NNLO analysis based on the DIS world data, in- cluding the Drell-Yan and di-muon data, needed for a correct description of the sea-quark densities, was performed in [3]. In the fixed flavor number scheme (FFNS) the value of α
s(M
Z2) is the same as in the non-singlet case [1]. The comparison between the FFNS and the BMSN scheme [13] for the description of the heavy flavor contributions induces a sys- tematic uncertainty ∆α
s(M
Z2) = 0.0006. The NNLO analyses of Ref. [4] are statistically compatible with the results of [1] and [3] while those of [5] yield a higher value.
In Ref. [6] the combined H1 and ZEUS data were accounted for in a NNLO analysis for
the first time, which led to a shift of +0.0012. However, running quark mass effects [14] and
the account of recent F
Ldata reduce this value again to the NNLO value given in [3]. We
mention that other recent NNLO analyses of precision data, as the measurement of α
s(M
Z2)
using thrust in high energy e
+e
−annihilation data [7], [8] result in lower values than the
2009 world average [9] based on NLO, NNLO and N
3LO results. The sensitivity of the fits
to a precise description of the longitudinal structure function F
Lhas been demonstrated in [15] recently, in the case of the NMC data. Inconsistent descriptions of F
Linduce a high value of α
sof ∼ 0.1170 to be compared with that obtained in [5]. It is observed that the values of
αs
(M
Z2) with
σNMCwith
F2NMCdifference NNLO 0.1135(14) 0.1170(15) +0.0035
≃2.3σ NNLO +F
L O(α3s) 0.1122(14) 0.1171(14) +0.0050
≃3.6σ
α
sfound in NLO fits are systematically higher than those in NNLO analyses. α
smea- surements based on jet data can be performed presently at NLO only. Here typical values obtained are α
s(M
Z2) = 0.1156
+0.0041−0.0034[16], α
s(M
Z2) = 0.1161
−+0.00410.0048[17] in recent examples.
The precise knowledge of α
s(M
Z2) is of instrumental importance for the correct prediction of the Higgs boson cross section at Tevatron and the LHC [18].
References
[1] J. Bl¨ umlein, H. B¨ottcher and A. Guffanti, Nucl. Phys.
B774(2007) 182; Nucl. Phys. Proc.
Suppl.
135(2004) 152.
[2] M. Gl¨ uck, E. Reya and C. Schuck, Nucl. Phys.
B754(2006) 178.
[3] S. Alekhin, J. Bl¨ umlein, S. Klein and S. Moch, Phys. Rev.
D81(2010) 014032.
[4] P. Jimenez-Delgado and E. Reya, Phys. Rev.
D79(2009) 074023.
[5] A. D. Martin, W. J. Stirling, R. S. Thorne, G. Watt, Eur. Phys. J.
C64(2009) 653.
[6] S. Alekhin, J. Bl¨ umlein and S. O. Moch, PoS D
IS2010(2010) 021, and in preparation.
[7] T. Gehrmann, M. Jaquier, G. Luisoni, Eur. Phys. J.
C67(2010) 57.
[8] R. Abbate, M. Fickinger, A. H. Hoang, V. Mateu, I. W. Stewart, arXiv:1006.3080 [hep-ph].
[9] S. Bethke, Eur. Phys. J.
C64(2009) 689.
[10] S. I. Alekhin, S. A. Kulagin and S. Liuti, Phys. Rev. D
69(2004) 114009;
J. Bl¨ umlein and H. B¨ottcher, Phys. Lett. B
662(2008) 336.
[11] J. A. M. Vermaseren, A. Vogt, S. Moch, Nucl. Phys.
B724(2005) 3.
[12] P. A. Baikov, K. G. Chetyrkin, Nucl. Phys. Proc. Suppl.
160(2006) 76.
[13] M. Buza, Y. Matiounine, J. Smith, W. L. van Neerven, Eur. Phys. J.
C1(1998) 301.
I. Bierenbaum, J. Bl¨ umlein and S. Klein, Phys. Lett. B
672(2009) 401.
[14] S. Alekhin, S. Moch, arXiv:1011.5790 [hep-ph].
[15] S. Alekhin, J. Bl¨ umlein and S. Moch, arXiv:1101.5261 [hep-ph].
[16] R. Frederix, S. Frixione, K. Melnikov, G. Zanderighi, JHEP
1011(2010) 050.
[17] V. M. Abazov
et al.[ D0 Collaboration ], Phys. Rev.
D80(2009) 111107.
[18] S. Alekhin, J. Bl¨ umlein, P. Jimenez-Delgado, S. Moch and E. Reya, Phys. Lett.
B697(2011)
127.
CTEQ-TEA Parton Distribution Functions and α
sHung-Liang Lai,
1,2Marco Guzzi,
3Joey Huston,
2Zhao Li,
2Pavel Nadolsky,
3Jon Pumplin,
2Daniel Stump,
2and C.-P. Yuan
21
Taipei Municipal University of Education, Taipei, Taiwan
2
Department of Physics and Astronomy, Michigan State University, East Lansing, MI 48824-1116, U.S.A.
3
Department of Physics, Southern Methodist University, Dallas, TX 75275-0175, U.S.A.
Abstract
After summarizing a simple method to fully reproduce the correlated dependence of theoretical cross sections on the QCD coupling strength
αsand parameters of parton distribution functions (PDFs), we present a series of CTEQ6.6AS and CT10.AS PDFs, realizing this approach, for
αsvalues in the interval 0.113
≤αs(M
Z)
≤0.123. If
αsis solely determined by the QCD global analysis data, and not by the world average value of
αs(M
Z) as done in the CT10 PDF analysis, we find that
α(MZ) = 0.1197
±0.0061 at the 90% CL.
In a recent paper [1], we examined the dependence of parton distribution functions (PDFs) on the value of the QCD coupling strength α
s(M
Z), in the QCD global analysis performed by the CTEQ-TEA (Tung et al.) group. We demonstrated a simple method that is rigorously valid in the quadratic approximation normally applied in PDF fitting, and fully reproduces the correlated dependence of theoretical cross sections on α
sand PDF parameters. This method is based on a statistical relation that allows one to add the uncertainty produced by α
s, computed with some special PDF sets, in quadrature with the PDF uncertainty obtained for a fixed α
svalue (such as the CTEQ6.6 PDF set). A series of four CTEQ6.6AS PDFs realizing this approach, for α
svalues between 0.116 and 0.120, was made available online [2]. Using these PDFs, the combined α
sand PDF uncertainty can be assessed for theoretical predictions at the Fermilab Tevatron and Large Hadron Collider. In a more recent paper [3], we provided a similar series, CT10.AS PDFs, but with a larger range of α
svalues, from 0.113 to 0.123 [4].
Below, we summarize a few important features of, for example, the CTEQ6.6AS PDF analysis. Using the setup of the CTEQ6.6 PDF analysis and taking the world-average (w.a.) value [5] (α
s)
w.a.± (δα
s)
w.a.= 0.118 ± 0.002 (at 90% CL [6].) as a separate data point in addition to the complete CTEQ6.6 set of hadronic scattering data, we allow α
s(M
Z) to vary within the global fits and find
α
s(M
Z) = 0.1180 ± 0.0019 (at 90% CL). (1)
Thus, the constraint on α
s(M
Z) is dominated by the world-average uncertainty, (δα
s)
w.a..
Using the α
sseries of PDFs, and including the PDF uncertainty, we can estimate the uncer-
tainties of cross section calculations. For any calculated quantity σ, we denote the central
prediction, corresponding to α
s(M
Z) = 0.118, by σ
0. There are two contributions to the un- certainty: the PDF uncertainty (∆σ
PDF) and the α
suncertainty (∆σ
αs) of σ. The combined uncertainty ∆σ for CTEQ6.6+CTEQ6.6AS is (∆σ)
2= (∆σ
PDF)
2+ (∆σ
αs)
2.
The independence of the α
suncertainty from the PDF uncertainty in the CTEQ6.6AS method does not preclude existence of some correlation between the α
sand PDF parameters.
This correlation arises from the hadronic scattering experiments, which probe a variety of combinations of the PDFs and α
s, and can be closely examined by analyzing the correlation cosine as introduced in Refs. [7]. For that purpose, we performed the full fit CTEQ6.6FAS with the floating α
sand examined the correlation between α
s(M
Z) and individual PDFs f
a(x, Q). Fig. 8 of [1] shows the correlation cosine, cos ϕ versus x, for the PDFs that have the largest correlations with α
s(M
Z), at Q = 2 and 85 GeV. The best-fit value of α
s(M
Z) is thus determined by several types of the data, probing the gluon evolution in DIS at moderately small x, the singlet PDF evolution in DIS at large x, and HERA charm semi-inclusive DIS data. The correlation of each kind disappears if the relevant data set is removed.
After the completion of Refs. [1] and [3], we performed a similar analysis on the deter- mination of α
s(M
Z) value but with the CT10 setup. We find that, without including the world-average α
s(M
Z) value as an input data, the constraints of the global fit on α
sare relatively weak, and
α
s(M
Z) = 0.1197 ± 0.0061 (at 90% CL), (2) where the error is an estimate of the uncertainty (at about 90 % C.L.) from all typical sources, including the statistical error, dependence on the parametrization form and free theoretical parameters. Within this range, χ2 exhibits nearly parabolic dependence on α
s. Eq. 2 shows clearly that constraints imposed on α
sby the hadronic scattering data only are significantly weaker than from the world average data point.
Finally, we note that replacing the NMC F
2data by the corresponding differential cross section data in the CT10.AS PDF global analysis does not change our conclusion about the determination of the α
s(M
Z) value.
References
[1] H.L. Lai, et al., Phys. Rev. D82, 054021.
[2] http://hep.pa.msu.edu/cteq/public/cteq6.html.
[3] H.L. Lai, et al., Phys. Rev. D82, 074024.
[4] http://hep.pa.msu.edu/cteq/public/ct10.html.
[5] S. Bethke, Eur. Phys. J. C64, 689 (2009). ).
[6] M. Botje et al., arXiv:1101.0538 [hep-ph].
[7] P. M. Nadolsky, et al., Phys. Rev. D78, 013004 (2008).
α
Sin MSTW analyses
A.D. Martin, W.J. Stirling, R.S. Thorne, and G. Watt
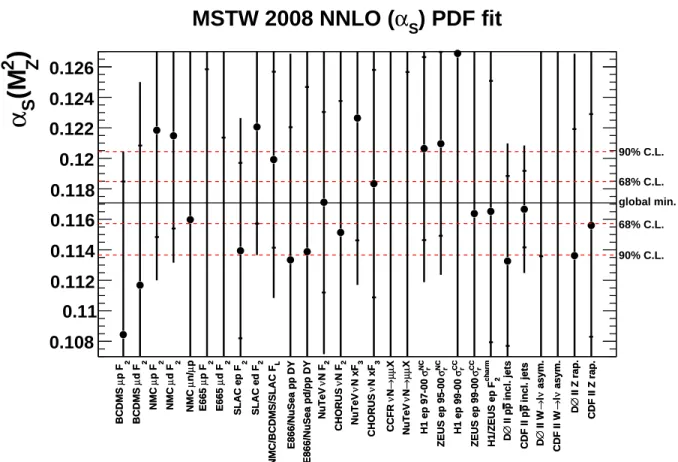
IPPP, Durham; Cavendish Lab., Cambridge; Physics, UCL; Theory Group, CERN In the MSTW2008 [1] global PDF analysis of DIS and related hard-scattering data the value of α
S(M
Z2) was left as a free parameter and its optimum value determined. Subse- quently, in [2], a detailed study was made of its ‘experimental’ uncertainty. The values found in the NLO and NNLO analyses are
NLO: α
S(M
Z2) = 0.1202
+0.0012−0.0015(68% C.L.)
+0.0032−0.0039(90% C.L.), (1) NNLO: α
S(M
Z2) = 0.1171
+0.0014−0.0014(68% C.L.)
+0.0034−0.0034(90% C.L.). (2) We note that the NNLO value is smaller than that at NLO since NNLO evolution is faster and since NNLO coefficient functions are generally positive. Fig. 1 shows the constraints on α
Scoming from the individual data sets in the NNLO global analysis. Inclusive jet production is the only process proportional to α
2Sat LO. Moreover, since the normalisation of the CDF jet production data is tied to the observed CDF Z rapidity distribution, we see that these jet data give the tightest constraint on α
S. In addition to the ‘experimental’
errors shown in (1) and (2), there is also a ‘theory’ uncertainty, which is estimated [2] to be
± 0.003 at NLO and at most ± 0.002 at NNLO.
The α
S(M
Z2) values found by MSTW are, in general, greater than those of other PDF analyses, and are more consistent with the world average value [3]. There are two reasons for this. First, MSTW have a more flexible low-x parametrisation of the input gluon PDF.
The flexibility is required by the data and gives a negative input behaviour at small x, which is confirmed by the NNPDF analyses [4]. The second reason is the inclusion of the Tevatron jet data in the analysis. It is informative to repeat the NNLO MSTW2008 analysis fitting only inclusive DIS data, which gives α
S(M
Z2) = 0.1104 compared to α
S(M
Z2) = 0.1171 for the global fit, but with a negative input gluon for x > 0.4 due to lack of a data constraint, implying a negative F
2charmand an awful description of Tevatron jet data (χ
2/N
pts.∼ 10).
Fixing the high-x gluon parameters to be the same as in the global fit gives α
S(M
Z2) = 0.1172 in the DIS-only fit. A DIS-only fit without BCDMS data gives α
S(M
Z2) = 0.1193, while a global fit without BCDMS data gives α
S(M
Z2) = 0.1181. We conclude that the Tevatron jet data are vital to pin down the high-x gluon, giving a smaller low-x gluon by the momentum sum rule, at the expense of some deterioration in the fit quality of BCDMS data. Thus, both reasons imply a larger α
Sfrom the scaling violations ( ∼ α
Sg) of HERA data.
Concerning the NMC data, ref. [5] notes that it is better to use the NMC cross-section measurements rather than F
2, since for x < 0.12 NMC used a Q
2-independent R = σ
L/σ
Tvalue to extract their default F
2. Does this bias the MSTW value of α
S? As a check, we repeated the NNLO global fit with the NMC F
2extracted using the SLAC R
1990(x, Q
2) for all x, which is close to the MSTW NNLO R(x, Q
2) in the most relevant x bins. This has a very small effect, with the NNLO α
S(M
Z2) moving only from 0.1171 to 0.1167.
Finally, let us comment on the ‘low’ value α
S(M
Z2) = 0.1141
+0.0020−0.0022obtained in [6], since
it is often taken as the ‘DIS’ value in world average compilations, where it is listed as DIS
F
2(N
3LO) [3]. This determination assumes that F
2is pure non-singlet for x > 0.3. We may
2p FµBCDMS 2d FµBCDMS 2p FµNMC 2d FµNMC pµn/µNMC 2p FµE665 2d FµE665 2SLAC ep F 2SLAC ed F LNMC/BCDMS/SLAC F E866/NuSea pp DY E866/NuSea pd/pp DY 2N FνNuTeV 2N FνCHORUS 3N xFνNuTeV 3N xFνCHORUS Xµµ→NνCCFR Xµµ→NνNuTeV NC rσH1 ep 97-00 NC rσZEUS ep 95-00 CC rσH1 ep 99-00 CC rσZEUS ep 99-00 charm 2H1/ZEUS ep F incl. jetsp II p∅D incl. jets pCDF II p asym.νl→ II W∅D asym.νl→CDF II W II Z rap.∅D CDF II Z rap.
2p FµBCDMS 2d FµBCDMS 2p FµNMC 2d FµNMC pµn/µNMC 2p FµE665 2d FµE665 2SLAC ep F 2SLAC ed F LNMC/BCDMS/SLAC F E866/NuSea pp DY E866/NuSea pd/pp DY 2N FνNuTeV 2N FνCHORUS 3N xFνNuTeV 3N xFνCHORUS Xµµ→NνCCFR Xµµ→NνNuTeV NC rσH1 ep 97-00 NC rσZEUS ep 95-00 CC rσH1 ep 99-00 CC rσZEUS ep 99-00 charm 2H1/ZEUS ep F incl. jetsp II p∅D incl. jets pCDF II p asym.νl→ II W∅D asym.νl→CDF II W II Z rap.∅D CDF II Z rap.
) 2 Z (M S α
0.108 0.11 0.112 0.114 0.116 0.118 0.12 0.122 0.124 0.126
global min.
68% C.L.
68% C.L.
90% C.L.
90% C.L.
) PDF fit α
SMSTW 2008 NNLO (
Figure 1: Ranges of α
S(M
Z2) for which data sets are described within their 90% C.L. limit (outer error bars) or 68% C.L. limit (inner error bars) in the NNLO global fit. The points ( • ) indicate the values of α
S(M
Z2) favoured by each individual data set n, that is, the values for which χ
2nis minimised. The figure is taken from [2].
examine this assumption using MSTW2008 PDFs. For the F
2pand F
2dmeasurements with x > 0.3 we have χ
2= 329 for 282 data points, of which 160 are from BCDMS. However, if we consider only non-singlet contributions then χ
2= 1449 for 282 data points. In fact, contributions other than valence quarks amount to about 10% at x = 0.3, and still 2% at x = 0.5. We conclude that the anomalously low value of α
Sfound in [6] is due both to the dominance of BCDMS data (cf. Fig. 1) and to the neglect of singlet contributions.
References
[1] MSTW, Eur. Phys. J. C 63 (2009) 189.
[2] MSTW, Eur. Phys. J. C 64 (2009) 653.
[3] S. Bethke, Eur. Phys. J. C 64 (2009) 689; these proceedings.
[4] R. D. Ball et al., arXiv:1101.1300 [hep-ph].
[5] S. Alekhin, J. Bl¨ umlein and S. Moch, arXiv:1101.5261 [hep-ph].
[6] J. Bl¨ umlein, H. B¨ottcher and A. Guffanti, Nucl. Phys. B 774 (2007) 182.
α
s(M
Z) with NNPDF parton distributions
The NNPDF Collaboration
Simone Lionetti
1, Richard D. Ball
3, Valerio Bertone
4, Francesco Cerutti
5, Luigi Del Debbio
3, Stefano Forte
1,2, Alberto Guffanti
4, Jos´e I. Latorre
5,
Juan Rojo
1,2and Maria Ubiali
6.
1
Dipartimento di Fisica, Universit`a di Milano and
2
INFN, Sezione di Milano, Via Celoria 16, I-20133 Milano, Italy
3
Tait Institute, University of Edinburgh,
JCMB, KB, Mayfield Rd, Edinburgh EH9 3JZ, Scotland
4
Physikalisches Institut, Albert-Ludwigs-Universit¨at Freiburg, Hermann-Herder-Straße 3, D-79104 Freiburg i. B., Germany
5
Departament d’Estructura i Constituents de la Mat`eria, Universitat de Barcelona, Diagonal 647, E-08028 Barcelona, Spain
6


![Figure 1: Global fit results (solid error bars) at various theoretical stages from [1]](https://thumb-eu.123doks.com/thumbv2/1library_info/4024482.1542004/47.918.121.763.127.413/figure-global-results-solid-error-various-theoretical-stages.webp)

![Figure 1: LO (red) and NLO (blue) predictions including scale uncertainties for an analysis similar as in [3] (left) in comparison to the one suggested here (right) requiring a minimal p T of 25% of the leading dijet average < p T 1,2 >.](https://thumb-eu.123doks.com/thumbv2/1library_info/4024482.1542004/52.918.153.720.118.379/figure-predictions-including-uncertainties-analysis-comparison-suggested-requiring.webp)
