Bulk sensitive Photoelectron Spectroscopy of strongly correlated transition metal oxides
Inaugural–Dissertation zur
Erlangung des Doktorgrades
der Mathematisch–Naturwissenschaftlichen Fakult¨at der Universit¨at zu K¨oln
vorgelegt von
Thomas Christoph Koethe aus D¨usseldorf
K¨oln 2007
Prof. Dr. S. Bl¨ugel
Tag der m¨undlichen Pr¨ufung: 08.12.2006
Contents
1 Introduction 5
1.1 Strongly correlated transition metal oxides . . . . 5
1.2 Photoelectron Spectroscopy: theoretical concept . . . . 6
1.3 Photoelectron Spectroscopy: Bulk vs. Surface . . . . 8
1.4 Scope . . . 15
2 Bulk vs. Surface electronic structure of LaCoO3 17 2.1 Introduction . . . 17
2.2 Experimental . . . 22
2.3 Temperature dependence: bulk sensitive photoemission . . . 23
2.4 Emission angle dependence . . . 25
2.5 Importance of surface treatment . . . 28
2.6 Ionic considerations on the spin state at the surface . . . 29
2.7 Photon energy dependence . . . 31
2.8 Conclusions . . . 33
3 Metal–Insulator Transition in VO2 35 3.1 Introduction . . . 35
3.2 Experimental . . . 38
3.3 Valence band . . . 38
3.4 Conduction band . . . 40
3.5 Resonant Photoemission . . . 43
3.6 Valence band and core level XPS . . . 46
3.7 Conclusions . . . 48
4 Dimer formation in the low T phase of Ti2O3 51 4.1 Introduction . . . 51
4.2 Experimental . . . 53
4.3 Results and Discussion . . . 54
4.4 The Hydrogen Molecule Model . . . 57
4.5 Conclusions . . . 62
5 On the Metal–Insulator Transition in GdBaCo2O5.5 63 5.1 Introduction . . . 63
5.2 Experimental . . . 66
5.3 Results and Discussion . . . 66
5.4 Conclusions . . . 70 3
Zusammenfassung 75
Acknowledgements 89
Erkl¨arung 93
Publications 95
Lebenslauf 97
Chapter 1 Introduction
1.1 Strongly correlated transition metal oxides
Modern solid state research has focused to a considerable extent on the physics of strongly correlated electron systems, because here we find interesting phenom- ena arising from conditions far away from well understood limiting cases. Being such systems, the transition metal oxides have shown to be a very wide ranged field for researchers to find unexpected properties like unconventional superconduc- tivity in the high–Tc cuprates [1] and the ruthenates [2], large magnetoresistance effects in manganites (CMR) [3], and cobaltates (GMR) [4, 5], as well as unusual phase transitions like metal–insulator– [6] or spin–state transitions [7], and many more. Correlated systems provide the advantage to test novel theoretical models and methods of computation, and mark the frontier for fundamental research, not to mention the unpredictable technological impact. In other words, transition metal oxides represent model systems for the development of theoretical descriptions, and therefore are essential for the progress of our understanding of nature. On the other hand, the physical properties found in these materials are invaluable for technologi- cal applications, and in some cases even open up completely new possibilities. They can often be tuned in a certain range by external parameters like temperature, pres- sure, external electric or magnetic fields, or composition, e. g. by doping. In order to optimize the properties of a material for a specific application, a solid understanding of their physics is required.
The characteristics of a solid are to a large extent determined by the electronic structure. This includes the electronic configuration of the ground state of the sys- tem, as well as electronic excitations, which are responsible for the macroscopic properties like resistivity, magnetism and so on. The experimental investigation of the electronic structure is therefore an essential part in the attempt to under- stand the physical properties of a material. A wide range of spectroscopic methods is available and is also needed to investigate the electronic excitations, and in turn provides insight into the mechanisms responsible for its macroscopic physical proper- ties. Photoelectron spectroscopy (PES) investigates the excitations from the ground state to all accessible final states with an electron removed, or in other words, a hole injected to the system [8–10]. It is therefore by concept directly related to the one- hole propagator, represented by the Green’s function. In the actual measurement,
5
however, we encounter practical difficulties that can prevent us from extracting the true one-particle Green’s function of the bulk system from the experimental spectra.
The most important one is the surface contribution to the spectra, which has in the past often been neglected in the analysis, though in most cases not at all negligi- ble. For correlated systems, this is particularly serious since correlation effects are known to be most sensitive to the local environment, and in turn the electronic structure of the surface may well be quite different from the bulk. In the transition metal oxides, this is a consequence of the atomic like 3d orbitals which make up the low energy excitations in a PES spectrum. We can demonstrate the remark- able differences between surface and bulk electronic structure, and the confusion in the literature resulting from the discussion of experimental data without account of surface effects, using as an example LaCoO3. Our bulk-sensitive study reveals that the bulk system is predominantly in a low spin state up to room temperature, with a thermally populated higher spin state contribution, whereas the surface appears to be in a high spin state independent of temperature. The lack of bulk sensitivity is also the reason why the experimental photoemission data of VO2 available in the literature did not show the enormously large transfer of spectral weight across the metal-insulator transition observed in our bulk-sensitive experiment. The same is true for the absence of distinctive satellite features in the valence band and core level spectra of Ti2O3 in the literature data, and the confusing assignments made for the spectral features in the valence band of GdBaCo2O5.5. These examples show the importance of bulk sensitivity in the investigation of the electronic structure of correlated systems, which is a major issue of today’s solid state physics research.
1.2 Photoelectron Spectroscopy: theoretical con- cept
In a photoemission experiment, a sample is irradiated by light of well defined energy hν. An electron bound to the sample can be excited by the incoming photons and, in case its energy separation from the vacuum level is less than the absorbed photon energy, is emitted to the vacuum. As a result, the system makes an excitation from theN–particle initial state with energyEN0 to a (N−1)–particle final state of energy ENF S−1. The binding energy is identified with the difference of the total energies of the excited final state and the ground state, Eb =ENF S−1−EN0. The photoemission spectrum then is given by the number of electrons as a function of binding energy.
In this description, it is assumed that the photoelectron can escape the solid without interaction with the system left behind, called the sudden approximation. Its validity is the better the higher the kinetic energies of the photoelectrons, as scattering cross sections decay accordingly.
A clear distinction has to be made between the energy scale of the exciting pho- tons and the energy of the excited final states with respect to the ground state, the binding energies. In principle, any final state with total energy not more than the photon energy above the ground state, can be reached. The excess energy of the excitation process, given by the difference of photon energy and binding energy, results in kinetic energy of the photoemitted electron, plus the so–called work func-
1.2 Photoelectron Spectroscopy: theoretical concept 7
tion necessary to overcome the vacuum threshold. Therefore, in a PES experiment not only the high lying excitations with energies close to the photon energy can be measured, but also the low–energy excitations close to the Fermi energy. However, in order to detect sharp and low–lying excitations, the experimental setup has to have an adequate energy resolution. For instance, in order to get a reasonably re- solved valence band spectrum, a resolution of the order of 0.1 eV is necessary, while in x–ray photoelectron spectroscopy (XPS) the excitation energies are of the order of 1 keV.
In order to find a theoretical description of the information provided in a PES spectrum, we have to take a close look at the photoemission process, starting out from the transition probability within Fermi’s Golden Rule,
WIS,F SPES ∝ |hF SN|OPES|ISN0i|2δ ENF S−EN0 −hν
. (1.1)
In this expression, |ISN0i represents the initial state, which is the ground state of the system with energy EN0. |F SNi refers to a N–particle final state with energy ENF S. The photoemission process is signified by the operator OPES, generally given by the operator of interaction between light and matter, Hint = A·pˆ+ h.c., with the vector potential of the electromagnetic field A and the quantum mechanical particle–momentum operatorp. The photoemission operator can be identified withˆ the electromagnetic dipole interaction, −eˆr, with the unit charge e, and takes in second quantization the form
OPES =X
k,i
Mk,iε†kci, (1.2)
composed of the optical matrix elementsMk,i=hk|Hint|ii, the creation operatorsε†k of a photoelectron with momentum k, and the annihilation operators ci of a bound electron in the one–particle state |ii. The N–particle final state thus includes both the system ofN−1 electrons bound to the solid, and the photoemitted free electron.
In the sudden approximation, the two components separate, and the final states are given by
|F SN(k, j)i= ˆa|ki|F SN−1(j)i, (1.3) where ˆa is the anti–symmetrization operator, |ki represents the photoelectron with energy Ek, and |F SN−1(j)i denotes the eigenstates of the (N −1)–electron system with quantum numbers j and energies ENF S−1(j). Hence, the total energy of the N–particle final state is the sum of the energies of the (N − 1) electron system and the photoelectron, ENF S = ENF S−1(j) +Ek, such that conservation of energy is accomplished by the δ–function in the transition probability (1.1).
In order to evaluate the matrix element in (1.1), we also express the initial state as an anti–symmetrized product of a one–particle state, which is annihilated in the photoemission process, and a (N −1) particle state,
|ISN0i= ˆa|ii|ISN−1(i)i=c†i|ISN−1(i)i, (1.4) in which |ISN−1(i)i does not need to be the ground state or even an eigenstate of the (N −1) electron subsystem. In fact, such a separation of the N electron state
does not necessarily have to be meaningful, but we can always find an approximate product state instead. From the representation (1.2) of the photoemission operator in second quantization, we see that it acts on the one–particle states only, and by substituting (1.4) and (1.3) into (1.1), we find
Wi,(k,j)PES ∝ lim
η→0
1
πIm|hk|OP ES|iihF SN−1(j)|ci|ISN0i|2
ENF S−1+Ek−EN0 −hν−iη , (1.5) where the δ–function was rewritten by use of limη→0Imx−1iη = πδ(x). The photo- emission spectrum as a function of the photoelectron energy Ek is given by the sum of (1.5) over i, corresponding to all possibilities of exciting bound electrons, and over j, according to all possible final states fulfilling energy conservation. With the choice of |F SN−1(j)i as eigenstates of the (N −1) electron system, we can use the completeness relation of this basis set in the sum of (1.5) over j, yielding
IPES(Ek)∝ lim
η→0
1
πImX
i,i0
Mk,iMi0,khISN0|c†i0
1
H+Ek−EN0 −hν−iηci|ISN0i, (1.6) sometimes referred to as the photocurrent. We recognize on the right hand side of (1.6) the spectral function A(Ek) in the limit η → 0, convoluted with optical matrix elements. The spectral function is given by the imaginary part of the one–
holepropagator, the Green’s function G(Ek). The photoemission spectrum peaks at photoelectron energies corresponding to poles in (1.5), i. e. at
Ek =EN0 +hν−ENF S−1. (1.7) Note that the often used correspondence between the photoemission spectrum of a system and its occupied electronic density of states in a one-electron description is in general incorrect, as it completely neglects the many-body character of the excitation. The conceptually simple and elegant description of PES in (1.6) makes it a powerful and appealing experimental tool for the investigation of solid state systems. There are, however, practical difficulties which can hamper the access to the basic information on the electronic properties of the system in the actual measurement, as will be discussed in the following section.
1.3 Photoelectron Spectroscopy: Bulk vs. Surface
In photoemission, one always has to deal with surface sensitivity in the sense that a comparably large fraction of the photoemission signal originates from the first few layers of the crystal. This is because the excited photoelectron may lose a certain amount of its kinetic energy due to inelastic scattering with the crystal lattice and electrons. The longer the distance that the photoelectron has to cover until it leaves the crystal, the higher the probability for scattering processes and the average loss of energy. At some point, the electron lost too much energy to overcome the vacuum threshold and cannot escape from the crystal.
Assuming an exponential decrease of the relative number of photoelectrons es- caping the sample with distance z from the surface with an inelastic mean free path λ,
N(z) =N0e−z/λ, (1.8)
1.3 Photoelectron Spectroscopy: Bulk vs. Surface 9
the volume of the sample probed in a photoemission experiment, is given by λ, de- noted as the escape depth, together with the emission angle (cf. figure 1.2). The value of the escape depth is not a sharp number but an average and moreover de- pends on kinetic energy. It is claimed to be more or less insensitive to the material, since the photoemission final states lie very high in energy (≈hν for emission from the valence band), and as a result behave in good approximation like free electrons, independent of the specific properties of the solid they propagate in. From a large
Figure 1.1: Electron escape depth as a function of kinetic energy for various met- als. The data indicate a universal curve with a minimum of 2 – 5 ˚A for kinetic en- ergies of 10 – 100 eV. Figure taken from Prutton [11], as reproduced from [12].
number of measurements, the so–calleduniversal curve has been extracted, given as a solid line in figure 1.1. It shows that the escape depth ranges between 1 and≈ 20
˚A for photon energies between 10 and 1500 eV, as commonly used in experiment, with a minimum around 50 eV. This means that in a crystal with lattice spacings of a few ˚A, a photoemission experiment will probe only up to at most ten mono- layers. Furthermore, according to (1.8) the intensity from the surface layers will be disproportionately higher than from deeper layers, causing the spectra to be even more surface sensitive. Note that the validity of the universal curve in the case of correlated systems, especially the increase of the escape depth for photon energies below 10 eV has been questioned, thus the relevance of ultra–violet photoelectron spectroscopy (UPS) for bulk properties, see e. g. [13]. Actually, the escape depth has to be strongly dependent on the electronic structure of the system, since it is deter- mined mostly by the scattering amplitude of the photoelectrons with the electronic system of the solid. Therefore, systems with a wide electronic gap like the band insulators MgO or SrTiO3, for which low energy scattering processes are dominated by the comparably weak electron–phonon interaction, are found to have very large values of the escape depth. Note also that the penetration depth of the light in any case is orders of magnitudes larger and will not be a limiting factor.
The extreme surface sensitivity in the low photon energy range may be advan- tageous and welcome for experiments focused on surface properties. However, in most cases the electronic structure of the bulk material is supposed to be under investigation, and therefore the degree of bulk sensitivity has to be known at least roughly. It has to be kept in mind that maybe not even the most part of the exper- imental data is representative of the bulk system. Considering the intrinsic surface sensitivity of PES, in order to extract from the measured spectra meaningful infor-
mation about the bulk electronic properties, the conditions of measurement have to be carefully chosen to optimize for bulk sensitivity. A number of aspects have to be mentioned in this context, the photon energy being only one of them. As the universal curve in figure 1.1 suggests, the escape depth is maximized by choosing the highest possible photon energy. However, apart from technological difficulties concerning high energy light sources of appropriate resolution etc. on the one hand, and correspondingly electron energy analyzers working in a high voltage range on the other hand, there are also difficulties arising from the photoemission process itself for high photon energies, mainly due to the strong decrease of the photoion- ization cross sections with photon energy, resulting in very low count rates in the experiment. Only in the last few years, considerable progress has been made in the field of hard x–ray PES (HAXPES or HXPES) with photon energies of 10 keV and more, yielding very promising bulk sensitivity, but also a number of experimental, conceptual and technological challenges [14–16]. But even in conventional soft x–ray photoemission, escape depths of 15 – 20 ˚A can be realized with photon energies of a several hundred eV, customarily available in contemporary synchrotron beam lines or conventional x–ray sources, thus providing a reasonable bulk sensitivity in most cases.
Another significant issue in terms of bulk sensitivity is the sample preparation, which is a matter of several aspects. One of them is the quality of the sample, not only in the sense of composition, but also of the surface definition. In this respect, the use of single crystals is naturally preferable, since here the surface is well defined in terms of lattice planes, and usually an even surface termination can be achieved.
On the other hand, polycrystalline samples, which in most cases can be synthesized by much less sophisticated means, are more commonly, sometimes even the only samples available at all. However, the surface of a polycrystalline sample does not have a well defined orientation, and will therefore not be flat and even. This not only increases the surface area, but also effectively reduces the bulk probing volume. As a result, the surface contribution to the photoemission spectrum of a polycrystalline sample is considerably enhanced with respect to the bulk contribution, as compared to a single crystal sample. Moreover, to establish a clean surface is for polycrystalline samples much harder. First of all, the roughness of the surface results in a higher degree of contamination. The often used method to scrape off surface contamination, due to the granular consistence more easily tends to bury adsorbate atoms into the surface instead of removing them. Upon fracturing polycrystalline samples instead, again a rough surface is produced, which is rather determined by grain boundaries and impurities, than by the crystal structure, and so is of poor crystalline quality.
These difficulties exist in principle for single crystals as well, but mostly are less severe. Scraping the surface is unfavourable, not only due to the danger to rub in impurities, but also because of the macroscopic scratches left on the surface, which in turn becomes more like a polycrystalline sample. The bottom line is, that the desirable condition is a single crystal which is cleaved in–situ, this means split in such a way, that a well defined surface of low crystallographic indices shows up.
This is not always possible, however. While many ionic compounds of simple lattice structure usually cleave nicely into specular surfaces, systems of more complicated structure, or soft materials rather break into terraced surfaces or are simply cut
1.3 Photoelectron Spectroscopy: Bulk vs. Surface 11
along the blade.
After so much efforts have been made to establish a well defined clean and flat surface, we still have to take a lot of care about the sample quality. On the one hand, the sample exposes a surface of a certain reactivity to an atmosphere of the lowest possible pressure. As an example, we consider the case that every particle which hits the surface, will stick there, expressed by a sticking coefficient S = 1. An exposure of this surface to a pressure of 2.5×10⁻⁶ torr over one second, a quantity referred to as 2.5 L (Langmuir), results in an estimated contamination of one monolayer. As a result, at a pressure of 10−9 mbar, and with a sticking coefficient of one, the surface is completely covered with adsorbate particles within one hour. Therefore, the sample has to be kept under ultra high vacuum (UHV) conditions, and the experiment should be completed in a few hours — depending on the actual pressure, and the sticking coefficient, which fortunately often is small. As a measure of the surface contamination, photoemission lines of the most common contaminants carbon and oxygen (mostly in form of carbon monoxide and water) can be monitored repeatedly over the time of measurement — usually, if the photon energy permits, the 1s core levels at ≈ 285 and 530 eV, respectively, with the precise binding energies depending on the chemical environment. On the other hand, not only surface contamination effectively changes the sample actually being measured, but also the chemical stability of the system. The sample might either react with contaminants like oxygen, or the chemical composition might change due to evaporation of some constituents, both leading possibly to a system with completely different properties. Since the line shapes and energy positions of the peaks depend on the chemical species, changes in the spectra with time show up clearly and indicate sample degradation.
Still the optimally bulk sensitive experimental setup does not necessarily result in spectra primarily related to the bulk properties. After all, the surface contribu- tion may still be more than negligible and consequently disturb the spectra. In the analysis, possible surface contributions must be considered, preferably by subtrac- tion of a particularly surface sensitive reference spectrum. There are several ways to subtract surface contributions: one is to take the same spectrum at low photon energy, resulting in a considerably shorter escape depth (see figure 1.3) [17]. This ap- proach is however impractical in cases, where the spectrum consists of contributions with independent photoionization cross sections, e. g. from different constituents in a compound, because these also change with photon energy. In turn the shape of the spectrum may change completely, irrespective of any surface effects [18]. As was discussed above, scraping a single crystal can increase the surface contribution to the spectrum noticeably. Another way to increase the surface sensitivity intentionally, is by changing the emission angle [17]. As illustrated in figure 1.2, with a fixed escape depth of the photoelectrons, given by the height of the blue hatched area, the con- tribution from the bulk (green) to the spectrum is maximized for electrons emitted normal to the surface (blue arrow), resulting in the most bulk sensitive geometry.
Note that the surface region (yellow) still makes up a significant fraction of the total probing volume (blue hatched). In contrast, electrons emitted under an angle to the surface normal (red arrow), can still travel the same distance through the solid to the surface, however, a substantially larger fraction of the path is in the surface
region, which means that a correspondingly smaller number of photoelectrons orig- inates from the bulk region. In other words, while the surface volume is the same as for normal emission, the bulk contribution to the probed volume (red hatched) is noticeably smaller. At an angle of 60◦ with respect to the surface normal, the effec- tive probing depth is reduced by a factor 1/2. This procedure is, however, subject to the constraint of a well defined surface orientation, since otherwise the definition of the emission angle becomes meaningless. In experiment, this means that the surface has to be flat on the scale of the measured area, i. e. the spot size of the light.
grazing emission 60°
emission grazing
emission normal
} }volume probed in:
hn normal emission
"surface"
"bulk"
Figure 1.2: The probing volume for nor- mal emission (blue hatched) maximizes the contribution of the bulk (green). The con- tribution of the surface (yellow) is the same in grazing emission (red hatched), but due to the fixed escape depth, the probing depth is reduced by a factor 1/2 at 60◦. The surface sensitivity in PES would not be a major issue if the properties of the system at the surface were equal or at least very similar to the bulk. However, the broken discrete translational invariance at the surface leads to electronic states that are confined to the surface, and in turn do not represent bulk properties. Such surface states tend to show up in the spectrum in form of sharp structures of high intensity, possibly much more pronounced than the actual bulk features. In the case of Sr2RuO4, this situation had created considerable confusion in the literature, when the surface state was not identified as such at first, but interpreted as a bulk feature [19]. The conclusions drawn from this misinterpretation were in disagreement with findings of more bulk sensitive methods [20], and the discrepancy was only resolved by realizing the surface nature of the controversial feature [21].
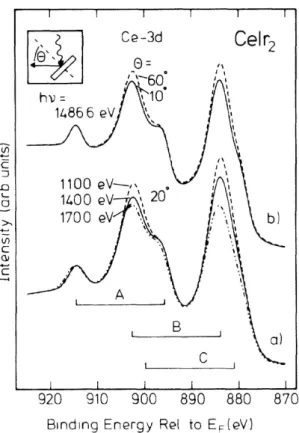
Moreover, the change in environment at the surface, and the possible associated relaxation of the lattice, can lead to substantial changes in the electronic proper- ties of the system at the surface. This is of particular importance for correlated systems, the properties of which often crucially depend on a delicate balance of dif- ferent energy scales, e. g. hybridization strength vs. crystal field, exchange, or local Coulomb repulsion energy. The changes at the surface are most likely to result in a significantly modified electronic structure, as has been shown for a number of correlated systems like rare earth compounds. As an instructive example, Ce 3d core–level photoemission spectra of CeIr2 taken by Laubschat et al. under varying conditions of surface sensitivity are shown in figure 1.3. The spectra consist of three spin–orbit doublets A, B and C related to different final state configurations, 4f0, 4f1 and 4f2, respectively. It turns out that the intensity of structure B changes noticeably both with photon energy, and with emission angle, indicating that it is strongly related to the surface sensitivity of the spectra. In both cases, the intensity consistently appears to be enhanced in the more surface sensitive setup, suggesting that the corresponding final state has an increased overlap with the ground state at the surface. The stabilization of the respective ground state contribution 4f1 at
1.3 Photoelectron Spectroscopy: Bulk vs. Surface 13
Figure 1.3: Ce–3d core–level photo- emission spectra of CeIr2 recorded with varying surface sensitivity: (a) for dif- ferent photon energies and constant electron–emission angle, θ = 20◦; (b) for different angles θand constanthν = 1486.6 eV. The spectra consist of three 3d3/2–3d5/2 doublets due to different 4f final state configurations; they are nor- malized to the same intensity of doublet Aand corrected for background. Figure taken from Laubschat et al. [17].
the surface is supported by similar findings in Ce–4f core–level PES. This is inter- preted as a strong reduction in the 4f hybridization at the surface, which can be confirmed by quantitative simulation of the spectra. The analysis of the surface sen- sitivity dependence not only demonstrates drastically the degree of dissimilarity in the electronic structures of bulk and surface, but also gives a quantitative example of the importance of a consideration of surface effects: previous PES studies of the same systems not taking surface effects into account, had given averaged values of hybridization energies of less than 50% of the true bulk value, and as a result were in disagreement with theoretical predictions [22].
Similarly confusing results have been found in low photon energy measurements from CeRu2Si2 and CeRu2, which are expected to have significantly different elec- tronic properties. While CeRu2Si2 is a so–called heavy fermion system of rather localized 4f states and a Kondo temperature TK = 25 K, the electronic structure of CeRu2 is assumed to be characterized by itinerant 4f electrons due to stronger hybridization, resulting in a Kondo temperature of the order of 1000 K. Despite the quite different nature of the 4f electronic structure, the low photon energy spectra of these systems turn out to be surprisingly similar [18]. As higher photon energy spectra reveal, however, this result is due to the similarsurfaceproperties of the two compounds, while the actualbulkspectra in fact display very dissimilar line shapes, reflecting the different electronic properties [18].
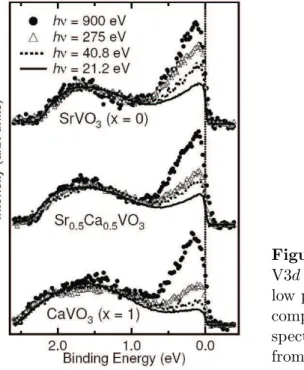
Another famous example where the surface sensitivity issue of PES has led to a misinterpretation of the results, and as a consequence to a wrong model, is the calcium substitution series of the perovskite strontium vanadates, Sr1−xCaxVO3 [23, 24]. The valence band photoelectron spectra of polycrystalline samples taken with UV light (~ω ≤ 50 eV) display a striking x dependence which was interpreted as
a consequence of the increasing distortion from the regular structure for x = 0 with a V–O–V bond angle of 180◦. As the bandwidth W is assumed to be reduced with distortion, the value of U/W increases and correlation effects are expected to gain importance on the spectra. Thus the system was concluded to be close to a Mott–Hubbard transition controlled by bandwidth on tuning the composition. The observed spectra were explained in terms of non–local correlation effects introducing ak–dependent self–energy. On the other hand, thermodynamic and magnetic studies of the vanadates did not show according xdependent behaviour, which led to some confusion and a controversial discussion of either findings [25]. A reinvestigation of the photoemission study using higher photon energies up to 900 eV, and applying a careful surface treatment, was necessary to resolve this issue [13]. Figure 1.4 shows
Figure 1.4: Photon energy dependent V3d PES of Sr1−xCaxVO3. While the low photon energy spectra change with composition, the high photon energy spectra are independent of x. Taken from Sekiyama et al. [13].
the changes of the V 3d spectrum with photon energy, and demonstrates that the seeming xdependence at low photon energies vanishes at higher ones. The decisive improvement of this approach over the previous ones consists in the bulk sensitivity achieved by both a much longer escape depth, from figure 1.1 estimated a factor four, and a well defined clean surface. The changes in the spectra observed in UPS were thus traced back to surface effects and therefore not representative of the bulk.
The importance of surface effects and even the mere consciousness of their pres- ence are of particular importance, as it happens time and time again that experi- mental results have led to wrong interpretations on the ground of such issues. The credibility of PES in general has suffered severely from reports in the literature of erroneous findings due misinterpretation caused by disregard of surface effects, as the above examples demonstrate. It is therefore extremely important to make sure to which extent the measured spectra are actually representative of the bulk elec- tronic properties of the studied system, and in particular to reduce the inevitable surface contribution as much as possible. In these conditions, PES is a very power- ful technique in contemporary solid state science, and permits access to information that no other method can give.
1.4 Scope 15
1.4 Scope
The results of bulk-sensitive photoelectron spectroscopy from a number of correlated transition metal oxides are presented in this thesis. We have chosen systems of model character, not only interesting by themselves, but in particular as examples for a whole class of systems, and as such important test cases for recent theoretical models. In turn, the quality of the experimental data has to be adequate for a comparison to model calculations, above all, the degree of bulk sensitivity. As we have discovered, a large number of previous studies available in the literature turned out to be not sufficiently bulk sensitive, and as a result do not represent reliable data for theoretical modeling.
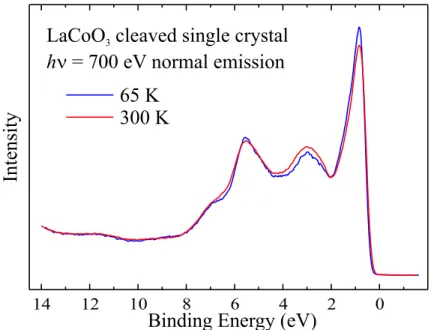
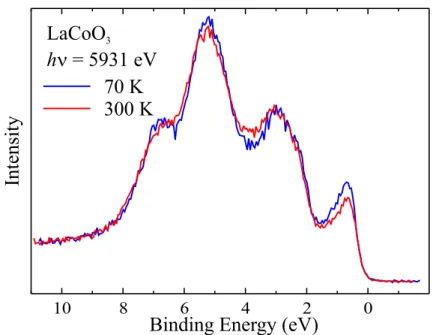
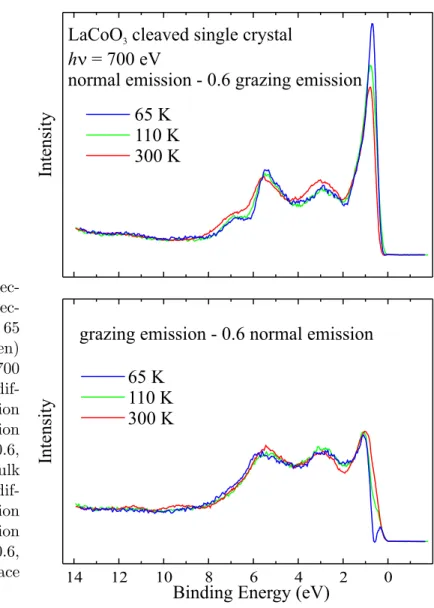
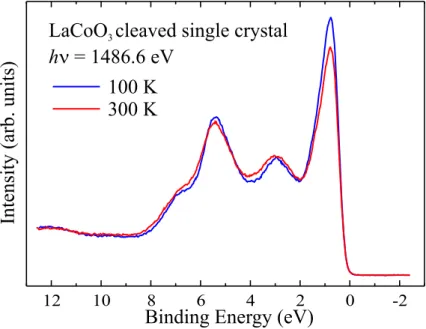
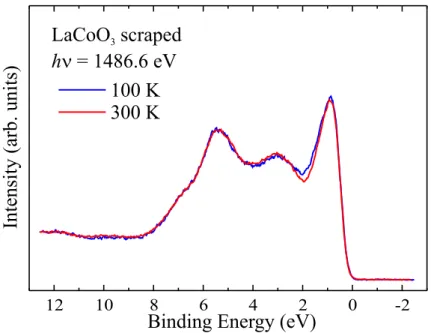
In chapter 2, we present a detailed study of the different contributions from surface and bulk to the valence band spectra of LaCoO3 in the range from 65 K to room temperature, using photon energies between 450 eV and 6 keV and varying degrees of surface sensitivity. We observe a prominent low binding energy peak of temperature dependent weight, which is characteristic of a Co3+ low spin state. By contrast, this feature is not present in previously published results of various groups.
We can show that the literature results are not representative for the bulk system.
By analyzing the emission angle dependence of the spectra, we have been able to separate the bulk and surface contributions. We observe a temperature dependent, predominantly low-spin bulk spectrum, corresponding to the proposed spin state transition, in accordance with the magnetic susceptibility. At the same time, the surface is temperature independent. Based on the line shape analysis, we infer that the Co3+ ion at the surface is in a high spin state.
In chapter 3, we present a detailed study of the valence and conduction bands of VO2 single crystals across the metal-insulator transition using bulk-sensitive photo- electron and O-K x–ray absorption spectroscopies. Our measurements reveal a giant transfer of spectral weight, much more pronounced than shown in previous reports, and even more than that in V2O3 [26]. Particular spectral features signal that the transition is not of the standard Peierls nor single-band Mott-Hubbard type. The valence band spectrum of the metallic phase is characterized by two structures in the V 3d contribution which can be identified with the coherent and incoherent parts of the spectrum. The symmetry and energies of the bands are discussed in connection to the recently determined orbital occupation [27] and to the importance of the k- dependence of the self-energy correction [28]. This analysis reveals the decisive role of the V 3d orbital degrees of freedom. The orbital switching is the key for opening a band gap that is much larger than the energy scale of the transition temperature.
Comparison to recent realistic many body calculations within the dynamical mean field theory using a two-site cluster, shows that much of the k-dependence of the self-energy correction can be cast within a dimer model.
The results of the bulk-sensitive photoemission study of the low temperature insulating phase of Ti2O3 using both soft and hard x–ray photons are presented in chapter 4. We find in both the valence band and the Ti 2p core level spectra structures that have not been reported in the literature yet. The Ti 3d spectral weight displays a two peak structure in the insulating state, which can be identified with the bonding- and antibonding contributions associated with the c axis Ti–
dimers in the crystal structure. Also in the Ti 2p core level spectra we observe additional satellites at lower binding energies. We can find qualitative understanding of these satellites in terms of non-local screening effects from the hydrogen molecule model.
Finally, in chapter 5 another cobaltate system, the recently synthesized GdBaCo2O5.5, is presented. The Co ions possess the same 3d6 configuration as in LaCoO3, however the distinct crystalline environment leads to considerably different properties. With a bulk-sensitive high resolution x–ray photoemission investigation in the temperature range of 80 - 380 K we are able to give reliable information on the electronic properties and the temperature dependence of the spin state in this system. We find that the gap remains finite up to 380 K, implying that the high tem- perature phase above the so-called metal-insulator transition is actually not metallic, in contrast to opposite claims of previous XPS investigations of TbBaCo2O5.5. We show furthermore that the dominating low-spin contribution commonly claimed for the octahedral site at low temperatures does not show up in the valence band spec- tra. From the line shape and the weak temperature dependence in comparison with LaCoO3 we can derive an upper bound for the low spin contribution of 25% at 80 K. These findings cast doubts on most of the current models proposed to explain the complex magnetic and transport behaviour of the layered cobaltates.
Chapter 2
Bulk vs. Surface electronic structure of LaCoO 3
2.1 Introduction
The perovskite transition metal oxides have always been important model systems in the field of solid state physics, as they exhibit a wide range of physical proper- ties and unusual phenomena. One of the most prominent examples of this class is LaCoO3, showing a complicated and still not well understood thermal behaviour in the electronic transport and magnetism properties [29, 30]. It was noticed in the earliest studies in the 1950s already, that these peculiarities are closely related to the 3d6 electronic configuration of the Co3+ ions [31], which has several closely lying configurations with different spin statecharacter. LaCoO3 is also important since it can be considered as the parent compound to a wide range of related systems with interesting properties, like the giant–magentoresistance systems of the doping series La1−xSrxCoO3 [4], and the oxygen deficient systems RBaCo2O5+δ (R = rare earth, see chapter 5). It also represents a model system for the currently very popular unconventional superconductor NaxCoO2 · yH2O [32]. This means that the com- plete comprehension of LaCoO3 is of enormous meaning for the field of cobalt based materials.
The crystal structure of LaCoO3 is a slightly distorted rhombohedral perovskite with two formula units per unit cell, in which the two Co sites are equivalent [33].
The weak distortion seems to have no significant influence on the electronic prop- erties. The resistivity and magnetic susceptibility in the temperature range up to 800 K are shown in figure 2.1 [34]. The resistivity shows a quite unusual behaviour with a thermally activated decrease up to 200 K, followed by a plateau, and an again steeper slope around 400 K. At the same time, the magnetic susceptibility is essentially zero atT = 0 (contributions from impurities in the raw data, open circles in figure 2.1, can be well described by a Curie law, and subtracted, solid circles), increases at finite temperature up to a maximum at ≈100 K, before it turns down again with seemingly a Curie–Weiss behaviour up to another anomaly spread over the range from 400 K to around 600 K.
The vanishing magnetic susceptibility atT = 0 suggests that the ground state of LaCoO3 is non–magnetic, i. e. S= 0, consistent with the absence of any long–range
17
Figure 2.1: Temperature dependence of electrical resistivity (upper panel) and magnetic susceptibility (lower panel) for a crystal of LaCoO3. The inset in the upper panel shows the Arrhenius plot of the resistivity (ρ). Closed circles below 100 K for the susceptibility represent the result of the subtraction of the contribution from Curie–like impurities. A solid line in the lower panel shows the calculated curve based on the molecular field approximation with an energy level separation ∆ between theS= 0 (low–spin) and S = 2 (high–spin) state of the Co ion and with the antiferromagnetic interaction (zJ) between the neighboring high–spin (S = 2) Co ions.
From Yamaguchi et al. [34].
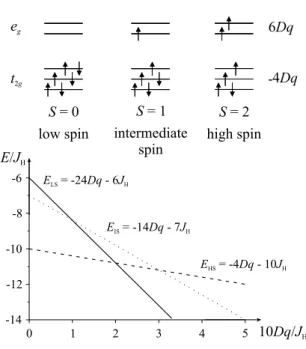
magnetic ordering down to the lowest temperatures [35]. As temperature rises, some magnetic moment evolves, this means the electronic configuration must rearrange such that a finite spin moment results. In the 3d6 configuration, three different spin states are possible, as demonstrated schematically in figure 2.2. In a cubic crystal field 10Dq, the 3dlevels split into a threefold degenerate t2g level lowered in energy by −4Dq with respect to the energy center of gravity, and a twofold degenerate eg
level at 6Dq. For a large value of the crystal field, the lowest 3d6 configuration would be t62g, which results in S = 0, denoted as the low–spin state (LS). On the other hand, Hund’s rule demands a high–spin state (HS) given by t32g↑e2g↑t12g↓ with S = 2 and an energy gainJH per pair of parallel spins. Which spin state is lower in energy depends on the ratio of crystal field to exchange energy: for 10Dq JH, the HS is favoured, in the opposite case the LS. The two become degenerate in this simple ionic picture with cubic crystal field for 10Dq= 2JH. There exists another possible configuration, namely the intermediate–spin state (IS) t32g↑e2g↑t12g↓ with S = 1, which doesn’t seem to be relevant for an isolated ion in a cubic crystal field, as the energy diagram in figure 2.2 shows, because in any case it will be higher in energy than either the LS for a large crystal field, or the HS for a small one. However, the IS configuration may very well be stabilized by lower symmetry crystal fields, or due to band formation in the solid.
The earliest models proposed to explain the resistivity and magnetism of LaCoO3
considered a single excited higher spin state to reproduce the observed temperature dependence in a qualitative way: the increase in magnetic susceptibility up to 100 K is explained by thermal population of either an IS [30] or HS [31, 35] less than 100 meV higher in energy than the LS, and the higher temperature behaviour is attributed to ordering of spin states [31]. The extremely small energy separation between the different spin states must be the result of a very delicate balance of the crystal field and the exchange interaction about the point of cross over [36]. The IS scenario was however claimed to be incompatible with early resistivity measurements [37] and not considered anymore in following investigations for a long time. In early
2.1 Introduction 19
Figure 2.2: Possible spin states in the 3d6 configuration and corresponding en- ergy level diagram for an isolated ion in a cubic crystal field 10Dq in energy units ofJH.
eg
t2g
S= 0 low spin
S= 1 intermediate
spin
S= 2 high spin
6Dq
-4Dq
10Dq J/ H ELS= -24Dq- 6JH
EIS= -14Dq- 7JH
EHS= -4Dq- 10JH
E J/ H
-14 -12 -10 -8 -6
5 4 3 2 1 0
studies, also the decay of a pair of Co3+ ions into a Co2+ and a Co4+ has been considered to be essential for the transport properties at higher temperatures [7, 38].
The predictions of the early models, however, could not be validated by experi- ment, because neither spin state ordering [33] nor charge disproportionation [39–41]
could be observed experimentally. Moreover, spectroscopic investigations claimed a LS up to 420 K and a gradual increase in the HS component at higher tem- peratures [41], which contradicts the magnetic susceptibility results of a spin state transition around 100 K [34]. Only in the mid 1990s, a twist in the discussion of LaCoO3was triggered by the theoretical proposal of an IS ground state configuration in the Co4+ charge transfer system SrCoO3 [42]. As indicated above, hybridization of cobalt ions with oxygen ligands lowers the IS in the 3d5 configuration with re- spect to LS and HS. Since this material is assumed to have predominantly a 3d6L configuration, its electronic structure should be very similar to LaCoO3. A following investigation of LaCoO3 using band structure calculations on the basis of the den- sity functional theory (DFT) in the local density approximation (LDA) including on–site repulsionU, has supported this suggestion, and proposed a completely new scenario for LaCoO3 [43]. Like in the early models, the band structure calculations yield a LS ground state (i. e. at T = 0) responsible for the non–magnetic low tem- perature behaviour. The first excited states, however, are found to be IS, while the lowest configuration of HS appears at noticeably larger total energy. With rising temperature, the crystal lattice expands and as a result, the IS configuration with a singly occupiedeg orbital is stabilized by the energy gain due to strong hybridization with the oxygen ligands. The band structure calculations for changing lattice con- stants show a level crossing at the value corresponding to a temperature of 150 K, as displayed in figure 2.3. This means, that for larger lattice parameters, the lowest configuration is the IS, and in turn, a spin state transition from LS to IS takes place at the crossing point. The IS solution was taken to be orbitally ordered, so that it becomes semiconducting, in agreement with the experimental finding of insulating behaviour below T = 400 K. The orbital order is assumed to become unstable with
Figure 2.3: The total energies for vari- ous spin states of LaCoO3 relative to the energy of the t62ge0g state at 4 K vs. the R3c lattice constant. The corresponding temperatures are also marked. Taken from Korotin et al. [43].
respect to the metallic solution at higher temperatures. However, no evidence for orbital ordering has been found experimentally so far [44]. Moreover, the parameter U = 7.8 eV used in the band structure calculations, is considerably larger than the value of 5.5 eV extracted from spectroscopy [45], and consequently the energy gap at T = 0 of 2.06 eV is much too large as compared to experimental values ranging from 0.2 eV in optical spectroscopy [46] to 0.9 eV in electron spectroscopy [41, 47]. Nev- ertheless, the impact of this work was so influential, that many experimental results on LaCoO3 and related systems have been investigated in terms of models involving the transition to the IS [5, 44, 48–55]. We would like to note that very recently, an LDA+U band structure investigation considering several magnetic configurations and also coexistence of different spin states found a mixed state of LS and HS to be lower in energy than both a uniform IS and a mixed LS and IS state [56]. This indi- cates that the predictive power of LDA/LDA+U investigations on the spin state of LaCoO3 strongly depends on the details of the calculation and therefore should not be overvalued. Very recent experimental studies of the magnetic circular dichroism in the Co-L2,3 x–ray absorption spectra support the very early proposal of a tem- perature dependent energy separation between the spin states [30, 57]. These results suggest a model of a LS ground state with thermal population of HS according to this temperature dependence.
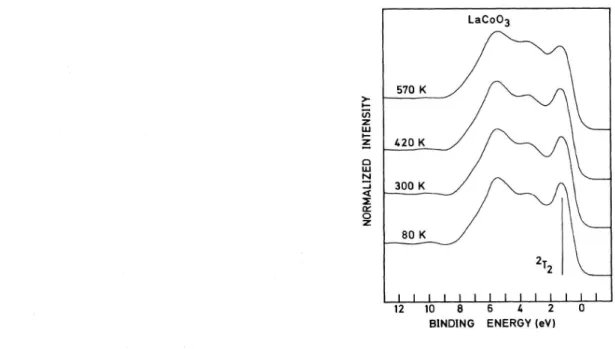
Some confusion about LaCoO3 also stems from discrepancies in experimental results of different techniques. As already mentioned, an early soft–x–ray absorp- tion spectroscopy investigation failed to observe a spin state transition below 500 K, which is incompatible with the observed magnetic susceptibility [41]. It has to be noted, that x–ray absorption and photoemission spectra are in principle very sensi- tive to the spin state, as is demonstrated by the Co 3d photoemission valence band spectrum calculated for a CoO6cluster in the three different spin states shown in the left panel of figure 2.4 [48]. The spectra are clearly distinguishable, in particular the one corresponding to the LS initial state is characterized by a strong low energy line originating from the dominant process t62g(1A1) +hν → t52g(2T2) + photoelectron, well separated from the higher lying final states. The IS and HS spectra show a no- ticeable multiplet structure more equally spaced in energy, leading to broad features.
Therefore a change in the experimental spectrum from purely LS at low tempera- ture to the one at higher temperature with a thermally mixed in contribution of higher spin states, is expected to be clearly observable. However, the results of a