on the optical spectral weights of transition-metal oxides
Inaugural - Dissertation zur
Erlangung des Doktorgrades
der Mathematisch-Naturwissenschaftlichen Fakultät der Universität zu Köln
vorgelegt von
Julia Christina Reul (geb. Küppersbusch) aus Datteln
Köln, im August 2013
Prof. Dr. ir. Paul H. M. van Loosdrecht Vorsitzender der Prüfungskommission:
Prof. Dr. Simon Trebst
Tag der letzten mündlichen Prüfung:
18. Oktober 2013
Contents
1 Introduction 1
2 Electronic structure of correlated electron systems 5
2.1 The Hubbard model . . . . 5
2.2 On-site properties . . . . 7
2.2.1 Crystal structure and crystal-eld splitting . . . . 7
2.2.2 Multiplets . . . . 8
2.3 The multi-orbital Hubbard model . . . . 11
2.4 Superexchange . . . . 11
2.5 Orbital correlations due to orbital-lattice coupling . . . . 13
2.6 Mott-Hubbard excitations and their temperature dependence . . . 14
2.7 Mott-Hubbard and charge-transfer insulators . . . . 16
3 Optical Spectroscopy 19 3.1 Linear response functions and optical constants . . . . 19
3.1.1 Linear response theory . . . . 19
3.1.2 The optical constants . . . . 21
3.1.3 The Kramers-Kronig relation . . . . 22
3.1.4 Reection properties of electromagnetic waves . . . . 23
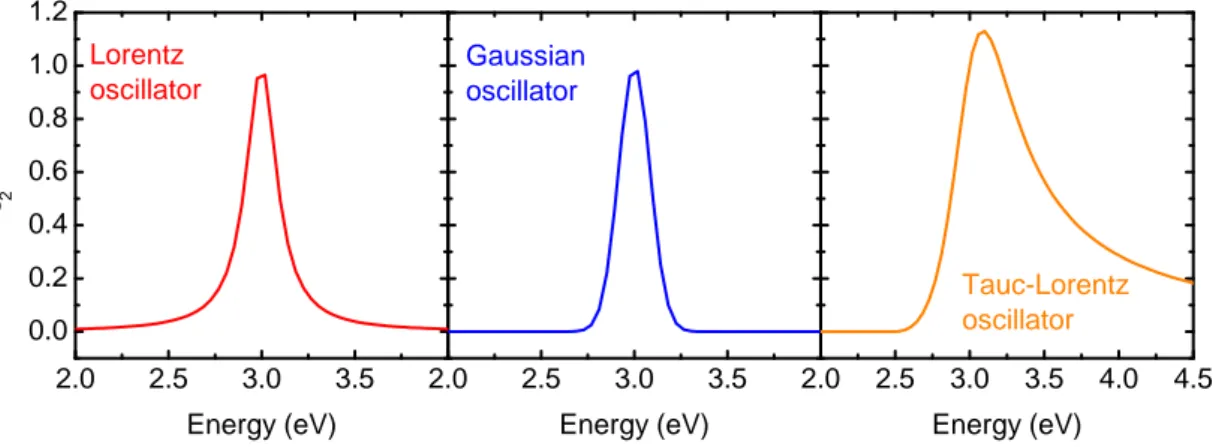
3.1.5 Modeling the dielectric function . . . . 26
3.2 Ellipsometry . . . . 28
3.2.1 Jones and Mueller-matrix formalism . . . . 29
3.2.2 The pseudo-dielectric function . . . . 37
3.2.3 The working principle of a rotating analyzer ellipsometer . 39 3.2.4 A brief presentation of the quantities relevant for the tting procedure . . . . 40
4 Data acquisition and analysis 43 4.1 Data acquisition . . . . 43
4.1.1 The experimental setup . . . . 43
4.1.2 Sample preparation . . . . 46
4.1.3 Mounting, aligning, and calibrating the sample . . . . 48
4.2 Data analysis . . . . 50
4.2.1 Surface eects . . . . 51
i
4.2.2 Parametric models . . . . 51
4.2.3 The spectral weight . . . . 53
5 Probing orbital uctuations in RVO
3(R = Y, rare earth ion) 55 5.1 The compounds RVO
3(R = Y, rare-earth ion) . . . . 56
5.1.1 The crystal structure . . . . 56
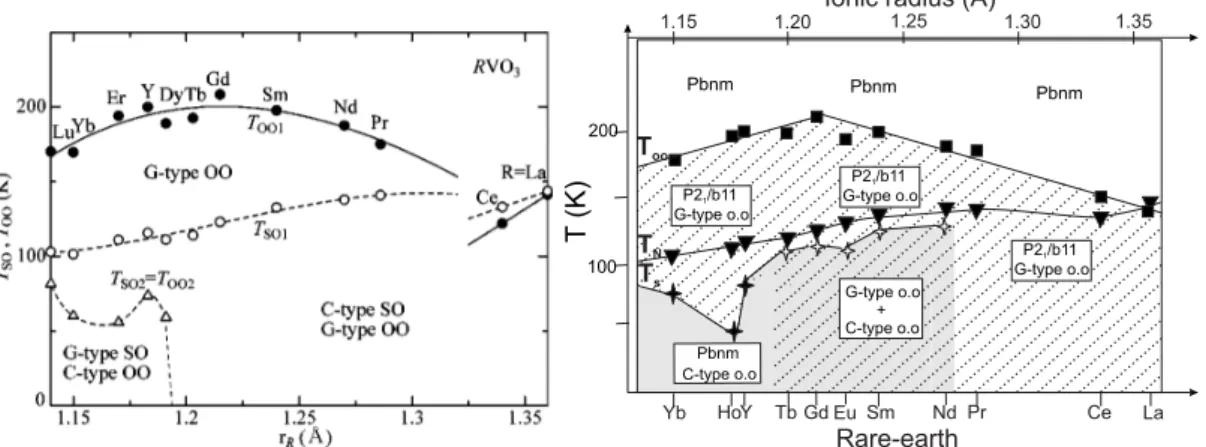
5.1.2 Spin and orbital ordering phase diagram . . . . 58
5.1.3 Importance of orbital uctuations . . . . 59
5.1.4 Details on YVO
3. . . . 63
5.1.5 Details on CeVO
3. . . . 64
5.1.6 Details on GdVO
3. . . . 66
5.1.7 Mott-Hubbard excitations in RVO
3. . . . 70
5.1.8 Probing orbital uctuation by the use of ellipsometry . . . 71
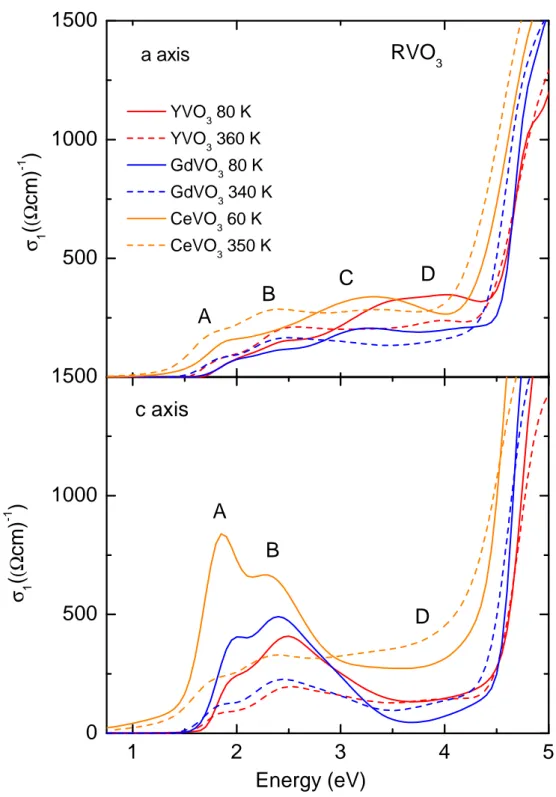
5.2 Experimental data . . . . 76
5.2.1 Optical conductivity of YVO
3. . . . 76
5.2.2 Optical conductivity of GdVO
3. . . . 85
5.2.3 Optical conductivity of CeVO
3. . . . 90
5.3 Discussion . . . . 95
5.3.1 Multiplet assignment and temperature dependence . . . . 95
5.3.2 Comparison with literature . . . 100
5.3.3 Temperature dependence of the spectral weight: strength of orbital uctuations . . . 102
5.4 Observation of an excitonic resonance in RVO
3. . . 106
5.4.1 Literature on photoemission spectroscopy and band struc- ture calculations . . . 107
5.4.2 Exciton formation in correlated insulators . . . 111
5.4.3 Hubbard exciton in RVO
3. . . 112
5.5 Conclusion . . . 116
6 Ellipsometry on LaSrFeO
4117 6.1 The compound LaSrFeO
4. . . 117
6.1.1 Motivation . . . 117
6.1.2 Structure, spins, and orbitals . . . 120
6.2 Experimental data . . . 122
6.3 Discussion . . . 127
6.3.1 Charge-transfer and Mott-Hubbard excitations . . . 127
6.3.2 Peak assignment . . . 130
6.3.3 Temperature dependence . . . 132
6.4 Conclusion . . . 137
7 Ellipsometry on cobaltates 139
7.1 The compounds . . . 140
7.1.1 The compounds LaCoO
3and EuCoO
3. . . 140
7.1.2 The compounds La
2-xSr
xCoO
4and La
2-xCa
xCoO
4. . . 150
7.2 Experimental data . . . 160
7.2.1 Optical conductivity of LaCoO
3and EuCoO
3. . . 161
7.2.2 Optical conductivity of La
2-xSr
xCoO
4(x = 0, 0.33, 0.45, 0.5, and 0.9) and La
1.5Ca
0.5CoO
4. . . 170
7.3 Discussion . . . 190
7.3.1 Results on LaCoO
3and EuCoO
3. . . 190
7.3.2 Results on La
2-xSr
xCoO
4(x = 0, 0.33, 0.45, 0.5, 0.9) and La
1.5Ca
0.5CoO
4. . . 196
7.4 Conclusion . . . 212
8 Conclusion 213
List of Figures 217
List of Tables 223
Bibliography 225
1 Introduction
The Coulomb interaction between individual electrons plays an important role for many transition-metal compounds. Whereas they are expected to exhibit metallic behavior due to their partially lled d shells, many transition-metal com- pounds have shown to be insulating by experiment [1]. A variety of fascinating phenomena has been observed such as high-temperature superconductivity and colossal-magneto resistance [24]. The physical model which has proven success- ful in describing the remarkable properties of these so-called correlated electron systems is the Hubbard model [5,6]. It accounts not only for the energy gain due to charge delocalization, but also adds a term which describes the on-site Coulomb repulsion between individual electrons. It follows a splitting of the valence band into a lower and an upper Hubbard band. As a consequence of charge localization, the atomic degrees of freedom, like spin, charge, and orbital, retain their meaning in these correlated insulators [7]. A competition between the individual degrees of freedom arises and complex spin, orbital, and charge ordering phase diagrams have been observed.
In the framework of this thesis a variety of transition-metal compounds is inves- tigated by means of spectroscopic ellipsometry in the energy range from 0.75 eV to 5.5 eV for temperatures ranging from 15 K to 490 K. Ellipsometry measures the change of the polarization state of a polarized light beam which is reected from the sample surface. The technique of ellipsometry bears two signicant advantages over conventional reection measurements. It acquires two independent parame- ters, which are needed to describe the state of polarization, at each wavelength.
As a consequence, it yields both, the real and the imaginary part of the complex dielectric function directly without a Kramers-Kronig transformation. Further- more, it is a self-normalizing technique and no reference measurement is required.
Due to its high accuracy, ellipsometry is particularly well suited to determine the precise temperature dependence of the optical spectral weights.
The optical spectra of correlated insulators are dominated by Mott-Hubbard ex- citations, i.e. an electron transfer between neighboring transition-metal sites i and j , and charge-transfer excitations, i.e. an electron transfer from the ligand oxygen 2p band to the transition-metal 3d band. Depending on the relative en- ergy cost of charge-transfer and Mott-Hubbard excitations, one distinguishes be- tween two kinds of correlated insulators. In a Mott-Hubbard insulator the lowest
1
dipole-allowed excitation corresponds to a Mott-Hubbard excitation, whereas the charge-transfer excitation is the lowest dipole-allowed excitation in a so-called charge-transfer insulator. Typically, early transition-metal compounds belong to the group of Mott-Hubbard systems, while late ones are characterized as being of charge-transfer type. Due to the multiplet splitting of Mott-Hubbard and charge- transfer absorption bands in these multi-orbital systems, the optical conductivity shows a complex multi-peak structure. The spectral weight of the Mott-Hubbard excitations is very sensitive to nearest-neighbor spin-spin and orbital-orbital cor- relations [8, 9]. A change of spin and orbital correlations with temperature leads to a characteristic spectral-weight transfer between the individual components of the optical multiplets [10]. This has been very nicely demonstrated for the 3d
4systems LaMnO
3and LaSrMnO
4[11, 12]. Here, the orbital occupation is inde- pendent of temperature because of the large ligand-eld splitting of the singly occupied e
gorbitals, thus the spectral-weight transfer of the Mott-Hubbard exci- tations is mainly governed by the spin-spin correlations. However, the behavior of the 3d
1Mott-Hubbard insulators YTiO
3and SmTiO
4is still not understood in this context [13]. It is the aim of this thesis to systematically study the im- portance of spin/orbital correlations and also excitonic eects on the temperature dependence of the optical spectra.
First, the focus lies on the 3d
2systems RVO
3( R = Y, rare earth ion). Undoped
RVO
3can be characterized as a Mott-Hubbard insulator with pseudocubic per-
ovskite structure. The orbital degree of freedom plays a decisive role in RVO
3.
The coupling of the orbitals to the lattice is only weak in these systems with active
t
2gorbitals and as a consequence orbital and spin degrees of freedom are intimately
related to each other. The hopping amplitude between orbitals on adjacent lattice
sites determines both the size and the sign of the magnetic exchange coupling be-
tween spins. It follows a complex spin and orbital ordering phase diagram which is
expected to be reected in a pronounced anisotropy and temperature dependence
of the optical spectra. It is still not clear under which circumstances the orbitals
themselves may be considered as a truly low-energy degree of freedom displaying
low-energy excitations, in other words, to establish compounds with strong orbital
uctuations. The typical situation in most Mott-Hubbard insulators is that the
orbitals are strongly coupled to the lattice, i.e. the crystal eld, opening a gap
in the orbital excitations of a few 100 meV or larger. In this case, it usually is
sucient to consider rigid orbital order with no uctuations. However, it has been
claimed that orbital uctuations may be strong in the Mott-Hubbard insulators
RVO
3. For YVO
3the observation of a one-dimensional orbital liquid, of an orbital
Peierls phase, and of bi-orbitons has been reported [8, 10, 1418]. On the other
hand, other groups rule out strong orbital uctuations in YVO
3due to a sizable
crystal-eld splitting [19,20] but support the importance of orbital uctuations for
compounds with larger R ions such as LaVO
3. Here, it is aimed to approach the
determination of low-energy orbital uctuations by means of optical spectroscopy.
The observed absorption bands can be described in terms of the dierent 3d
3mul- tiplets which form the upper Hubbard band. A comparison of the experimental results for R = Y, Gd, and Ce with a theory based on a low-energy spin-orbital superexchange Hamiltonian [8,10] should lead to a conclusion about the character of the orbital degree of freedom. Optical data of undoped RVO
3(R = Y, La) are well present in the literature [2123]. However, dierent data sets strikingly disagree with each other, calling for a clarication.
Further optical investigations focus on the compound LaSrFeO
4. The correlated insulator LaSrFeO
4is of interest because it lies on the border between Mott- Hubbard and charge-transfer systems. The layered structure of LaSrFeO
4is ex- pected to give rise to a pronounced anisotropy of the optical spectra, which can be used to disentangle Mott-Hubbard and charge-transfer absorption bands and thereby shed light on the character of LaSrFeO
4.
LaSrFeO
4exhibits a high-spin 3d
5electron conguration on the Fe
3+sites with a Néel temperature of T
N= 366 K. As a consequence, spin-spin and orbital-orbital correlations between nearest neighbors do not vary strongly below room temper- ature. Thus, the temperature dependence of the Mott-Hubbard excitations is expected to be rather small, which makes LaSrFeO
4an interesting candidate for the investigation of other eects on the temperature dependence of the spectral weight, such as the thermal expansion of the lattice, bandstructure eects, or ex- citonic contributions.
Yet another concern of this thesis lies on the physics of cobaltates. The focus is on the pseudocubic perovskites LaCoO
3and EuCoO
3with electron congu- ration 3d
6on the Co
3+sites, and the single-layered perovskites La
2−xSr
xCoO
4( x = 0, 0.33, 0.45, 0.5, 0.9 ) and La
1.5Ca
0.5CoO
4, which contain both, Co
3+ions with 3d
6electron conguration and Co
2+ions with 3d
7electron conguration. The physics of cobaltates is dominated by the spin-state issue. Particularly the spin state of the 3d
6electron conguration of the Co
3+ions can act as an additional degree of freedom, which is expected to control electronic and magnetic properties.
A 3d
6electron conguration in an octahedral surrounding is particular interesting as a competition arises between the crystal-eld splitting and the Hund exchange.
While the domination of the former gives rise to a nonmagnetic low-spin state (spin S = 0 ), the latter favors parallel spins, i.e. a magnetic high-spin state with spin S = 2 . Also the compromise in form of an intermediate-spin state with spin S = 1 has been discussed to become energetically favorable due to band-structure eects or large distortions of the oxygen octahedra [24,25].
The magnetic susceptibility of the pseudocubic perovskite LaCoO
3exhibits quite
unusual behavior which has been attributed to a thermal population of higher spin
states from a low-spin ground state starting at T & 25 K [25, 26]. The cobaltates
can be characterized as charge-transfer insulators. A change of the spin state of the Co
3+ions is supposed to greatly aect the reachable nal states of the charge-transfer excitations. However, temperature-dependent reectivity data on LaCoO
3hardly vary across the so-called spin-state transition [27]. In EuCoO
3the spin-state transition is shifted to much higher temperatures. The literature on single-layered cobaltates gives evidence for both, temperature and a doping in- duced spin-state transitions taking place on the Co
3+sites [2832]. The elaborate ellipsometric analysis presented in this work focuses on three dierent aspects, the temperature, polarization, and doping dependence of the optical spectra. It is the aim of this investigation to study the impact of the Co
3+spin-state on the optical spectra and to gain further insight into the physics of this interesting class of materials.
The structure of this thesis is as follows: In chapter 2 the physics of correlated
electron systems is briey discussed. A short introduction into the eld of optical
spectroscopy is given in chapter 3. The second part of chapter 3 is exclusively
devoted to ellipsometry. A description of the experimental setup and a discussion
of the analysis of the ellipsometric data follows in chapter 4. The results of the
detailed optical investigations on RVO
3are presented in chapter 5. Chapter 6
discusses the optical data of LaSrFeO
4. Finally, chapter 7 deals with the results
of the elaborate optical study on pseudocubic and single-layered cobaltates. The
thesis ends with a conclusion in chapter 8.
2 Electronic structure of
correlated electron systems
2.1 The Hubbard model
In a correlated electron system the Coulomb repulsion between individual electrons of the valence band plays a signicant role. As a consequence, the electronic properties of these systems cannot be described by band theory. Band theory makes use of an independent electron approximation, i.e. an electron moves in a mean potential of all other electrons. It is very successful in classifying a great number of crystalline solids as metals or insulators. However it fails e.g. in the description of transition-metal compounds with partially lled d shells, which are classied as metals by band theory, but some of them show insulating behavior in experiments [33]. A model which includes correlation eects between electrons that go beyond band theory is the so-called Hubbard model. The single-band Hubbard model represents its most simple form [5,6]:
H = H
t+ H
int= −t X
hi,ji σ
(c
†iσc
jσ+ h.c.) + U X
i
n
i↑n
i↓(2.1) Here, n
i↑(↓)is the occupation number operator, it counts the electrons with spin
↑ ( ↓ ) at lattice site i , c
†iσ( c
iσ) creates (annihilates) an electron with spin σ = ↑, ↓ at lattice site i and the sum over hi, ji is carried out over nearest neighbors. The rst term of Eq. 2.1 is the ordinary band term which describes the behavior of electrons in a periodic potential. The electrons gain kinetic energy by hopping from lattice site i to the neighboring lattice site j . The strength of the hopping amplitude t is given by the overlap between neighboring orbitals. The second term of Eq. 2.1 stems from the on-site Coulomb repulsion between two electrons, double occupancy has to be paid for by the Coulomb energy U . At half lling, i.e.
one electron per lattice site, the electronic properties of the system are governed by the ratio U/t . On the one hand, the movement of an electron results in an energy gain t , but on the other hand, it generates double occupancy costing the energy U . While the system is a Mott-Hubbard insulator with one electron per lattice site in the limit U/t 1 (strong coupling limit) where double occupancy is prevented by the large energy cost U , the system has metallic properties for U/t 1 . The variation of U/t thus leads to a metal-insulator transition [33,34].
5
The insulating behavior can be visualized by a splitting of the valence band [33], as sketched in Fig. 2.1. It has to be noted, however, that the resulting "bands"
cannot be understood in a single-electron picture, but are a result of the inter- actions among electrons. Instead of the density of states in a single-electron pic- ture, one sketches the ( N − 1 )-particle states (i.e. the spectrum of photoemission spectroscopy) as well as the ( N + 1 )-particle states (i.e. the spectrum of inverse photoemission spectroscopy). The valence band is split into the band with ( N −1 ) particles, the so-called lower Hubbard band (LHB) and the band with ( N + 1 ) particles, the so-called upper Hubbard band (UHB). The bands are separated from each other by the Coulomb energy U . As hole and double occupancy can move freely, the bands have a nite band width W , which is determined by the hopping amplitude t and the number of nearest neighbors z . In a crystal with cubic sym- metry it is given by W = 2zt [33]. LHB and UHB are far away from each other in the limit U/t 1 representing insulating behavior, whereas the overlap of LHB and UHB in the other limit U/t 1 characterizes a metallic system.
In Eq. 2.1 hopping only takes place between nearest neighbors, also the model only accounts for a Coulomb interaction between electrons on the same lattice site. Furthermore, the single-band Hubbard model is restricted to one orbital per lattice site and does not allow for dierent (degenerate) orbitals on each site.
However, depending on the physical system under investigation, the model can be expanded by the relevant terms (see Sec. 2.3 below).
Intensity
Energy
Figure 2.1: The valence band is split into the lower Hubbard band (LHB) and the
upper Hubbard band (UHB). See the main text for details.
2.2 On-site properties
2.2.1 Crystal structure and crystal-eld splitting
The discussion of the on-site electronic properties is of great importance for the un- derstanding of our optical spectra. The transition-metal compounds investigated within the framework of this study crystallize either in a (distorted) perovskite- type crystal structure or in a (distorted) single-layered perovskite-type structure.
The (pseudo-) cubic perovskites have the chemical formula ABX
3, for the com- pounds investigated within this these, A refers to a rare-earth ion or Y, B repre- sents a transition-metal ion, and X is an oxygen ion. The chemical formula of the single-layered perovskites is A
2BX
4. The unit cell of both structures is depicted in Fig. 2.2. Most of the crystals examined within the framework of this study show a distortion away from the ideal cubic or tetragonal crystal structure. Compared to the ideal perovskite the BX
6octahedra are rotated, tilted, and distorted. The distortions away from the cubic/tetragonal arrangement are mainly due to a mis- match of ionic sizes, so-called steric eects. The crystal symmetry is often reduced to orthorhombic. The lattice constants of the orthorhombic unit cell characteriz- ing the pseudocubic perovskite are related to the ones of the ideal cubic structure (with lattice constant a
c) by a ≈ b ≈ √
2a
cand c ≈ 2a
c. Figure 2.3 shows the orthorhombic unit cell of the distorted structure. In the case of the tetragonal symmetry of the single-layered structure, the BX
6octahedra (being neither tilted nor rotated) are elongated along the c axis. The lattice constants of the distorted layered structure are related to the ones of an ideal layered perovskite (with lattice constants a
tetand c
tet) by a ≈ b ≈ √
2a
tetand c ≈ c
tet.
The relevant physics takes place in the 3d shell of the transition-metal (TM) ions which are surrounded by the oxygen octahedra. Both, the rare-earth ions (or Y) and the oxygen ions have closed shells in a purely ionic scenario. Since the compounds of interest can be characterized as correlated insulators, the electrons are mostly localized on their lattice sites. The compound YVO
3, for instance, is composed of the ions Y
3+= [Kr] 4d
0, V
3+= [Ar] 3d
2, and O
2−= [He] 2s
22p
6and e.g. LaSrFeO
4consists of La
3+= [Xe] 5d
0, Sr
2+= [Kr] 5s
0, Fe
3+= [Ar] 3d
5, and O
2−= [He] 2s
22p
6.
The local properties of the TM ion are derived by the use of the so-called crystal-
eld theory [33, 35, 36]. It considers a scenario in which the TM ion is placed in
the potential of point-like charges of the surrounding ligands. The electric eld
lifts the degeneracy of the 3d level. A cubic crystal eld splits the ve 3d orbitals
into a lower-lying, triply degenerate t
2glevel (the d
xy, d
yz, and d
zxorbitals) and
a higher-lying, doubly degenerate e
glevel (the d
x2−y2and d
3z−r2orbitals), the
resulting orbitals are sketched in Fig. 2.4. The energetic separation is commonly
denoted by 10 Dq . Typical values of 10 Dq in TM compounds amount to 1 − 5
eV [9, 12, 3739]. The e
gorbitals lie higher in energy because their lobes point
directly onto the negatively charged oxygen ions, whereas the lobes of the t
2gor- bitals avoid them (see Fig. 2.4) [35]. The degeneracy of the t
2gand e
glevels is further lifted by a distortion of the BX
6octahedra. In addition to steric eects, also the Jahn-Teller eect is an important driving force for lifting the degeneracy.
It is active if the number of electrons cannot be uniformly distributed over the degenerate orbitals [40]. Up to a certain limit, the energy that can be gained by lowering the energy of the occupied orbitals with respect to the unoccupied ones outweighs the energy cost for distorting the octahedra. Also the spin-orbit coupling leads to a level splitting. However, its eect is comparably small in the compounds of interest for this work and can mostly be neglected.
Crystal-eld theory is not always sucient for the description of the compounds of interest relevant for this work as it does not account for hybridization. The hy- bridization of the TM ions with the surrounding oxygen ions might, however, play an important role for the understanding of our optical spectra. A theory that goes beyond crystal-eld theory is the so-called molecular-orbital theory. Molecular- orbital theory is able to describe the phenomena of chemical bonding. Molecular orbital wave functions are constructed out of linear combinations of the atomic orbital wave functions [41].
2.2.2 Multiplets
In the case that more than one electron resides in the 3d shell, the on-site properties are determined by many-electron wave functions. In the following discussion we assume cubic symmetry, eects resulting from deviations thereof will be discussed in the relevant chapters. Here, we will follow the argumentation of Ref. [35].
The many-electron wave functions in the cubic case are constructed out of the single-electron functions t
2gand e
g. Let us consider the simple case of placing two electrons into the t
2gshell. There are 6 possibilities for placing the rst electron in the shell (as one can choose between three t
2gorbitals and spin up or down) and 5 possibilities for the second electron (respecting the Pauli principle). One obtains 15 states (as the product of 6 × 5 has to be divided by 2 to avoid double counting), which have the same energy if the Coulomb interaction between the electrons is neglected. The many-electron wave function is, however, not simply a product of the single-electron functions as the antisymmetry of the fermionic wave function has to be taken into account. This is ensured by making use of Slater determinants.
The Coulomb interaction between the electrons leads to a splitting of the energy
levels of the many-electron states. The eigenstates corresponding to a certain
energy level are the basis of an irreducible representation Γ of the octahedral
symmetry group. Since there is no spin operator in the crystal-eld Hamiltonian,
the eigenstates have a denite spin quantum number S . The dierent energy levels
are called d
nmultiplets and are denoted by
2S+1Γ . They have (2S + 1) × (Γ) fold
degeneracy, where (Γ) denotes the dimension of the irreducible representation Γ .
Figure 2.2: Left: Crystal structure of the ideal cubic perovskite with chemical formula AB X
3(cubic, space group Pm 3m), Right: Crystal structure of the ideal single-layered perovskite with chemical formula A
2BX
4(tetragonal, space group I4/mmm), the BX
6octahedra are elongated along the c axis. Taken from Ref. [42].
The eigenenergy value of each multiplet depends on the spin conguration and the orbital occupation. It is described by the three Racah parameters A , B , and C , which describe the Coulomb interaction between two electrons on the same ion
1, and the crystal-eld parameter 10 Dq , describing the t
2g− e
gsplitting [35].
In the Sugano-Tanabe-Kamimura diagrams the multiplet energies are plotted as a function of Dq/B . It is possible to reduce the number of parameters since the energy splitting between the multiplet states is independent of the Racah parameter A ( A determines the absolute energy value only). Furthermore the ratio C/B is nearly independent of the number of electrons in the d shell as well as of the atomic number and deviates only slightly from the free-ion value (which is mostly known from spectroscopic data) [35,44]. We will make use of the Sugano- Tanabe-Kamimura diagrams for the peak assignment of our spectroscopic data (see the relevant chapters). The approximate values of Dq/B are mostly known
1
The Racah parameters
A,
B, and
Cfollow from the Slater integrals
F0,
F2, and
F4by
A = F0 − 49/441 F4,
B = 1/49F2 − 5/441 F4,
C = 35/441 F4with
Fk = R∞0 r12dr1R∞
0 r22dr2R2d(r1)R2d(r2)rk</rk+1>
, where
Rddenotes the radial wave function and
r<and
r>are the minimum and maximum values of
r1and
r2, respectively [35].
A B X
Figure 2.3: Crystal structure of the distorted perovskite (orthorhombic, space group Pbnm ). The orthorhombic (red) and the cubic (blue) unit cell are displayed. Taken from Ref. [37].
Figure 2.4: The cubic crystal eld of the surrounding oxygen (O
2−) octahedron
splits the d level of the transition-metal ion into a lower-lying triply
degenerate t
2glevel ( d
xy, d
yz, and d
zx) and a higher-lying doubly dege-
nerate e
glevel ( d
x2−y2and d
3z2−r2). The value of the splitting amounts
to 10 Dq . Taken from Ref. [43].
from the literature. The crystal-eld parameter 10 Dq depends mainly on the size of the TM − O octahedra. For a detailed discussion of crystal-eld theory we refer e.g. to Refs. [35,36].
2.3 The multi-orbital Hubbard model
The orbital degree of freedom is of great importance for the systems under investi- gation in this work with partially lled 3d shells. A multi-orbital Hubbard model has to be considered which allows for dierent (possibly degenerate) orbitals per lattice site. The system Hamiltonian in this case is given by [45]:
H = H
t+ H
int(2.2)
with
H
t= X
hi, ji, α, β, σ
t
αβ(c
†iασc
jβσ+ h.c.) (2.3) and
H
int= X
i, α, β, σ, σ0
(1 − δ
αβδ
σσ0)U
αβn
iασn
iβσ0− X
i, α, β
J
HαβS ~
iα· S ~
iβ(1 − δ
αβ) (2.4) Here, the hopping amplitude t
αβdepends on the type of the involved orbitals, it is zero if there is no overlap between the orbitals α and β [45]. In the TM compounds considered in this work the intersite hopping takes place via σ or π bonds of the ligand oxygen orbitals. Also the on-site Coulomb repulsion U
αβvaries depending on the pair of orbitals considered. The last term in H
intstems from the on-site Hund exchange interaction, stating that parallel spin alignment is preferred to antiparallel alignment for electrons in dierent orbitals. The values of U
αβand J
Hαβare determined by the Racah parameters A , B , and C , which have been introduced in the previous section.
2.4 Superexchange
The ground state of the single-band Hubbard model in the atomic limit (hopping
amplitude t = 0 ) has 2
Nfold degeneracy in the case of half lling ( N = number
of lattice sites). Electrons on dierent lattice sites do not interact and each spin
can be either up or down. For a small value of t the hopping term H
tof the
Hamiltonian in Eq. 2.1 can be treated as a weak perturbation of the Hubbard
interaction H
int[34]. In the strong coupling limit U/t 1 double occupancy
is suppressed for low energies and further considerations can be restricted to the
subspace of singly occupied lattice sites. Making use of a canonical transformation
and considering perturbation terms up to second order, one obtains the low-energy superexchange Hamiltonian [34]:
H
ef f= J X
hi,ji
S ~
i· S ~
j(2.5)
This is the Hamiltonian of the well-known Heisenberg model with superexchange constant J ∝ t
2/U . For positive values of J the coupling is antiferromagnetic (AFM). In the case of 180
◦bonds, the ground state of the single-band Hubbard model at half lling has thus AFM spin order. Antiparallel spins gain kinetic en- ergy by virtual hopping processes to neighboring sites, whereas hopping is blocked in the ferromagnetic (FM) case by the Pauli principle. These virtual charge ex- citations that cause an interaction between electrons on neighboring lattice sites are called superexchange interactions [46].
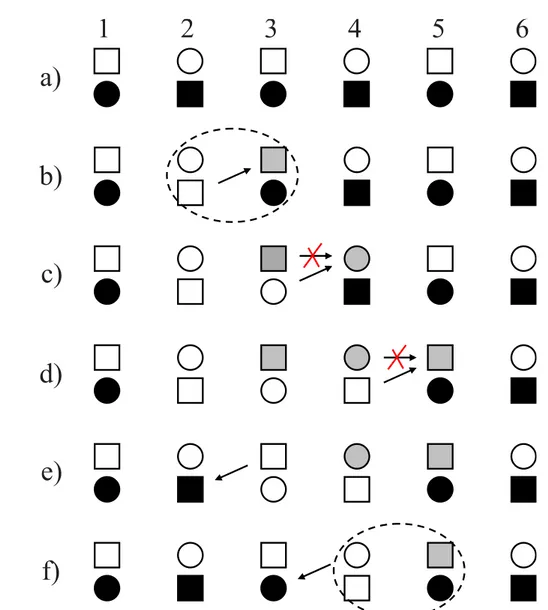
In the more complex case of the TM compounds with partially lled 3d shells dierent terms contribute to the superexchange interactions between neighboring lattice sites. These dierent contributions result from the multiplet structure of the virtually excited states and not only the spin degree of freedom but also the orbital degree of freedom plays an important role. Figure 2.5 exemplies on a simple model of a system with one electron and two orbitals per lattice site how FM and AFM correlations can emerge.
Kugel and Khomskii were the rst to derive low-energy eective superexchange Hamiltonians for compounds with partially lled degenerate orbitals [47]. These so-called spin-orbital models tread coupled spin and orbital degrees of freedom.
They allow for both, FM and AFM spin correlations. They are successful in ex- plaining the splitting of degenerate orbitals due to superexchange and describe orbital ordering phenomena. In addition to the actual orbital state, these com- plex spin-orbital models are controlled by only a small number of physical param- eters, the superexchange constant J ∝ t
2/U and the normalized Hund exchange J
H/U [8]
2. It has to be noted, however, that as opposed to the spin part, where interaction between neighboring lattice sites are exclusively mediated by superex- change, the orbital occupation of neighboring lattice sites can additionally be a aected by orbital-lattice coupling (i.e. steric eects or the cooperative Jahn-Teller eect, see Sec. 2.5 below). In the case of orbital degeneracy, the superexchange interactions are composed of virtual charge excitations to the various multiplet states forming the UHB. The eective low-energy Hamiltonian, which connects the lattice sites i and j , can thus be written as a superposition of each individual
2
Here,
Uis the on-site intra-orbital Coulomb interaction energy,
JHis Hund exchange element
which depends on the involved orbitals and
tis the eective hopping element between the
relevant orbitals of the system under consideration.
contribution to the superexchange [8]:
H
ef f= X
n
X
hi,ji||γ
H
nγ(ij ) (2.6)
The individual charge excitations which contribute to superexchange are labeled by n . Since the orbital operators depend on the bond direction, the index γ = a, b, c has been introduced to specify the dierent crystallographic directions [8].
We will see in Sec. 2.6 that the eective low-energy Hamiltonian of Eq. 2.6 also determines the intensity of the high-energy optical transitions across the band gap. The intersite transitions that are seen in optics are thus intimately related to the low-energy superexchange interactions [8,10]. In chapter 5 we will make use of this interrelation to understand the temperature dependence of the complex multi- peak structure observed in the optical spectra of the compounds RVO
3(with R
= rare-earth ion or Y).
Figure 2.5:
Simple model of a system with one elec- tron and two orbitals (a and b) per lat- tice site. The correlations can be FM due to the Hund coupling or AFM due to the Pauli principle.
2.5 Orbital correlations due to orbital-lattice coupling
In addition to the superexchange which mediates an interaction between spins and orbitals on neighboring lattice sites, also the coupling of the orbitals to the lattice has to be taken into account as a potential source for orbital ordering [48,49]. In Sec. 2.2.1 we have already discussed steric eects and the Jahn-Teller eect as possible causes for the level splitting on one particular TM site. The interrelation between the individual oxygen octahedra in a crystal lattice can induce a collective lattice distortion (see Fig. 2.6), the so-called collective Jahn-Teller eect.
The collective Jahn-Teller eect and the superexchange interactions do not nec-
essarily support the same kind of orbital ordering pattern. The competition be-
tween dierent mechanisms for orbital ordering can be the source of a rich spin
Figure 2.6:
Simple sketch of a collectively distorted crystal structure, the so-called collective Jahn-Teller eect.
and orbital ordering phase diagram. In systems with active e
gorbitals the cou- pling to the lattice typically plays an important role. In the e
gsystem LaMnO
3with 3d
4electron conguration for instance, the collective Jahn-Teller eect in- duces an orbital ordering phase transition taking place at a temperature as high as T
OO= 780 K [11], therefore the superexchange between orbitals can be ne- glected [8, 49]. In the t
2gsystem YVO
3with 3d
2electron conguration, however, the competition between steric eects, the Jahn-Teller eect, and superexchange interactions is recognized to be the origin of a complex spin and orbital ordering phase diagram [14,48,49] (which will be presented in Sec. 5).
2.6 Mott-Hubbard excitations and their temperature dependence
The absorption spectra of TM compounds in the energy region relevant for this
work, ranging from the near infrared to the middle ultraviolet region (0.75 eV −
5.5 eV), are dominated by two types of electronic excitations: the Mott-Hubbard
(MH) excitations and the charge-transfer (CT) excitations. In this section we
address the former whereas the latter are discussed in the next section. A MH
excitation corresponds to an electron transfer between neighboring TM ions, |d
1id
1ji → |d
2id
0ji (considering the simplied case of one electron per lattice site rst),
where d
nrefers to the d shell of a TM ion that is occupied by n electrons. The dou-
ble occupancy of lattice site i costs the Coulomb-interaction energy U . The MH
excitations are the real counterparts of the virtual charge excitations discussed
in Sec. 2.4 in the context of superexchange. Their optical spectral weight is inti-
mately connected to the low-energy superexchange interactions. Let us consider
the simplied case of a 1D single-band Hubbard chain at half lling in the strong
coupling limit ( U/t 1 ), see Fig. 2.7. We only consider electric dipole transi-
tions since the intensities of magnetic dipole and electric quadrupole transitions
are smaller by a factor of 10
−5− 10
−6[50, 51]. According to the spin selection
rule, the total spins of the initial and the nal state have to be equal, i.e. S
iz= S
fz(assuming that the orbital moment is quenched or the spin-orbit coupling is small,
as appropriate for the systems of interest for this work). In the case of AFM spin
order, the excited state resulting from a MH excitation corresponds to a double occupancy of lattice site i with electrons of opposite spin (see Fig. 2.7 (a)). In contrast, the electron transfer is blocked for FM spin order by the Pauli principle (see Fig. 2.7 (b)). This simple model greatly demonstrates that the optical spec- tral weight of a MH excitation depends sensitively on nearest-neighbor spin-spin correlations.
(a) (b)
Figure 2.7:
Depending on the orientation of neigh- boring spins, the MH excitation is either allowed ((a) AFM spin order) or forbid- den ((b) FM spin order).
A more dicult situation comes up in the case of partially lled degene- rate orbitals. The MH excitations have the general form: |d
nid
nji → |d
n+1id
n−1ji . The complex multiplet struc- ture of the excited state is reected in a complex multi-peak structure of the optical spectra [8,9]. In addition to the spin selection rule also the orbital selec- tion rule has to be taken into account, which is determined by the overlap be- tween orbitals on neighboring lattice sites. In a cubic perovskite with 180
◦bonds, t
2gand e
gorbitals do not over- lap, there is only overlap between t
2gorbitals of the same type, whereas all e
gorbitals have overlap with each other. Consequently, the optical spectral weight of a MH excitation into a certain |d
n+1id
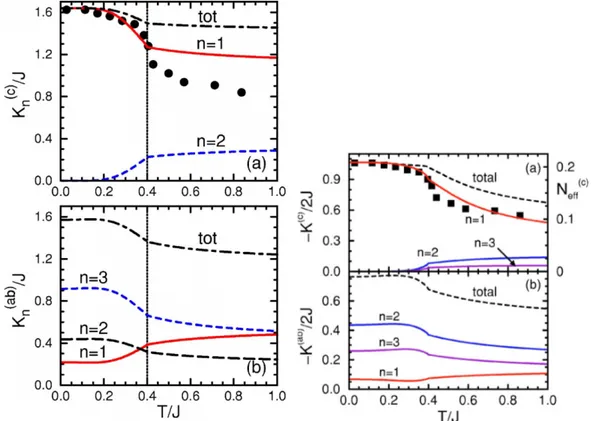
n−1ji multiplet is determined by the orbital occupation of neighboring lattice sites. A change of the nearest-neighbor spin-spin or orbital-orbital correlation function with temperature leads to a spectral weight transfer between the individual components of the optical multiplets [10]. The op- tical intensity of a MH excitation into a certain multiplet state labeled by n along the cubic axis γ is related to the respective contribution to the superexchange Hamiltonian of Eq. 2.6 via the optical sum rule [8,10]:
Z
∞ 0σ
n(γ)(ω)dω ∝
H
n(γ)(ij )
(2.7)
Here, σ
n(γ)(ω) denotes the contribution to the real part of the optical conductivity
σ
1(ω) stemming from the excitation into the multiplet state n along γ . One
great example for this correlation is given by ellipsometric data on the 3d
4system
LaMnO
3(with t
32ge
1g, S = 2 electron conguration) [11]. As discussed above, the
coupling of the e
gorbitals to the lattice is strong and orbital ordering sets in
at T
OO= 780 K in LaMnO
3, far above the spin ordering temperature of T
N=
150 K. Consequently, only the spin degree of freedom has to be considered at
lower temperatures. The spin ordering below T
Nis of A type, i.e. parallel spins in
the ab plane and antiparallel spins along the c axis, see the inset of Fig. 2.8, left
panel. The low-energy band at approx. 2 eV − 2.5 eV in the optical spectra (see Fig. 2.8, left panel) has been assigned to the MH excitation |3d
4i3d
4ji → |3d
5i3d
3ji into the 3d
5high-spin ( S = 5/2 ) state. Due to the high-spin character, parallel spins on adjacent sites in the initial state are expected to give rise to a larger spectral weight than antiparallel spins. As a consequence, an increase of spectral weight is expected in the ab direction when lowering the temperature across T
N, whereas a reduction of spectral weight is expected along c . This is in striking agreement with the observations (see Fig. 2.8) and greatly demonstrates that the peak assignment is correct. In the opposite sense, optical spectroscopy can be applied as an eective tool for the investigation of nearest-neighbor spin-spin and/or orbital-orbital correlations in TM compounds. We will use this concept for the analysis of our spectra of the 3d
2compounds RVO
3(R=Y, Gd, Ce) (see Sec. 5). In contrary to the e
gsystem LaMnO
3the coupling to the lattice is rather weak for these compounds with active t
2gorbitals and coupled spin-orbital degrees of freedom have to be considered.
2.7 Mott-Hubbard and charge-transfer insulators
A second type of intersite transition that is of importance for the understanding of our ellipsometric data is the CT excitation. It corresponds to an electron transfer from the ligand oxygen 2p band to the TM 3d band (UHB): |p
6d
ni → |p
5d
n+1i . The energy separation between the two bands is given by the CT energy
∆ . Depending on the relative size of U
ef fand ∆
ef f, the lowest intersite transition corresponds to a MH or a CT excitation
3. Accordingly, the TM compounds are classied into so-called MH ( U
ef f< ∆
ef f) and CT ( ∆
ef f< U
ef f) insulators within the Zaanen-Sawatzky-Allen scheme [52], see Fig. 2.9. Early transition- metal compounds (e.g. TM = Ti, V) are typically classied into the group of MH insulators, whereas late ones (e.g. TM = Ni, Cu) are identied as being of CT type [5357]. With increasing atomic number U increases whereas ∆ decreases [53, 57], which reects the decreasing spatial extension of the 3d orbitals and the increasing electronegativity of the TM ions, respectively. Both intersite transitions are sketched in Fig. 2.10. In TM oxides, typical values for the real part of the optical conductivity σ
1(ω) are of a few 1000 ( Ω cm)
−1for CT excitations, whereas for MH excitations the value of σ
1(ω) typically amounts to only a few 100 ( Ω cm)
−1[1, 12, 23, 57, 58]. The dierence is due to the fact that CT excitations are a rst and MH excitations a second order process since the d
i− d
jelectron transfer that corresponds to a MH excitation takes place via the ligand O 2p orbital. This results in σ
1(ω) ∝ t
2pd/∆ for CT and σ
1(ω) ∝ t
4pd/∆
2for MH excitations, where
3
Here, the eective charge-transfer energy
∆ef fand the eective Coulomb-interaction energy
Uef frefer to the lowest excitation energies of the CT excitations and the MH excitations in
a multi-orbital system, respectively.
t
pdis the TM − O hopping amplitude. A further important dierence between MH and CT excitations is the fact that CT excitations are expected to be independent of magnetic properties [59]. As the O 2p band is completely lled the oxygen can provide both, up and down spin, and a CT excitation is not blocked by a certain spin alignment on the TM ion (see Fig. 2.10). Consequently, as opposed to the MH excitations, one expects no changes of the spectral weight of a CT excitation across magnetic ordering temperatures. However, due to hybridization an excitation is never of pure MH or CT type in a realistic picture. Therefore the above mentioned is only true in a rst approximation.
Figure 2.8: Left panel: The dielectric function ε of LaMnO
3corresponding to E k b (a) and E k c (b) for dierent temperatures as obtained by Kovaleva et al. [11] by the use of ellipsometry. Here the focus lies on the temperature dependence of the low-energy absorption band at
≈ 2 eV − 2.5 eV (marked in red). The inset sketches the spin and or-
bital ordering pattern. Right panel: Spectral weight of the low-energy
absorption band for E k b and E k c in terms of the eective carrier
concentration N
ef fwhich results from a Lorentz t to the measured
data. The dashed lines refer to the result of theoretical calculations
based on a superexchange model for the low-temperature ordered and
the asymptotic high-temperature disordered phase. Both gures are
taken from Ref. [11].
Figure 2.9: Sketch of the photoemission (PES) and inverse photoemission spec- tra (IPES) of (a) a Mott-Hubbard insulator and (b) a charge-transfer insulator. Full symbols represent fully occupied bands, whereas open symbols represent unoccupied bands.
3d 2p 3d 3d 2p 3d
(a) Mott-Hubbard excitation (b) Charge-transfer excitation
Figure 2.10: Sketch of (a) a Mott-Hubbard excitation and (b) a charge-transfer
excitation. While the Mott-Hubbard excitations depend on the spin-
spin correlations the charge-transfer excitations are independent of
the spin alignment.
3 Optical Spectroscopy
Optical spectroscopy is a very popular technique in solid state physics that is used to investigate the band structure of solids. Furthermore, a variety of excita- tions, e.g. phonons, magnons, or interband excitations can be detected. Within the framework of this thesis the optical technique ellipsometry is applied, which makes use of the polarization properties of electromagnetic waves.
The chapter on hand is organized as follows. The rst section introduces the op- tical constants, i.e. the quantities of interest in optical spectroscopy. To embed their meaning in a general context, a short introduction into linear response theory is given. The dierent formulations of the optical constants are presented and the Kramers-Kronig relation is introduced. The reection properties of electromag- netic waves are briey discussed and model functions for the optical constants are presented, which are needed for the analysis of the measured data. The second section of this chapter deals exclusively with ellipsometry.
3.1 Linear response functions and optical constants
3.1.1 Linear response theory
Every spectroscopic experiment is based on the principle of response theory. One probes the response of a physical system to the application of an external pertur- bation. Optical spectroscopy makes use of the interaction properties of electro- magnetic waves with matter. The perturbation of a system by an electromagnetic wave leads to a response that is characteristic for its physical properties. Thus, for an external perturbation, the record of the response yields information about the properties of the physical system under consideration. The response X(~ r, t) of the system is linked to the external perturbation S(~ r, t) by the response function R(~ r, t) . While S(~ r, t) is an externally controllable quantity, the response func- tion R(~ r, t) is an intrinsic characteristic of the physical system [34]. The relation between perturbation and response is in general very complicated. However, a linear approximation can be applied if the perturbation operator yields only a small contribution to the Hamiltonian and can be treated in rst order. In this case the functional relation between response and external perturbation has the
19
form [34]:
X(~ r, t) = Z
R(~ r, ~ r
0, t, t
0)S(~ r
0, t
0)d(~ r
0, t
0) (3.1) Due to the law of causality the perturbation cannot cause an eect before actually acting, the response function is thus a retarded function, i.e. R(~ r, ~ r
0, t, t
0) = 0 for t < t
0.
For optical frequencies, an external perturbation in form of an electric eld gives rise to phenomena like dispersion, refraction, absorption, and reection, whereas the interaction of a magnetic eld with matter can mostly be neglected.
Many systems fulll the following conditions:
The Hamiltonian of the system does not explicitly depend on time. In this case the response function depends only on the dierence between the time coordinates, R(~ r, ~ r
0, t, t
0) = R(~ r, ~ r
0, t − t
0) [34].
The crystal is translationally invariant with lattice constants much smaller than the optical wavelengths. In this case the response function depends only on the dierence of the coordinates of space, R(~ r, ~ r
0, t, t
0) = R(~ r − ~ r
0, t, t
0) [34].
If the above mentioned conditions are fullled, it is convenient to express Eq. 3.1 in frequency and momentum space. Temporal and spatial Fourier transformation leads to the relation:
X(~k, ω) = R(~k, ω) · S(~k, ω) (3.2) It follows from Eq. 3.2 that a monochromatic perturbation which acts at a fre- quency ω will produce a response of the same frequency. The same holds true for the momentum ~k . A peak of the function X(~k, ω) at a certain frequency ω and momentum ~k corresponds to a peak of the response function R(~ r, t) at the same frequency and momentum. It is thus in principle possible to extract the full dispersion relation of the excitations of the system by the use of a linear response measurement [34].
Due to the dispersion relation of light ( ω =
nc· |~k| ; c : velocity of light in vacuum;
n : refractive index, see below) the order of magnitude of the momentum |~k| is
much smaller than the order of magnitude of the reciprocal lattice vectors for
optical frequencies. Thus, one can assume |~k| ≈ 0 . As a consequence, optics does
only allow for excitations with momentum |~k| ≈ 0 . However, nite momenta are
possible if the photon of the electromagnetic wave interacts with more than just
one particle of the system, in this case only the sum of the individual momenta
has to be equal to zero.
3.1.2 The optical constants
The interaction of an electric eld E(ω) ~ with matter induces a complex polariza- tion P ~ (ω) . The response function which relates electric eld E ~ (ω) and polarization P ~ (ω) to each other is called electric susceptibility χ(ω) [60,61]:
P ~ (ω) = ε
0χ(ω) · E(ω) ~ (3.3) In general, χ(ω) = χ
1(ω) + iχ
2(ω) is a complex second-order tensor, which be- comes a complex scalar in the case of an isotropic medium. The permittivity of vacuum ε
0amounts to 8.8542 · 10
−12C
2N
−1m
−2[62].
The electric susceptibility χ(ω) is related to the real part of the optical conduc- tivity σ
1(ω) and the real part of the dielectric function ε
1(ω) by [60]
χ(ω) = χ
1(ω) + iχ
2(ω) = ε
1(ω) − 1 + i 1
ε
0ω σ
1(ω). (3.4) In the limit ω = 0 , σ
1(ω = 0) corresponds to the DC electrical conductivity σ
DCwhich is known from Ohm's law ( ~j = σ
DC· E ~ , where ~j denotes the current density).
Both quantities, σ
1(ω) and ε
1(ω) , are functions of the microscopic elements of the system. They describe the optical properties of the solid and depend on its possible excitations, e.g. lattice vibrations, free carrier absorption in a metal, excitations across the band gap in an insulator, excitonic excitations, orbital excitations, spin excitations, etc. [60].
Combining Eq. 3.3 and Eq. 3.4 leads to:
P ~ (ω) = ε
0χ
1(ω) E(ω) + ~ i 1
ω σ
1(ω) E(ω) ~ (3.5)
= Re h P ~ (ω)
i + i 1
ω ~j(ω) (3.6)
While the real part of the polarization Re h P ~ (ω) i
describes the electric dipole moment that is induced per unit volume, the imaginary part corresponds to an induced current density ~j(ω) which leads to a loss of energy, i.e. absorption.
The complex dielectric function (also called dielectric tensor in the anisotropic case)
ε(ω) = ε
1(ω) + iε
2(ω) = ε
1(ω) + i 1
ε
0ω σ
1(ω) = χ(ω) + 1, (3.7) the complex optical conductivity
σ(ω) = σ
1(ω) + iσ
2(ω) = σ
1(ω) + iε
0ω(1 − ε
1(ω)), (3.8)
and the complex electric susceptibility χ(ω) are dierent formulations of the so-
called optical constants. While ε(ω) and χ(ω) are dimensionless, the optical con-
ductivity σ(ω) has the unit [σ] = Ω
−1cm
−1. Only ε
1and σ
1are dened for ω = 0 .
The wave equation for the propagation of electromagnetic waves in a medium with dielectric function ε can be derived from Maxwell's equations [60]. It follows:
∇
2· E ~ = ε c
2∂
2E ~
∂t
2(3.9)
Harmonic plane waves represent solutions of the wave equation:
E(~ ~ r, t) = E ~
0e
i(~k~r−ωt)(3.10) with
~k
2= ω
2c
2· ε (3.11)
The complex index of refraction N , which is yet another representation of the optical constants, is dened as
N = n + ik = (ε
1+ iε
2)
12. (3.12) Inserting Eq. 3.12 into Eq. 3.10 leads to
E(~ ~ r, t) = E ~
0e
i(ωcn~nk~r−ωt)· e
−ωck~nk~r. (3.13) The refractive index n is linked to the phase speed in the material, while the imag- inary part of the complex index of refraction k is a measure of the loss of intensity caused by absorption when the electromagnetic wave is propagating through the material. Here, ~ n
kis the unit vector pointing into the direction of propagation.
Although the optical constants are represented by arbitrary second-order tensors in the general case, for a system with orthorhombic or higher symmetry they are represented by tensors with vanishing o-diagonal elements [63] (if the magneti- zation can be neglected):
ε
orthorhombic(ω) =
ε
a(ω) 0 0 0 ε
b(ω) 0 0 0 ε
c(ω)
(3.14)
In the case of orthorhombic crystal symmetry the tensor axes coincide with the crystallographic axes.
3.1.3 The Kramers-Kronig relation
The law of causality implies that real and imaginary part of the response function are related to each other. They obey a functional relationship that is called Kramers-Kronig relation. For the dielectric functions ε(ω) the relation has the form [61]:
ε
1(ω) − 1 = 2 π P
Z
∞ 0ω
0ε
2(ω
0)
ω
02− ω
2dω
0(3.15)
ε
2(ω) = − 2ω π P
Z
∞ 0ε
1(ω
0) − 1
ω
02− ω
2dω
0(3.16)
Here, P denotes the Cauchy principal value of the integral. This relationship gives additional information for the acquisition of the optical constants from ex- periments. The application of the relation requires the knowledge of the real or imaginary part of the response function for ω ranging from 0 to ∞ . However, a nite energy range in combination with a reasonable extrapolation is often su- cient in order to get a good result. The Kramers-Kronig relation allows for the determination of the optical constants from, e.g., reectivity measurements alone.
Otherwise, if the real and imaginary part of the optical constants are both de- duced from the experiment independently, the consistency can be checked with the help of the Kramers-Kronig relation. The latter applies to an ellipsometric measurement, as will be discussed in the second part of this chapter (Sec. 3.2).
3.1.4 Reection properties of electromagnetic waves
Ellipsometry is based on the reection of an electromagnetic wave from the surface of the sample under consideration. In the following, the relevant physics is briey introduced. The angle between the normal to the sample surface and the beam incident on, and reected from the sample are called the angle of incidence Φ
i, and the angle of reection Φ
r, respectively. The incoming beam of light and the normal to the sample surface constitute the plane of incidence. The electric eld vector of the transversal electromagnetic wave is decomposed into its components parallel ( E
p) and perpendicular ( E
s) to the plane of incidence. The following expressions are used for the incoming, reected, and transmitted wave:
E ~
i= E
piE
sie
i(~ki~r−ωit); E ~
r= E
prE
sre
i(~kr~r−ωrt); E ~
t= E
ptE
ste
i(~kt~r−ωtt)(3.17) The following important relations can be deduced from Maxwell's equations [64]:
ω
i= ω
r= ω
t ~k
i, ~k
r, and ~k
tlie in the plane of incidence.
angle of incidence Φ
i= angle of reection Φ
r= Φ .
The law of refraction (also called Snell's law) which is given by sin Φ
i= n sin Φ
tcan be derived in the simple case of an isotropic sample. Here, Φ
tdenotes
the angle between the normal to the sample surface and the transmitted
beam of light and n is the refractive index of the sample (which has been introduced in Eq. 3.12).
If we assume only linear changes of the initial eld amplitudes upon reection from the sample surface, incoming and reected electric eld vectors E ~
iand E ~
rare related by [63]
E
prE
sr=
r
ppr
spr
psr
ssE
piE
si. (3.18)
The complex quantities r
pp, r
ss, r
ps, r
spare functions of the dielectric tensor of the sample, the angle of incidence, and in the case of an anisotropic sam- ple of its orientation. They are given by the Fresnel formulas, which follow directly from Maxwell's equations.
Let us dene the ellipsometer coordinate system (x, y, z) according to Ref. [65]
(see Fig. 3.1). The x axis lies in the sample surface, aligned parallel to the plane of incidence. The y axis lies in the sample surface, aligned perpendicular to the plane of incidence. The z axis is normal to the sample surface and points into the sample, in agreement with a right-handed coordinate system.
The o-diagonal elements r
psand r
spof Eq. 3.18 vanish for isotropic media and for orthorhombic crystals that are oriented such that the crystallographic axes (a, b, c) are parallel to the ellipsometer coordinate system (x, y, z) . If the crystallographic axes (a, b, c) are parallel to (x, y, z) , respectively, r
ppand r
ssare given by [66]:
r
pp= E
prE
pi=
√ ε
aε
ccos Φ
i− p
ε
c− sin
2Φ
iq √
ε
aε
ccos Φ
i+ ε
c− sin
2Φ
i(3.19)
r
ss= E
srE
si= cos Φ
i− p
ε
b− sin
2Φ
icos Φ
i+ p
ε
b− sin
2Φ
i(3.20)
r
ps= r
sp= 0 (3.21)
If the symmetry is lower than orthorhombic, the o-diagonal elements can be nite for any orientation. Finite o-diagonal elements can also occur as a consequence of depolarizing eects. The ratios of r
pp, r
ss, r
ps, and r
sprepresent the measured variables of ellipsometry
1, Fig. 3.2 shows an exemplary plot of
rrppssas a function of the angle of incidence Φ
ifor dierent isotropic media at a xed energy.
1
They will be discussed in detail in Sec. 3.2.
x
z y Fi
sample surface
Fr
Figure 3.1: The ellipsometer coordinate system is dened by (x, y, z) .
0 . 0 0 . 2 0 . 4 0 . 6 0 . 8 1 . 0
0 2 0 4 0 6 0 8 0
0
5 0 1 0 0 1 5 0
0 2 0 4 0 6 0 8 0
n = 1 , 5 k = 0
| rpp / rss |
c r y s t a l l i n e s i l i c o n a m o r p h o u s s i l i c o n
n = 1 , 5 k = 0
∆pp -∆ss (degrees)
a n g l e o f i n c i d e n c e ( d e g r e e s )
c r y s t a l l i n e s i l i c o n a m o r p h o u s s i l i c o n
a n g l e o f i n c i d e n c e ( d e g r e e s )
Figure 3.2: The ratio of r
pp= |r
pp| e
i∆ppand r
ss= |r
ss| e
i∆ssas a function of the angle of incidence for a material with n = 1.5 and k = 0 (left) and for crystalline and amorphous silicon at E = 3 eV (right). The ratio of the amplitudes
rpp
rss
![Figure 5.6: Phonon spectrum of GdVO 3 in the energy range from 100 cm −1 to 650 cm −1 ( ≈ 0.01 eV − 0.08 eV) as obtained by Voigt [96]](https://thumb-eu.123doks.com/thumbv2/1library_info/3699490.1505943/73.892.171.715.209.924/figure-phonon-spectrum-gdvo-energy-range-obtained-voigt.webp)