A multidimensional omics analysis of the DNA damage response in
Caenorhabditis elegans
Inaugural-Dissertation
der Mathematisch-Naturwissenschaftlichen Fakult¨at der Universit¨at zu K¨oln
zur
Erlangung des Doktorgrades vorgelegt von
Diletta Edifizi
aus Padova, Italien
K¨oln, May 2017
A multidimensional omics analysis of the DNA damage response in
Caenorhabditis elegans
Inaugural-Dissertation
zur
Erlangung des Doktorgrades
der Mathematisch-Naturwissenschaftlichen Fakult¨at der Universit¨at zu K¨oln
vorgelegt von
Diletta Edifizi
aus Padova, Italien
K¨oln, May 2017
The work described in this dissertation was conducted from March 2013 to March 2017 under the supervision of Prof. Dr. Bj¨orn Schumacher at the Institute for Genetics, University of Cologne, Z¨ulpicher Straße 47a, D-50674, Cologne, Germany and CECAD Research Center, University of Cologne, Joseph-Stelzmann Straße 26, D-50931, Cologne, Germany.
Diese Arbeit wurde durchgef¨uhrt zwischen M¨arz 2013 und M¨arz 2017 unter der Anleitung von Prof. Dr. Bj¨orn Schumacher am Institut f¨ur Genetik der Universit¨at zu K¨oln, Z¨ulpicher Straße 47a, D-50674, K¨oln, Deutschland und am CECAD Forschungszentrum, Universit¨at zu K¨oln, Joseph-Stelzmann Straße 26, D-50931, K¨oln, Deutschland.
Parts of this work have been published:
Teile dieser Arbeit wurden bereits verffentlicht:
Diletta Edifizi and Bj¨orn Schumacher
Genome Instability in Development and Aging: Insights from Nucleotide Excision Repair in Humans, Mice, and Worms
Biomolecules 2015, 5, 1855-1869; — doi: 10.3390/biom5031855
Berichterstatter: Prof. Dr. Bj¨orn Schumacher Prof. Dr. Markus Kr¨uger
Pr¨ufungsvorsitzender: Prof. Dr. Siegfried Roth
Tag der m¨undlichen Pr¨ufung: 30 May 2017
There are no ideal conditions to write, study, work or think, but it is only
the will, the passion and the stubbornness to push a man to pursue
his own project.
K.Lorenz
Summary
DNA damage comprises a causal factor for ageing and ageing-associated diseases. Defects in genome maintenance pathways give rise to a variety of human congenital syndromes that are characterized by growth retardation, cancer susceptibility, and accelerated ageing. The spe- cific consequences of unrepaired DNA damage in human diseases are particularly apparent in syndromes caused by distinct nucleotide excision repair (NER) defects; however, with yet poorly understood genotype-phenotype correlations and highly complex disease phenotypes.
It is established that the equivalent mutations in the simple metazoan Caenorhabditis elegans
reflect the distinct outcomes of DNA repair defects and allow investigation of the consequences
of persistent DNA damage during animal development and ageing. Here, we conducted pro-
teome, lipidome, and phosphoproteome analysis of NER-deficient animals in response to UV-B
treatment to gain comprehensive insights into the full range of physiological adaptations to
unrepaired DNA damage. We derive metabolic changes indicative of a tissue maintenance pro-
gram and implicate an autophagy-mediated protoestatic response. We assign central roles for
the IIS regulator DAF-2, and the EGF- and AMPK-like signalling pathways in orchestrating
the adaptive response to DNA damage. Our results provide new insights into the DNA damage
responses in the organismal context.
Zusammenfassung
DNA-Sch¨aden z¨ahlen zu den grundlegenden Faktoren, die sowohl f¨ur das Entstehen von al- tersbedingten Krankheiten, als auch den Alterungsprozess selbst verantwortlich sind. Defekte in DNA-Schadensreparaturmechanismen verursachen zahlreiche kongenitale Syndrome im Men- schen, die durch Wachstumshemmungen, ein erh¨ohtes Krebsrisiko sowie einen beschleunigten Alterungsprozess charakterisiert sind.
Die spezifischen Konsequenzen nichtreparierter DNA-Sch¨aden, die w¨ahrend menschlicher Krankheiten auftreten k¨onnen, sind besonders bei verschiedenen durch Defekte in Nuk- leotidexzisionsreparaturmechanismen ausgel¨osten Syndromen, wobei deren genauen Genotyp- Ph¨anotyp-Korrelationen und hochkomplexen Krankheitsbilder noch immer unvollst¨andig definiert sind.
Aquivalente Mutationen im mehrzelligen Modellorganismus ¨ Caenorhabditis elegans resul- tieren in ¨ahnlichen DNA-Reparaturdefekten und erlauben daher eine eingehendere Unter- suchung der Konsequenzen von bleibenden DNA-Sch¨aden, die w¨ahrend der Entwicklung und des Alterungsprozesses des Tieres auftreten k¨onnen.
In der vorliegenden Arbeit wurden UV-bestrahlte W¨urmer mit defizit¨arer Nukleotidexzision- sreparatur einer Proteom-, Lipidom-, und Phosphoproteomanalyse unterzogen, um einen um- fassenden ¨ Uberblick ¨uber die Gesamtheit der physiologischen Adaptionen an das Vorhanden- sein fortbestehender DNA Sch¨aden zu erhalten.
Wir beobachten metabolische Ver¨anderungen, die auf ein spezifisches Gewebeinstandhal-
tungsprogramm hindeuten und eine Autophagie-vermittelte, proteostatische Antwort im-
plizieren. Wir bestimmen zentrale Rollen f¨ur den insulin¨ahnlichen Signalwegsregula-
tor DAF-2 und die EGF- und AMPK-hnlichen Signalwege in der Orchestrierung dieser
DNA-Schadensantwort. Die Ergebnisse dieser Arbeit bieten neue Einblicke in die DNA-
Schadensantworten im organismischen Kontext.
Abbreviations
◦ C degree Celsius
6-4PP 6-4 pyrimidine pyrimidone photoproduct
µ g microgram
µ l microliter
µ m micrometer
ACN acetonitrile
AD Alzheimers disease
AGC automatic gain control
AMPK AMP-activated protein kinases ATP adenosine triphosphate
BER base excision repair
BLAST basic local alignment search tool
Ca2+ calcium
CaCl 2 calcium chloride
cAMP cyclic AMP
C. elegans Caenorhabditis elegans
Cer ceramide
CDP-DAG cytidine diphosphatediacylglycerol
CeTOR Caenorhabditis elegans target of rapamycin CGC Caenorhabditis genetics center
CL cardiolipin
cm centimetre
CPD cyclobutane pyrimidine dimer
CREB cAMP- responsive element (CRE)-binding protein CRTC-1 cAMP-regulated transcriptional co-activator
CS Cockayne syndrome
CSA Cockayne syndrome complementation group A CSB Cockayne syndrome complementation group B CH 3 COOH acetic acid
CUL4A cullin 4A
CuSO 4 copper sulfate
DAG diacylglycerol
DAF-2 abnormal dauer formation 2 DAF-7 abnormal dauer formation 7 DAF-16/FOXO abnormal dauer formation 16 DDB DNA damage-binding protein
DDR DNA damage response
DEW Dewar valence isomers
DNA deoxyribonucleic acid DNA POL DNA polymerase
dNTP deoxynucleoside 5’-triphosphate
DSB double-strand break
DTT dithiothreitol E. coli Escherichia coli
EDTA ethylenediaminetetraacetic acid EGF epidermal growth factor
EP enriched peptone
ER endoplasmic reticulum
ERCC1 excision repair cross-complementation group 1
EWL entire worm lysate
FA fatty acid
FDR false discovery rate GFP green fluorescent protein
GG-NER global-genome nucleotide excision repair GlcCer glucosylceramide
GO gene ontology
GPCR G protein-coupled receptor GSEA gene set enrichment analysis GST glutathione S-transferases
h hours
H 2 O water
H 3 PO 4 phosphoric acid
HCD higher-energy collisional dissociation
HEPES 4-(2-hydroxyethyl)-1-piperazineethanesulfonic acid HPTLC high performance thin layer chromatography
HR homologous recombination
IIS insulin/insulin-like growth factor signalling
IP immunoprecipitation
IR ionizing radiation
kb kilobases
KH 2 PO 4 potassium dihydrogen phosphate
KOH potassium hydroxide
KPO 4 potassium phosphate
KEGG kyoto encyclopedia of genes and genomes
kV kilovolt
L1-L4 larval stages 1 to 4
LB lysogeny broth
LC-ESI-MS/MS electrospray ionization-tandem mass spectrometry LC-MS/MS liquid chromatography-tandem mass spectrometry
Log logarithm
Lys-C endoproteinase
m/z mass-to-charge ratio
M molar
MgCl 2 magnesium chloride MgSO 4 magnesium sulfate
m minutes
ml milliliter
mM millimolar
mmBCFAs monomethyl branched chain FAs
MMR mismatch repair
mRNA messenger RNA
MRM multiple reaction monitoring
ms milliseconds
MS mass spectrometry
mJ/cm 2 millijoule/square centimeter
NaCl sodium chloride
NaClO sodium hypochloride NER nucleotide excision repair
NGM nematode growth medium
NHEJ non-homologous end joining repair Na 2 HPO 4 disodium phosphate
NH 4 OH ammonium hydroxide
nm nanometer
p-value probability value
PCNA proliferating cell nuclear antigen PCR polymerase chain reaction
PC phospahtidylcholine
PE phosphatidylethanolamine
PG phosphatidylglycerol
PI phosphatidylinositol
PI3/AKT phosphatidylinositol 3-kinase
PKC protein kinase C
PIP2 phosphatidylinositol 4,5 bisphosphate
PLC phospholipase C
pmol picomole
ppm parts per million
PS phosphatidylserine
PTMs post-translational modifications r Pearson correlation coefficient RAD radiation sensitive
rcf relative centrifugal force RNAP II RNA polymerase II
RNP ribonucleoprotein
RPA replication protein A rpm revolutions per minute ROC1 regulator of cullins 1 ROS reactive oxygen species
s seconds
S6K1 ribosomal protein S6 kinase beta-1
SD standard deviation
Ser/S serine
SFA saturated fatty acid
SILAC stable isotope labeling by aminoacids in cell culture
SL sphingolipids
SM sphingomyelin
SQST-1 sequestosome related
STAT signal transducers and activators of transcription SWI/SNF switching defective/sucrose non-fermenter
TC-NER transcription-coupled nucleotide excision repair TFA trifluoroacetic acid
TFIIH transcription initiation factor IIH
Th Thomson
Thr/T threonine
TiO2 titanium dioxide
TLC thin layer chromatography TOR target of rapamycin
TRIS tris(hydroxymethyl)aminomethane TTD trichothiodystrophy
Tyr/Y tyrosine
UFA unsaturated fatty acid
UNC uncoordinated
UPR unfolded protein response UPS ubiquitin proteasome system
UV ultraviolet
XP xeroderma pigmentosum
XPA xeroderma pigmentosum complementation group A
XPB xeroderma pigmentosum complementation group B
XPC xeroderma pigmentosum complementation group C
XPD xeroderma pigmentosum complementation group D
XPE xeroderma pigmentosum complementation group E
XPF xeroderma pigmentosum complementation group F
XPG xeroderma pigmentosum complementation group G
Contents
Summary iv
Zusammenfassung v
Abbreviations vi
List of Figures xvi
1 Introduction 1
1.1 Ultraviolet-induced DNA lesions . . . . 2
1.2 The NER pathway . . . . 2
1.2.1 DNA damage recognition . . . . 3
1.2.2 DNA damage verification, strand incision and repair synthesis . . . . . 4
1.3 NER-deficiency syndromes in humans: cancer versus development and aging . . . . 6
1.4 Model organisms as a tool to study NER-deficiency syndromes . . . . 6
1.4.1 C. elegans as an in vivo model for NER-studies . . . . 7
1.4.2 Linking DNA damage to aging and longevity . . . . 8
1.5 High-throughput approaches to identify global response mechanisms upon stress 9 1.5.1 Role of lipids in cellular metabolism . . . . 10
1.5.2 Metabolic alterations as hallmark of stress and aging . . . . 11
1.5.3 Mass spectrometry approach and analysis . . . . 13
1.6 Aim of study . . . . 15
CONTENTS
2 Materials and Methods 16
2.1 C. elegans handling techniques . . . . 16
2.1.1 Growing conditions . . . . 16
2.1.2 Genotyping strains . . . . 18
2.1.3 Hypochlorite treatment for worm synchronization . . . . 19
2.2 Sample processing for mass spectrometry . . . . 19
2.2.1 Entire worm lysate (EWL) preparation for Mass Spectrometry . . . . . 19
2.2.2 In solution digestion . . . . 20
2.2.3 Phosphopeptide enrichment . . . . 21
2.2.4 Peptide analysis by liquid chromatography and mass spectrometry . . . 21
2.2.5 MaxQuant and bioinformatics . . . . 22
2.3 Lipid analysis . . . . 24
2.3.1 Thin layer chromatography . . . . 24
2.3.2 Lipid analysis by mass spectrometry . . . . 24
2.4 Analysis of somatic arrest post UV-B-irradiation . . . . 25
2.5 Statistical analysis . . . . 25
2.6 Software and databases . . . . 25
2.7 Reagents and instruments . . . . 26
3 Results 27 3.1 Proteome analysis upon UV treatment . . . . 27
3.1.1 Protein annotations based on Gene Ontologies classification method . . 27
3.1.2 Implementation of C. elegans proteins annotations coverage . . . . 29
3.1.3 Upregulated protein clusters upon genotoxic stress . . . . 32
3.1.4 Downregulated protein clusters upon genotoxic stress . . . . 36
3.1.5 Analysis of proteome and transcriptome variations upon persistent DNA damage . . . . 39
3.2 Analysis of correlations between the UV-proteome and data from aging and starvation studies . . . . 41
3.2.1 Correlation between proteome upon UV treatment and aging . . . . 41
3.2.2 Correlation between proteomes from UV and starvation treatment . . . 41
CONTENTS 3.3 Lipidome analysis upon UV and starvation . . . . 45
3.3.1 Fatty acid biosynthetic pathways are affected by starvation and UV treatment . . . . 45 3.3.2 Change in sphingolipids abundance upon treatments . . . . 45 3.3.3 Glycerophospholipids profiling upon treatments . . . . 49 3.4 Proteome and phosphoproteome-coupled analysis to build a regulatory network
in response to persistent DNA damage . . . . 50
4 Discussion 60
5 References 68
Acknowledgements 99
Erkl¨arung 102
Lebenslauf 103
List of Figures
1.1 Chemical structures of UV-induced DNA lesions. . . . 3
1.2 Nucleotide excision repair sub-pathways. . . . . 5
1.3 Consequences of NER mutations in human patients in comparison with mice and C. elegans NER models. . . . 7
1.4 Overview of the lipid biosynthesis processes. . . . 11
1.5 IIS and TOR as sensor pathways for nutrients and stress. . . . 12
1.6 Assembly of the C. elegans autophagy machinery. . . . 13
1.7 Mass-spectrometry experimental procedure. . . . 14
2.1 Proteome and phosphoroteome datasetes reproducibility from xpc-1;csb-1 dou- ble mutants upon each treatment (untreated, UV-treated and starvation). . . . . 23
3.1 Experimental workflow of the proteomic analysis upon UV-induced DNA dam- age in C. elegans. . . . 28
3.2 Changes in abundance of proteins detected in xpc-1;csb-1 double mutants upon UV treatment. . . . 29
3.3 Most represented clusters of proteins which were found significantly (FDR <5 %) increased in abundance in xpc-1;csb-1 double mutants upon UV irradiation. 30 3.4 Most represented clusters of proteins which were found significantly (FDR <5 %) decreased in abundance in xpc-1;csb-1 double mutants upon UV irradiation. 31 3.5 Distribution of GO categories of significantly up and downregulated proteins in xpc-1;csb-1 double mutants upon UV treatment. . . . 32
3.6 1D enrichment plot highlights similarly regulated categories of proteins be-
tween C. elegans and Human. . . . . 33
LIST OF FIGURES 3.7 Autophagy mutants are sensitive to UV-induced DNA damage. . . . 38 3.8 Comparison between proteome of xpc-1;csb-1 double mutants and transcrip-
tome of similarly NER-deficient xpa-1 mutants after UV treatment. . . . 40 3.9 Most represented clusters of proteins which were found up- and/or down-
regulated at the proteome (xpc-1;csb-1 double mutants) and at the transcriptome (xpa-1 mutants) level after UV treatment. . . . 42 3.10 Comparison between proteins detected in xpc-1;csb-1 double mutants upon UV
treatment vs. aging in WT worms (Walther et al.,2015). . . . 43 3.11 A positively high correlation is registered for proteins that significantly change
in abundance in xpc-1;csb-1 double mutants upon UV treatment vs. starvation. 44 3.12 Fatty acid biosynthetic pathways coupled with sphingolipid and phospholipid
metabolic pathways. . . . . 46 3.13 A shift from triacylglycerols to free fatty acids was observed in xpc-1;csb-1
double mutants larvae upon starvation and UV treatment. . . . 47 3.14 Changes in the amount of three sphingolipids subclasses (ceramides, sphin-
gomyelins and glucosylceramides) upon treatments in xpc-1;csb-1 double mu- tants larvae. . . . 48 3.15 Changes in the amount of the five glycerophospholipids subclasses (PC, PE, PI,
PS and PG) upon treatments in xpc-1;csb-1 double mutants larvae. . . . 50 3.16 Network of interactions between proteins that are significantly regulated in xpc-
1;csb-1 double mutants upon UV treatment. . . . 52 3.17 Interaction map of Gene Ontologies biological processes that are statistically
overrepresented in our network. . . . . 54 3.18 Network of protein interactions in xpc-1;csb-1 double mutants upon UV treatment. 55 3.19 Animals lacking the transcription factor STA-1 are sensitive to persistent DNA
damage caused by UV treatment. . . . 57 4.1 Proteome, lipidome, and phosphoproteome analysis following UV treatment in
NER-deficient C. elegans. . . . . 61
Chapter 1 Introduction
Global societies experience demographic changes with an increasing burden of ageing- associated diseases. Understanding the causes of ageing and the mechanisms driving the ageing process remains still one of the major scientific challenges. The maintenance of the genome throughout life is of particular importance, as the DNA damage accumulation is thought to comprise a driving factor for the ageing process [91, 238]. Indeed, DNA lesions are con- stantly formed amid genotoxic attacks by exogenous sources such as UV light (UV) and ioniz- ing radiation (IR) or endogenous insults, such as reactive oxygen species (ROS) or metabolic by-products. To overcome the potential deleterious effects of genomic instability, cells have evolved specialized DNA repair systems, each repairing specific types of lesions. Base exci- sion repair (BER) rapidly removes ROS and oxidized bases produced during metabolic pro- cesses [68]. Mismatch repair (MMR) swipes up mistakes missed by the replication machinery, through scanning the newly replicated strand [138]. The error-prone non-homologous endjoin- ing (NHEJ) [142] and the accurate homologous recombination (HR) pathways [222] are key mechanisms for repairing DNA double strand breaks (DSBs). Bulky DNA lesions that disturb the normal double-helical structure of DNA, such as UV-induced 6-4 pyrimidine photoproducts (6-4PPs) [154] and cyclobutane pyrimidine dimers (CPDs) [211], are repaired by the nucleotide excision repair (NER) [?]. The bulky DNA lesions that disturb the normal double-helical struc- ture of DNA, as UV-induced 6-4 pyrimidine photoproducts (6-4PPs) [154] and cyclobutane pyrimidine dimers (CPDs) [211], are repaired by the nucleotide excision repair (NER) [36].
Mutations in the above-mentioned DNA repair systems have been identified in human patients
who suffer from elevated cancer susceptibility or premature ageing syndromes [209]. A clear
CHAPTER 1. INTRODUCTION distinction between cancer susceptibility and premature ageing has been observed in patient groups that carry distinct mutations in NER. For this reason, mutations in NER have been highly instructive for understanding the links between unrepaired DNA damage, and cancer development and accelerated ageing.
1.1 Ultraviolet-induced DNA lesions
Sunlight is a primary energy source for life on earth, but can also pose a serious genotoxic threat for most living organisms due to the variety of its adverse effects [217]. UV radiation is a component of sunlight, and its electromagnetic spectrum can be subdivided into ranges de- pending on its wavelength: UV-A (400-315 nm), UV-B (315-280 nm) and UV-C (280-100 nm).
UV-C is almost completely absorbed by the ozone layer and the atmosphere, along with most of the UV-B radiation [149]. UV-A is the most abundant but is less biologically relevant than UV-B, which is the best-absorbed radiation by the DNA [191]. UV radiation directly interacts with nucleotides to form mainly three types of mutagenic DNA lesions: CPDs [211], 6-4PPs [154], and Dewar valence isomers (DEWs) [225] (Figure 1.1). CPDs are the most prevalent UV-induced DNA photoproducts, causing only a slight bend in the DNA helix, while the 6- 4PPs induce a severe structural distortion of the DNA backbone at the site of the lesion [113].
6-4PPs are easily converted into their related DEWs upon further exposure to UV-B radiation [192]. Some organisms that are highly exposed to sunlight, such as plants and marsupials, pos- sess specialized photolyases that can directly revert either one of these lesions by splitting up the bulky bond [23]. Other organisms only employ the NER to repair the damage by excising a stretch of DNA surrounding the lesion and synthesizing a new undamaged strand [92].
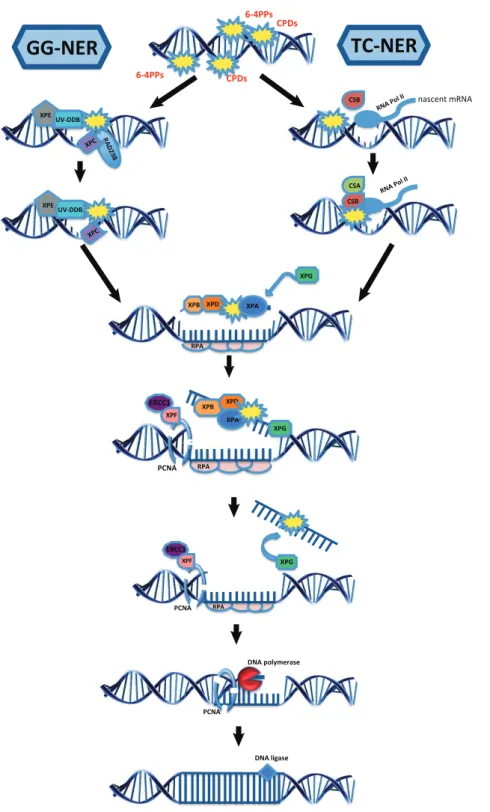
1.2 The NER pathway
6-4PPs and CPDs, are removed by two distinct NER sub-pathways: global-genome (GG-)
NER, which scans the entire genome for helix-distorting lesions, and transcription-coupled (TC-
) NER, which is directed at locations of stalled transcriptional complexes in actively transcribed
genes [152] (Figure 1.2).
CHAPTER 1. INTRODUCTION
UV radiation
UV radiation UV radiation
UV radiation
Figure 1.1: Chemical structure of UV-induced DNA lesions. The structure and formation of the three major classes of DNA lesions: CPDs, 6-4PPs and DEWs (modified from Rastogi,2010 [191]).
1.2.1 DNA damage recognition
GG-NER initiates with the detection of the DNA helix distortion by the damage sensor com-
plex XPC-RAD23B [220]. The poor substrate specificity of XPC-RAD23B for CPDs requires
the presence of the additional UV-DDB (UV DNA damage binding protein) complex, con-
CHAPTER 1. INTRODUCTION sisting of DDB1 and DDB2/XPE [241, 67]. UV-DDB, together with CUL4A (cullin 4A) and ROC1 (regulator of cullins 1), forms a larger ubiquitin ligase complex [80] that ubiquitinates DDB2 and XPC in response to UV-irradiation, thereby increasing XPC’s DNA-binding prop- erties [221]. TC-NER is instead activated by the stalling of RNA polymerase II (RNAP II) at the site of a transcription-blocking DNA lesion. The TC-NER-mediated response is initiated by the recruitment of two TC-NER-specific proteins: CSA (Cockayne syndrome complemen- tation group A) and CSB (Cockayne syndrome complementation group B) [69]. CSA encodes a WD40 repeat protein, involved in protein-protein interactions with CSB, and a subunit of RNAP II. It forms, along with DDB1, CUL4A, and ROC1, a complex exhibiting ubiquitin ligase activity [204]. CSB is a repair-coupling factor that belongs to the SWI/SNF family of ATP-dependent chromatin remodelers, and has additional nucleosome remodeling activity by binding to core histone proteins in vitro [35]. CSB stimulates transcription elongation by RNAP II [210], and together with CSA is required for further assembly of the TC-NER machinery.
Cells carrying defective CSA or CSB lack the selective repair of transcribed genes, showing elevated UV-sensitivity [237].
1.2.2 DNA damage verification, strand incision and repair synthesis
Once a lesion is detected by the GG-NER or TC-NER machineries, the TFIIH (transcription initiation factor IIH) complex is recruited for DNA damage verification, to unwind, and sub- sequently to open the DNA helix using its core helicase subunits XPB and XPD [208]. After helix opening, XPA, XPG, and the replication protein A (RPA) are recruited to the repair site, with a consequent release of the XPC-RAD23 complex from the DNA [198]. XPA allows the assembly of the preincision complex, meanwhile RPA coats and protects the undamaged strand, aiding the positioning of the endonucleases ERCC1-XPF and XPG on the damaged strand [50].
The ERCC1-XPF endonuclease catalyzes the first incision at the 5-end, followed by the 3-end
incision performed by XPG [218]. The free 3-hydroxyl group produced by the 5-excision is
sufficient to start repair synthesis. Meanwhile the TFIIH-bound oligonucleotide carrying the
lesion is released and subsequently degraded [108]. Distinct DNA polymerases (DNA Polδ ,
Polε , and Polκ) [183] are required for the repair synthesis, with the help of the replication
clamp PCNA and the clamp loader RFC [214]. The DNA Polε requires the DNA ligase 1 for
gap-filling synthesis in proliferating cells [168] (Figure 1.2).
CHAPTER 1. INTRODUCTION
CPDs
6-4PPs
GG-NER
CPDs 6-4PPs
nascent mRNA RNA Pol
CSB II
RNA Pol CSA II RAD23B
XPB XPD
XPG
XPB XPA XPD
PCNA XPF ERCC1
XPA
RPA
XPG
TC-NER
XPE UV-DDB XPC
XPE UV-DDB XPC
RPA
CSB
XPF XPG ERCC1
DNA ligase DNA polymerase PCNA
PCNA RPA
Figure 1.2: Nucleotide excision repair sub-pathways. GG-NER recognizes DNA lesions while scanning the
whole genome, while TC-NER initiates repair when RNA polymerase II stalls at a lesion. Except the initial
damage recognition part, the verification, dual excision, repair synthesis and ligation mechanisms are shared.
CHAPTER 1. INTRODUCTION
1.3 NER-deficiency syndromes in humans:
cancer versus development and ageing
Congenital syndromes that are caused by heritable mutations in DNA repair and genome stability pathways, and that are manifested in cancer susceptibility and accelerated ageing, un- derline the importance of genome maintenance for withstanding ageing [62]. Important in- sights about the distinct consequences of genome instability have been provided by studying NER deficiency syndromes [209]. Xeroderma pigmenstosum (XP) is an autosomal recessive disease caused by mutations compromising only the GG-NER sub-pathway. Patients carrying mutations in XPC or XPE genes, involved in initial damage detection, show UV-induced pig- mentation abnormalities and high skin cancer susceptibility [119]. Mutations impairing only the TC-NER sub-pathway (affecting CSA or CSB genes), cause instead the onset of Cockayne syndrome (CS), a disease characterized by severe mental retardation traits and accelerated age- ing [131]. Mutations in NER factors such as XPA and XPD, which are employed by both GG- and TC-NER, can lead to XP (typically with neurodegenerative components) [54], rare cases of XP combined with CS, and trichothiodystrophy (TTD) [119]. TTD patients in addition to displaying photosensitivity, also suffer from prematurely aged appearance (progeria) [36].
1.4 Model organisms as a tool to study NER-deficiency syndromes
Due to the complexity of the physiological alterations occurring in human pathologies re- sulting from DNA repair defects, a number of model organisms including mice [5, 48, 47] and nematodes [126, 219, 19], have been extensively used to investigate the mechanisms responding to persistent DNA lesions in the context of development and ageing (Figure 1.3).
Mouse models, carrying the same mutations in NER genes identified in human subjects with
skin cancer susceptibility [51, 233, 206] or in CS and TTD patients [246, 226, 47, 234, 106],
have been created to better understand the pathological outcomes of DNA repair defects. The
complete inactivation of NER activity in Xpa mutant mice leads to high susceptibility to UV-
induced carcinogenesis [51]. The same susceptibility is observed upon partial NER inactivation
CHAPTER 1. INTRODUCTION
Mutations in the TC- NER sub-pathway:
Severe postnatal growth and mental retardation with progeriod traits.
High skin cancer susceptibility, abnormal pigmentation, skin atrophy.
Mutations in NER core factors:
combined with
with neurodegeneraitve components )
NER mutations:
Xpc -/- Xpa -/-
Sensitivity to UV- induced carcinogenesis
Ercc-1-/- Xpg -/- Xpf -/- Csbm/m/Xpa -/- Csbm/m/Xpc -/- Xpd TTD Xpd TTD/Xpa -/-
Growth retardation and features of accelerated ageing.
GG-NER mutations:
xpc-1 rad-23
Genome instability in highly proliferative cell types (adult germline and early embryos) upon UV treatment.
TC-NER mutations:
csb-1 csa-1
Developmental growth delay and premature ageing upon UV treatment.
NER mutations:
Mutations in the GG-NER sub- pathway:
Homo sapiens Mus musculus Caenorhabditis elegans
Figure 1.3: Consequences of NER mutations in human patients in comparison to mice and C. elegansNER models. In contrast to human patients, genetic inactivation of GG-NER (e.g., Xpc) or TC-NER (Csb or Csa) genes alone in mice have comparatively mild consequences and mainly elevate susceptibility to UV-induced carcinogen- esis. However, when genetically combined, the mutations give rise to severe CS-like phenotypes such as retarded postnatal developmental growth and features of premature ageing.
in Xpc and Csb mutant mice, indicating distinct consequences compared to human patients in whom skin cancer susceptibility had been primarily linked to GG-NER [233, 206]. The mild progeroid phenotypes of Csb mutant mice were severely enhanced when either Xpc or Xpa were additionally inactivated [234]. Although the mouse models are highly instructive, the links between NER mutations and the pathological outcomes have remained poorly understood [131]. Therefore simpler metazoan systems might be utilized to shed new light on the response mechanisms to unrepaired DNA lesions in the context of development and ageing.
1.4.1 C. elegans as an in vivo model for NER-studies
The soil nematode Caenorhabditis elegans has been extensively used as a metazoan in vivo
model [22] to study ageing [174, 39] and to better understand the consequences of DNA re-
CHAPTER 1. INTRODUCTION free-living nematode, that undergoes a deterministic developmental program and that can be easily genetically manipulated. Newly hatched larvae pass through four larval stages (L1 to L4) before reaching adulthood. The adult worm, in case of hermaphrodites, self-fertilize to generate offsprings within the first few days of adulthood [26]. C. elegans L1 larvae, in re- sponse to environmental stresses, such as crowding, starvation and heat stress, are able to arrest their development and enter in L1 diapause stage. This arrest is reversible, and characterized by an increased nematode stress resistance [14]. In C. elegans most of the major mammalian repair pathways, including NER, are evolutionarily conserved. NER in C. elegans is the major pathway involved in the DNA damage response caused by UV radiation [125]. Mutations in the two NER branches result in distinct outcomes of the UV response. Mutations in the GG- NER gene xpc-1 lead to genome instability in proliferating cells, which in adult nematodes are restricted to the germline [124]. UV-treated GG-NER-deficient xpc-1 mutant larvae complete somatic development, though they are unable to develop a germline [169]. In contrast, TC- NER-deficient csb-1 or csa-1 mutants undergo a somatic developmental arrest or delay upon UV exposure, without their germline being affected [169, 124, 219, 7]. Thus, GG-NER de- fects are linked to genome instability in proliferating cells, a hallmark of cancer development in humans, while TC-NER defects mirror the growth defects and accelerated decline in tissue functionality associated with CS [249, 196]. Completely NER-deficient xpa-1 or xpc-1;csb-1 double-mutants are UV-hypersensitive: even low UV doses cause both somatic and germline growth arrest [219, 124, 169]. Taken together, the phenotypic distinction of GG- and TC-NER mutants has established C. elegans as a useful genetic model for the study of NER deficiencies.
where GG-NER defects lead to genome instability in proliferating cells which in humans comprises a causal event in malignant transformation, while TC-NER defects lead to severe developmentalgrowth delays mirroring a primary CS-associated clinical feature.
1.4.2 Linking DNA damage to ageing and longevity
The conserved NER mechanisms acting during somatic development and tissue maintenance
provide a unique opportunity to investigate DNA damage response mechanisms during meta-
zoan development and ageing. In worms, as in mammals, highly conserved longevity assur-
ance mechanisms are involved in counteracting the detrimental consequences of persistent DNA
damage [62]. In NER-deficient mutants, the insulin/insulin-like growth factor signalling (IIS),
CHAPTER 1. INTRODUCTION a conserved pathway regulating development, stress resistance and lifespan, is activated. The role of the IIS is to control the C. elegans development in response to environmental stresses through its effector, the transcription factor DAF-16/FOXO. Under normal conditions, DAF-16 is hyperphosphorylated by IIS signalling and sequestered in the cytosol in its inactive form.
Only when IIS is turned off, for example during starvation, hypophosphorylated DAF-16 is ac- tivated and it translocates into the nucleus to modulate expression of genes involved in stress resistance and longevity [182]. The IIS pathway, through DAF-16, also responds in somatic tissues upon UV treatment to counteract DNA damage-driven ageing by elevating tolerance to persistent DNA damage [169, 28]. IIS attenuation in somatic tissues, leads to the activa- tion of DAF-16, which overcomes the developmental delay and promotes tissue integrity in the presence of unrepaired DNA lesions. A plethora of DAF-16 target genes have already been identified, some of which regulated ROS scavengers, detoxification enzymes, chaperones, and a large number of functionally uncharacterized genes [172, 250]. The bona fide longevity assur- ance mechanisms of DAF-16 activity might antagonize DNA damage-driven growth retardation and ageing by elevating tolerance towards persistent or accumulating DNA damage, thus raising the threshold when the age-dependent accumulation of DNA damage leads to functional dete- rioration [169]. Strikingly, NER-deficient csb-1;xpa-1 double mutant and ercc-1 mutant mice, with growth defects and accelerated ageing phenotype, showed a similar dampening of the IIS- equivalent somatotropic axis [178, 234, 232]. Taken together, studies on NER mutants sug- gest the presence of highly conserved system-wide response mechanisms to genome instability during nematode and mammalian developmentand ageing [62].
1.5 High-throughput approaches to identify global response mechanisms upon stress
To date, high-throughput and quantitative mass-spectrometry (MS)-based approaches are largely used for detection of global protein dynamics in complex organismal mixtures [76].
In C. elegans, many transcriptome and proteome studies have been performed, allowing the
identification of key regulators in response to stress [20, 169, 129, 188, 141], to IIS dampening
[78, 83, 202, 59, 53, 242], and during ageing [242, 174, 141, 39]. Moreover, coupling large-
CHAPTER 1. INTRODUCTION [17, 147] with global transcriptome studies [20, 169], is a powerful approach to gain knowl- edge about the role of signalling pathways involved under normal and altered conditions [75].
MS-based lipidomic and metabolomics approaches [115, 102, 174, 39, 70, 53, 34] are recently emerging as high throughput technologies to advance our understanding about molecular bio- logical processes and metabolic changes indicative of physiological adaptations upon specific conditions, such as stress [184, 89] or ageing [166, 97].
1.5.1 Role of lipids in cellular metabolism
In biological systems, fatty acids (FAs) play important roles in energy storage, membrane dynamics and structure, and signalling [240, 95]. Lipids undergo cycles of synthesis and degra- dation, fundamental to store and produce energy, generally defined as lipid metabolism. In the cell, lipids are usually stored as triacylglycerols in cytoplasmic organelles, called lipid droplets, which play a crucial role in the regulation of intracellular fat storage and energy metabolism [11, 243]. Upon increased energy demand, triacylglycerols are hydrolyzed by lipases to form the lipid intermediate diacylglycerol (DAG), working as second messenger to activate the down- stream protein kinase C (PKC) [227], and free FAs, used as energy source [130]. Fatty acids not only work as energy storage, but also serve as structural components of membranes. The biosyn- thesis of complex straight chain FAs, starts in the cytosol from acetyl-CoA, which undergoes chain elongation and extension steps through the action of carboxylase and fatty acid synthases enzymes. Further cycles of elongation and desaturation of the previously formed short- and medium-chain FAs lead to the formation of saturated (SFAs) and unsaturated (UFAs) long-chain fatty acids, building blocks for the more complex sphingolipids (SL) and glycerophospholipids [258](Figure 1.4).
Both SLs and glycerophospholipids are highly conserved components of cell membranes.
SLs are intermediates for the production of ceramide (Cer), a key product for the synthesis of glucosylceramide (GlcCer) [236, 258], having a role in stress responses upon DNA dam- age [261, 255, 256], and sphingomyelin (SM), which controls growth and ageing [46, 84].
Another major component of cellular membranes is the lipid class of glycerophospholipids
[236, 90, 258], synthesized from the intermediate phosphatidic acid. The downstream prod-
ucts of phosphatidic acid, DAG and cytidine diphosphatediacylglycerol (CDP-DAG), are both
intermediates for the synthesis of more complex glycerophospholipids: phosphatidylcholine
CHAPTER 1. INTRODUCTION
PC
PC PC
PE GlcCer
Cer
PS
PG
SM
PI
Triacylglycerols
DAG DAG
Sphingolipids(SL) Phospholipids
Figure 1.4: Overview of the lipid biosynthesis processes. Principal pathways for the production of: lipid storage (triacylglycerols) and the more complex membrane components sphingolipids (SL) and glycerophospholipids. The key lipid class members are highlighted (modified from [94]).
(PC), phosphatidylethanolamine (PE), phosphatidylserine (PS), phosphatidylinositol (PI) and phosphatidylglycerol (PG) [258] (Figure 1.4). Glycerophospholipids are pathogenic indica- tors of many disorders, such as the neurodegenerative Alzheimers disease [247, 170] or cancer [58], suggesting their possible implication in ageing-related changes. Based on the diverse and widespread biological roles of lipids in terms of energy storage and intracellular signalling, complete quantitative lipid profiles will be important to understand how biological system are influenced by stress conditions.
1.5.2 Metabolic alterations as hallmark of stress and ageing
Lipids metabolism [251, 101, 112] is a biological modulator upon ageing [166, 97] or in re- sponse to stress [184, 96, 223].
Together with protein synthesis, and autophagy [200, 193] it acts in cellular processes
CHAPTER 1. INTRODUCTION downstream of key pathways involved in growth, metabolism, stress responses, and can- cer, such as the IIS pathway [70, 194, 53] and the target of rapamycin (TOR) pathway [261, 262, 99, 128, 251] (Figure 1.5).
Figure 1.5: IIS and TOR as sensor pathways for nutrients and stress. TOR and IIS pathways incorporate en- docrine (insulin and IGFs) and local signals (amino acids) in order to modulate growth and metabolism accordingly (modified from [18])
The TOR signalling network, in parallel to the phosphatidylinositol 3-kinase (PI3)/AKT
pathway, controls fat metabolism by regulating the activation of the nuclear receptor PPAR,
which is responsible for efficient lipid accumulation [112]. Parallel to this, TOR also reg-
ulates, through phosphorylation, two downstream effectors, the ribosomal protein S6 kinase
beta-1 (S6K1, RSKS-1 in C. elegans) and the eukaryotic translation initiation factor 4E-binding
protein 1 (4E-BP1), to positively regulate protein synthesis. Upon increased amino acid avail-
CHAPTER 1. INTRODUCTION ability, TOR, via S6K1 phosphorylation, induces a negative feedback loop on the IIS pathway [230], an important regulator of glucose and lipid metabolism [205, 252, 70, 71]. In response to impaired proteostasis, a direct cause of ageing and genotoxic stress [189],TOR also activates autophagy pathways. Under unfavorable conditions (such as nutrient deprivation) the inhibition of TOR leads to autophagy, which through breakdown of lipid droplets (lipophagy), favours lipid mobilization for use as an energy source [216]. Autophagy, under the regulation of the IIS and TOR pathways, acts on lipid homeostasis upon germline loss C. elegans to positively modulate ageing and longevity [127]. The autophagy process starts with the recruitment, in a hierarchical order, of autophagy machinery components to sequester aberrant protein aggregates into autophagosomes, which subsequently will fuse to lysosomes for degradation [43, 259, 200]
(Figure 1.6).
STRESS
VESICLE NUCLEATION
&
ELONGATION
DOCKING
&
FUSION
VESCICLE BREAKDOWN
&
DEGRADATION autolysosome lysosome
autolphagosome phagophore
Toxic protein aggreagtes
EPG-5 EPG-3
EPG-4
EPG-6 CUP-5
BEC-1 EPG-8 VPS-34
LGG-1
LGG-1 ATG-9
ATG-18 ATG-2
EPG-9 EPG-1
UNC-51
Figure 1.6: Assembly of the C. elegans autophagy machinery. Autophagy-related proteins and protein com- plexes are sequentially involved in the assembly of the autophagosome (macroautophagy) (modified from [259]).
1.5.3 Mass spectrometry approach and analysis
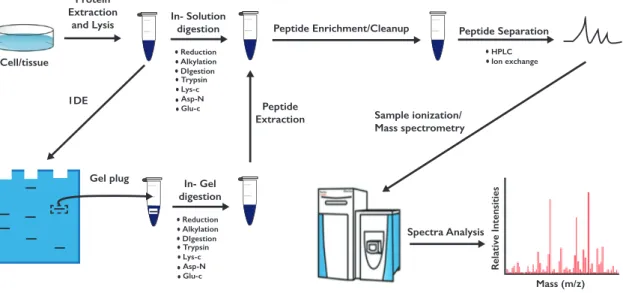
The liquid chromatography-tandem mass spectrometry (LC-MS/MS) is a very powerful and
sensitive technique used to identify and quantify molecules, from simple to complex mixtures,
based on their mass-to-charge (m/z) ratio. A MS experiment starts with protein extraction from
the biological sample, followed by protein lysis, reduction of protein disulfide bonds, and cys-
teine alkylation. The proteins are then digested into small peptides, which are easily fractionated
by LC to produce simpler spectra for protein identification. The purified sample is ionized and
CHAPTER 1. INTRODUCTION placed in a mass detection system for analysis. The values on the x-axis in the mass spectra re- fer to mass-to-charge (m/z) ratios, whereas the values on the y-axis usually report the intensity or abundance of the peptides [82] (Figure 1.7).
Mass (m/z)
R elative Intensities
Trypsin Lys-c Asp-N Glu-c
Cell/tissue
Spectra Analysis
Peptide Separation
HPLC Ion exchange
Sample ionization/
Mass spectrometry Protein
Extraction
and Lysis In- Solution digestion
Reduction Alkylation DIgestion
Trypsin Lys-c Asp-N Glu-c
In- Gel digestion
Reduction Alkylation DIgestion
Peptide Enrichment/Cleanup
Peptide Extraction 1DE
Gel plug
Figure 1.7: Mass-spectrometry experimental procedure. Sample preparation involves a first step of lysis, fol- lowed by protein or peptide enrichment, sample clean-up and protein digestion.
The identification of specific PTMs (e.g., phosphorylation, ubiquitination and glycosylation) is obtained by enrichment of specific target peptides and sample clean-up using PTM-specific antibodies or ligands. For example, global phosphorylation status can be assessed by immuno- precipitation (IP) using anti-phospho-specific antibodies or by a sample pull-down using ti- tanium dioxide (TiO2) beads, which selectively binds phosphorylated serine (pS), threonine (pT) or tyrosine (pY). The raw files from the mass spectrometer are subjected to analysis using the MaxQuant software, implemented with the Andromeda search engine [42, 40]. Acquired MS/MS spectra are compared to reference proteome databases of the model organism used in the study (for example, Uniprot and Wormbase for C. elegans assays). Gene Ontologies (GO), KEGG and GSEA annotations (provided by the Uniprot database) are used as classification methods to gain more detailed information about the proteins changing in the tested sample.
An improved knowledge about the protein signalling networks upon normal and altered condi-
tions can be achieved by creating a protein-protein interaction map, with the help of bioinfor-
CHAPTER 1. INTRODUCTION matics software platforms, such as Cytoscape [212]. In Cytoscape, protein abundance changes and PTMs alterations are integrated with interaction data available from database repositories, allowing to specifically highlighting regulated nodes and protein clusters.
1.6 Aim of study
The aim of this study is to use a MS technology-based approach to gain a comprehensive un-
derstanding of the response mechanisms to persistent DNA lesions on the C. elegans organismal
level. We analysed proteome, phosphoproteome, and lipidome alterations in response to UV-B
irradiation of xpc-1;csb-1 mutant worms, that are completely defective in the NER-mediated
removal of UV-induced DNA lesions [169]. This multiple omics approach on NER-deficient
mutants will provide a unique and detailed vision of the organismal adaptations the response
to persistent DNA damage. On the proteome level, we found similarities between the response
to UV irradiation in NER-deficient animals and proteome alterations during ageing, as well as
proteome alterations in response to starvation, both of which are regulated through the IIS path-
way [174, 242, 141, 129, 188, 59, 53]. Moreover, at the metabolic level we observed a reduction
in abundance of proteins functioning in carbohydrate, amino acid, and lipid metabolism that re-
semble metabolic changes observed upon starvation [129] and during ageing [174, 39]. We also
observed a significant role of autophagy, under the regulation of TOR and IIS pathways, in the
maintenance of tissue functioning amid persistent DNA damage. Next, we devised a compre-
hensive signalling response network to DNA damage by integrating proteome and phosphopro-
teome changes upon persistent DNA damage. Furthermore, by analysing lipidome changes, we
identified metabolic alterations that indicate a shift to somatic preservation in response to DNA
damage. With our analysis we provide new insights into the physiological adaptations of animal
response to persistent DNA damage, and an interesting starting point for future investigations
of protein candidates to develop signal transduction networks.
Chapter 2
Materials and Methods
2.1 C. elegans handling techniques
2.1.1 Growing conditions
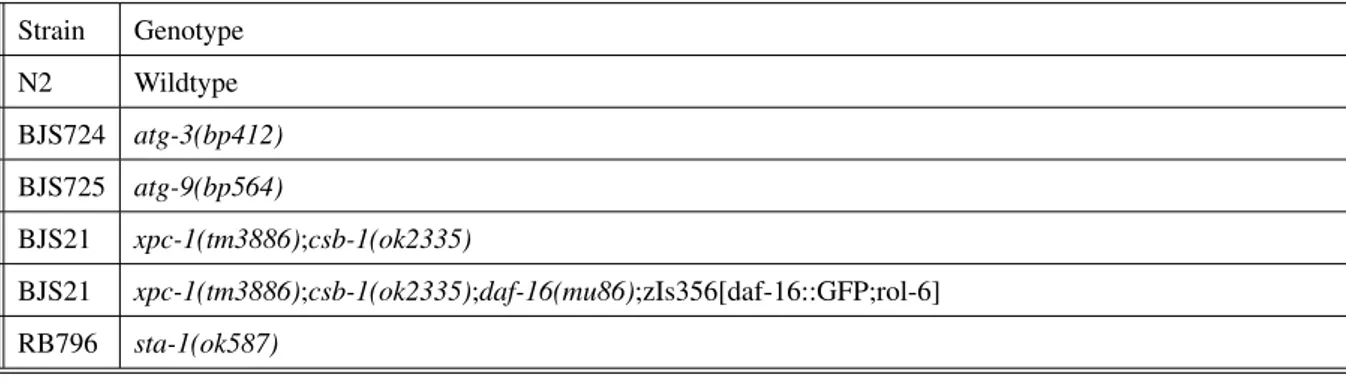
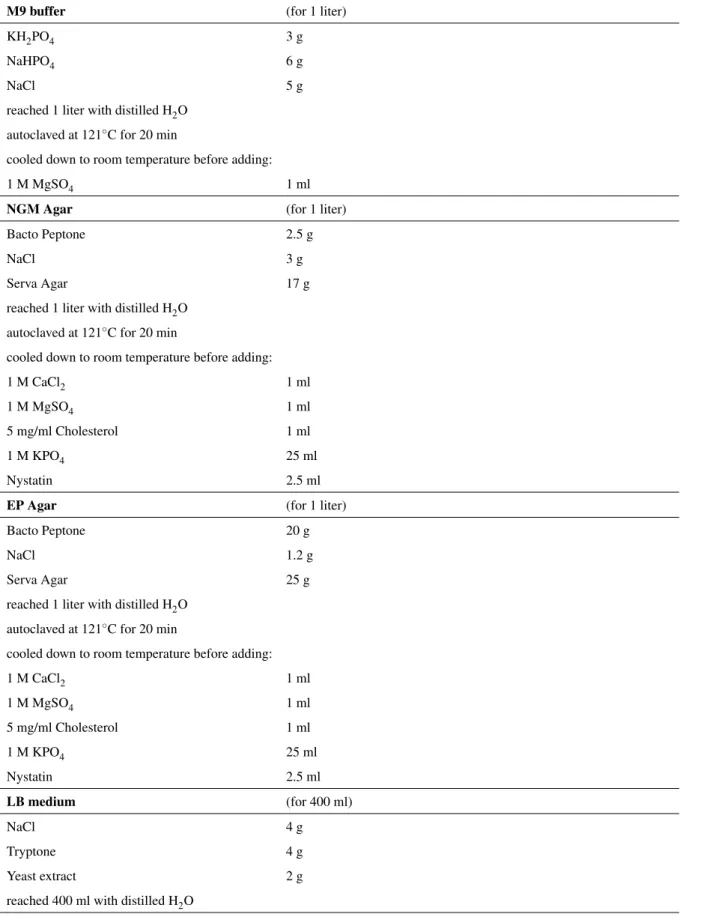
In this study, C. elegans strains were cultured and maintained according to standard laboratory conditions (20 ◦ C) on nematode growth medium (NGM) plates seeded with OP50 Escherichia coli strain [22]. E. coli cultures were grown in lysogeny broth (LB) medium, overnight at 37 ◦ C with constant shaking at 180 rpm. M9 buffer was used to collect and wash the worm samples. The strains and the specific solutions used in the study are listed in Table 2.1 and Table 2.2 .
Strain Genotype
N2 Wildtype
BJS724 atg-3(bp412) BJS725 atg-9(bp564)
BJS21 xpc-1(tm3886);csb-1(ok2335)
BJS21 xpc-1(tm3886);csb-1(ok2335);daf-16(mu86);zIs356[daf-16::GFP;rol-6]
RB796 sta-1(ok587)
Table 2.1: C. elegans strains used in this study provided by the CGC
CHAPTER 2. MATERIALS AND METHODS
M9 buffer (for 1 liter)
KH 2 PO 4 3 g
NaHPO 4 6 g
NaCl 5 g
reached 1 liter with distilled H 2 O autoclaved at 121 ◦ C for 20 min
cooled down to room temperature before adding:
1 M MgSO 4 1 ml
NGM Agar (for 1 liter)
Bacto Peptone 2.5 g
NaCl 3 g
Serva Agar 17 g
reached 1 liter with distilled H 2 O autoclaved at 121 ◦ C for 20 min
cooled down to room temperature before adding:
1 M CaCl 2 1 ml
1 M MgSO 4 1 ml
5 mg/ml Cholesterol 1 ml
1 M KPO 4 25 ml
Nystatin 2.5 ml
EP Agar (for 1 liter)
Bacto Peptone 20 g
NaCl 1.2 g
Serva Agar 25 g
reached 1 liter with distilled H 2 O autoclaved at 121 ◦ C for 20 min
cooled down to room temperature before adding:
1 M CaCl 2 1 ml
1 M MgSO 4 1 ml
5 mg/ml Cholesterol 1 ml
1 M KPO 4 25 ml
Nystatin 2.5 ml
LB medium (for 400 ml)
NaCl 4 g
Tryptone 4 g
Yeast extract 2 g
reached 400 ml with distilled H 2 O
Table 2.2: Common solutions used for C. elegans handling
CHAPTER 2. MATERIALS AND METHODS
2.1.2 Genotyping strains
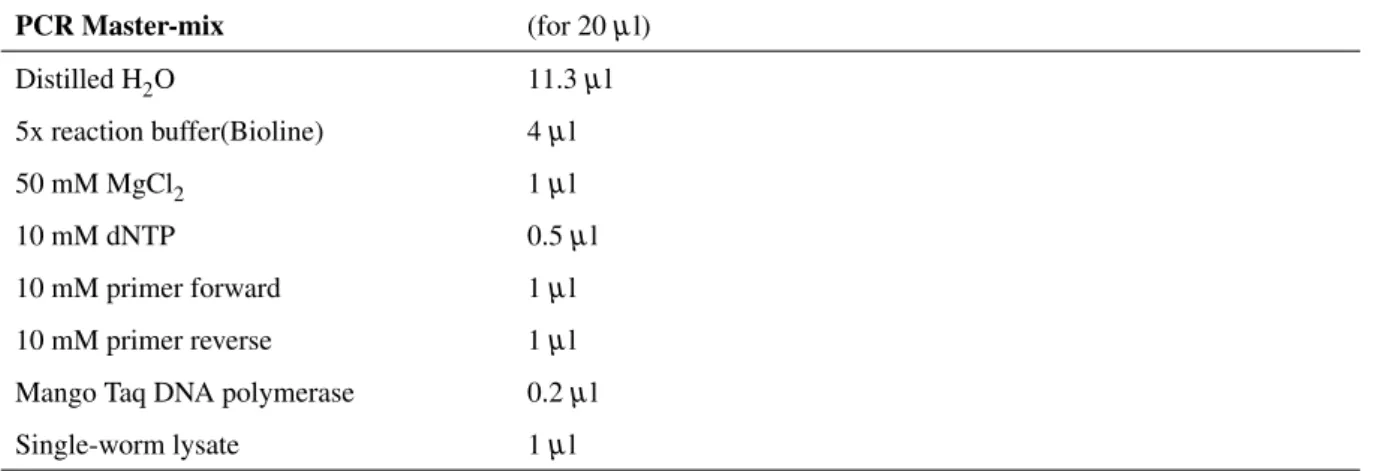
The genotype of worm strains were confirmed using polymerase chain reaction (PCR) per- formed in the C1000 Thermal Cycler (BioRad) with the corresponding primer sets. The DNA was obtained by incubating the worms in worm lysis buffer, supplemented with proteinase K to allow protein digestion (see recipes below). After 1 h at 65 ◦ C and 10 min at 95 ◦ C in the Thermal Cycler, the lysate can be mixed with the PCR master mix to allow for the genotyping reaction to be run (Table 2.3 and Table 2.4) .
Worm lysis buffer (for 100 ml)
1 M KCl 5 ml
1 M Tris (pH 8.3) 1 ml
1 M MgCl
2250 µl
Tween 20 450 µl
reached 100 ml with distilled H
2O autoclaved at 121
◦C for 20 min
cooled down to room temperature before adding:
Gelatine 0.01 g
Proteinase K (20 mg/ml) with 1:20 dilution right before use
Table 2.3: C. elegans lysis buffer
PCR Master-mix (for 20 µ l)
Distilled H 2 O 11.3 µl
5x reaction buffer(Bioline) 4 µl
50 mM MgCl 2 1 µl
10 mM dNTP 0.5 µl
10 mM primer forward 1 µl
10 mM primer reverse 1 µl
Mango Taq DNA polymerase 0.2 µl
Single-worm lysate 1 µl
Table 2.4: Reagents mix for PCR reaction
Running a gradient of the annealing temperatures allowed the optimization, for each muta-
tion, of the final PCR programs (see the set up for a standard genotyping PCR in Table 2.5).
CHAPTER 2. MATERIALS AND METHODS
Standard Genotyping PCR
95
◦C 4 minutes Initial denaturation
95
◦C 30 seconds Denaturation
55
◦C-60
◦C 30 seconds Annealing
72
◦C (1min/kb) Extension
Go to step 2 for another 34 cycles Cycles of denaturation,annealing and extension
72
◦C 7 minutes Final extension
10
◦C forever
Table 2.5: Standard PCR reaction for genotyping C. elegans strains
2.1.3 Hypochlorite treatment for worm synchronization
Adult worms growing on NGM plates were washed off with M9 buffer (see Table 2.2) adjusted to a volume of 4 ml and mixed with 1:1 volume of bleaching solution (see Table 2.6). The worms were lysed in this mixture by vortexing for 5 m to allow their rupture and the consequent release of the eggs. Eggs were collected by centrifugation for 1 m at 2000 rcf and washed three times with M9 buffer. Synchronized L1 larvae were obtained by leaving these eggs hatching in M9 buffer overnight at 20 ◦ C with shaking.
Bleaching solution (for 50 ml)
1 M KOH 12.5 ml
Sodium hypochloride 10 ml
reached 50 ml with distilled H 2 O
Table 2.6: Solution mix for hypochlorite treatment
2.2 Sample processing for mass spectrometry
2.2.1 Entire worm lysate (EWL) preparation for Mass Spectrometry
Aged-synchronized xpc-1;csb-1 double mutants growing on EP-agar plates were treated
with hypochlorite treatment to obtain a large population of synchronised L1 larvae. L1 larvae
were filtered through a 11 m Nylon Net filter, then transferred to NGM OP50-seeded plates
and fed for 3 h at 20 ◦ C before being UV-treated (310 nm) with 100mJ/cm 2 , using a UV6 bulb
(Phillips) in a Waldmann UV236B irradiation device or mock-treated. In parallel, worms for
the starvation assay were kept rolling in M9 buffer. Around 2 million L1 larvae were used for
CHAPTER 2. MATERIALS AND METHODS each replicate condition. Starved and UV-treated worms were kept at 20 ◦ C for 6 h before they were collected in M9 buffer. Worms were concentrated by centrifugation and washed using an Extraction buffer (see Table 2.7). The pellet was immediately flash frozen in liquid nitrogen.
Extraction solution (for 25 ml)
1 M HEPES−KOH,pH 7.5 1.25 ml
5 M NaCl 1.5 ml
0.5 M EDTA,pH 8.0 50µ l
10% Triton X 2.5 ml
10 % sodium deoxycholate 250µl
50 % glycerol 5 ml
reached 25 ml with distilled H
2O
added 1 tablet of Protease inhibitor cocktail right before use
Table 2.7: Protein extraction buffer
Worms pellets were resuspended in one volume of Extraction buffer (compatible with the Pierce 660nm Protein assay requirements) and homogenised in tubes with zirconia beads (4 cy- cles, 6000 x 2; 20 s) using the Precellys24 Homogenizer with the Cryolys Cooling Unit (Peqlab, Germany). The supernatant containing the proteins was collected after 15 m of centrifugation at 4 ◦ C. The total protein concentration was measured using the Pierce 660nm Protein assay (Thermo Scientific).
2.2.2 In solution digestion
Pellets were re-suspended in 6 M Urea, 2 M Thio-Urea in 10 mM Hepes buffer using a Bioruptor instrument. Clarification of lysate was done by centrifugation (14,000 rpm, 10 m).
Supernatant was collected and proteins were reduced by Dithiothreitol (DTT, 10 mM, room
temperature, 45 m) and alkylated by Iodacetamide (55 mM, room temperature in the dark, 45
m). Lys-C was added at a 1 to 100 (enzyme to substrate) ratio and pre-digestion was performed
for at least 2h at room temperature. Urea concentration was diluted to 2M using 50 mM Ammo-
nium bicarbonate and Trypsin was added at a 1 to 100 ratio. Digestion was performed overnight
at room temperature and was stopped by acidification. Peptides were desalted by C18 Water
Cartridges and 50 g peptides were used for proteome analysis while the remaining peptides
were subjected for phosphopeptide enrichment.
CHAPTER 2. MATERIALS AND METHODS
2.2.3 Phosphopeptide enrichment
Eluted peptides were acidified to 6 % trifluoroacetic acid (TFA) and the final acetonitrile (ACN) concentration was 60 %. In total, 5 extraction steps were performed at a beads-to-peptide ratio of 3:1. In detail, beads were dissolved in 60 % ACN, 6 % TFA, added to peptide mixture, and incubated on a rotating wheel for 20 m at room temperature. This step was repeated five times and fractions were washed in 60 % ACN, 1 % TFA. Beads were transferred on C8 stage tips, pooling the last two fractions, and washed three times with 300 L of 60 % ACN, 1 % TFA.
Then, beads were washed using 40 % ACN, 0.5 % CH3COOH. Phosphorylated peptides were eluted by 3 x 30 µ L of 40 % ACN, 3.75 % NH4OH, dried in a speed vacuum and re-suspended in 2.5 % ACN, 5 % formic acid.
2.2.4 Peptide analysis by liquid chromatography and mass spectrometry
Peptides were eluted from C18 tips with 30 µ L of 0.1 % formic acid in 60 %ACN, con- centrated in a speed vacuum to complete dryness and re-suspended in 10 µ L buffer A (0.1 % formic acid). The liquid chromatography tandem mass spectrometry (LC-MS/MS) equipment consisted out of an EASY nLC 1000 coupled with a nano-spray electroionization source to the quadrupole based QExactive Plus instrument (Thermo Scientific). Peptides were separated on an in-house packed 50 cm column (1.9 m C18 beads, Dr. Maisch) using a binary buffer system:
A) 0.1 % formic acid, and B) 0.1 % formic acid in acetonitrile as described previously [120].
The content of buffer B was raised from 7 % to 23 % within 220 m and followed by an increase
to 45 % within 10 m. Then, the column was washed with 85 % B for 5 m and re-equilibrated
to 5 % B within. Total gradient time was 240 m. A similar gradient shape was applied for
phosphor-proteome analysis but shortened to a total gradient time of 120 m. Eluting peptides
were ionized by an applied voltage of approx. 2.2 kV. MS1 spectra were acquired using a
resolution of 70,000 (at 200 m/z), an Automatic Gain Control (AGC) target of 3e6 and a max-
imum injection time of 20 ms in a scan range of 300-1750 Th. In a data-dependent mode, the
10 most intense peaks were selected for isolation and fragmentation in the higher-energy col-
lisional dissociation (HCD) cell using a normalized collision energy of 25 % and an isolation
window of 2.0 Th for proteome and 1.8 for phosphor-proteome analysis. Dynamic exclusion
was enabled and set to 20 s. The MS/MS scan properties were: 17.500 resolution at 200 m/z,
CHAPTER 2. MATERIALS AND METHODS an AGC target of 5e5 (for phosphor proteome analysis: 1e6) and a maximum injection time of 50 ms. Excellent reproducibility for the proteome dataset (r >0.95 for biological replicates) was determined by the Pearson correlation coefficient (r) (Figure 2.1A). The correlation plot of the phosphoproteome dataset upon each treatment (untreated, UV-treated and starvation) shows how the biological replicates cluster together (Figure 2.1B). The distributions of the individual phosphorylated residues (Ser/Thr/Tyr) (Figure 2.1C) and the number of phospho groups per peptide we detected, were similar to those obtained in previous studies [17, 147].
2.2.5 MaxQuant and bioinformatics
All raw files were subjected to MaxQuant 1.5.2.8 analysis using the implemented Andromeda search engine [42, 40]. Acquired MS/MS spectra were compared to the Uniprot reference pro- teome database of C. elegans. Using the implemented revert-algorithm, we used a false dis- covery rate (FDR) cutoff at the peptide-spectrum-match, protein and modif. site level of 1 %.
For first and main MS/MS searches the peptide mass tolerance was set to 20 and 4.5 ppm,
respectively. Phosphorylation (STY), acetylation at protein N-termini, and oxidation of methio-
nine residues were defined as variable modification, while carbamidomethylation was set as a
fixed modification. The minimal score for modified peptides was 40. Re-Quantify, label-free-
quantification and match-between-runs options were enabled using default settings. BLAST
searches were performed using desktop version 2.2.31 by comparing C. elegans and human
reference proteomes of the Uniprot consortium (downloaded Jan. 2015). BLAST results were
accompanied by E-values and Bitscores, as well as the alignment length. An e-value cutoff of
1E-4 was used. Note that the e-value is highly dependent on the search space and varies be-
tween different databases. Gene Ontology annotations for both species were imported based on
Uniprot entries using Perseus. Heatmaps were done with the statistical programming software
package Rstudio using the ggplots package. Network analysis was performed in Cytoscape
[212, 37] using WormBase (www.wormbase.org) as the reference network. The color gradient
of the nodes indicates the grades of up or down-regulation at the proteome level while the three
different shapes indicate the phosphorylation status of these proteins. Proteomics light label
free quantification data (not SILAC data) from [242] were imported based on the first Uniprot
identifier and correlated to our dataset. Ratios were also calculated based on these values mean-
ing that the calculated ratio might differ from the SILAC based ratio presented in the study. The
CHAPTER 2. MATERIALS AND METHODS
Starvation_01 Starvation_02 Starvation_03 Untreated_01 Untreated_03 Untreated_02 UV_01 UV_03 UV_02 Starvation_01 Starvation_02 Starvation_03 Untreated_01 Untreated_03 Untreated_02 UV_01 UV_03 UV_02 0.9 0.95 1
Value Color Key
Untreated_phospho_01 Untreated_phospho_02 Starvation_phospho_02 Starvation_phospho_01 UV_phospho_01 UV_phospho_02
Untreated_phospho_01 Untreated_phospho_02 Starvation_phospho_02 Starvation_phospho_01
UV_phospho_01 UV_phospho_02 0.7 0.8 0.9 1
Value
Color Key Color Key
(A)
pY pT pS
80,8 % 18,3 % 0,9 %
![Figure 1.1: Chemical structure of UV-induced DNA lesions. The structure and formation of the three major classes of DNA lesions: CPDs, 6-4PPs and DEWs (modified from Rastogi,2010 [191]).](https://thumb-eu.123doks.com/thumbv2/1library_info/3618596.1501726/22.892.203.695.147.860/figure-chemical-structure-induced-structure-formation-modified-rastogi.webp)


![Figure 1.5: IIS and TOR as sensor pathways for nutrients and stress. TOR and IIS pathways incorporate en- en-docrine (insulin and IGFs) and local signals (amino acids) in order to modulate growth and metabolism accordingly (modified from [18])](https://thumb-eu.123doks.com/thumbv2/1library_info/3618596.1501726/31.892.191.695.268.747/pathways-nutrients-pathways-incorporate-modulate-metabolism-accordingly-modified.webp)
![Figure 1.6: Assembly of the C. elegans autophagy machinery. Autophagy-related proteins and protein com- com-plexes are sequentially involved in the assembly of the autophagosome (macroautophagy) (modified from [259]).](https://thumb-eu.123doks.com/thumbv2/1library_info/3618596.1501726/32.892.117.783.526.731/assembly-autophagy-machinery-autophagy-proteins-sequentially-autophagosome-macroautophagy.webp)