About this series...
This series is produced by the Health, Nutrition, and Population Family (HNP) of the World Bank’s Human Development Network. The papers in this series aim to provide a vehicle for publishing preliminary and unpolished results on HNP topics to encourage discussion and debate.
The findings, interpretations, and conclusions expressed in this paper are entirely those of the author(s) and should not be attributed in any manner to the World Bank, to its affiliated organizations or to members of its Board of Executive Directors or the countries they represent.
Citation and the use of material presented in this series should take into account this provisional character. For free copies of papers in this series please contact the individual authors whose name appears on the paper.
Enquiries about the series and submissions should be made directly to the Managing Editor Rama Lakshminarayanan
(rlakshminarayana@worldbank.org) or HNP Advisory Service (healthpop@worldbank.org, tel 202 473-2256, fax 202 522-3234). For more information, see also www.worldbank.org/hnppublications.
THE WORLD BANK
1818 H Street, NW
Washington, DC USA 20433 Telephone: 202 473 1000 Facsimile: 202 477 6391 Internet: www.worldbank.org E-mail: feedback@worldbank.org
India - Private Health Services for the Poor
Policy Note
Ismail Radwan
May 2005
Public Disclosure Authorized Public Disclosure Authorized Public Disclosure Authorized Public Disclosure Authorized
Policy Note
Ismail Radwan
May, 2005
This series is produced by the Health, Nutrition, and Population Family (HNP) of the World Bank’s Human Development Network. The papers in this series aim to provide a vehicle for publishing preliminary and unpolished results on HNP topics to encourage discussion and debate.
The findings, interpretations, and conclusions expressed in this paper are entirely those of the author(s) and should not be attributed in any manner to the World Bank, to its affiliated organizations or to members of its Board of Executive Directors or the countries they represent.
Citation and the use of material presented in this series should take into account this provisional character. For free copies of papers in this series please contact the individual author(s) whose name appears on the paper.
Enquiries about the series and submissions should be made directly to the Managing Editor, Rama Lakshminarayanana (rlakshminarayana@worldbank.org). Submissions should have been previously reviewed and cleared by the sponsoring department, which will bear the cost of publication. No additional reviews will be undertaken after submission. The sponsoring department and author(s) bear full responsibility for the quality of the technical contents and presentation of material in the series.
Since the material will be published as presented, authors should submit an electronic copy in a predefined format (available at www.worldbank.org/hnppublications on the Guide for Authors page). Drafts that do not meet minimum presentational standards may be returned to authors for more work before being accepted.
For information regarding this and other World Bank publications, please contact the HNP Advisory Services at healthpop@worldbank.org (email), 202-473-2256 (telephone), or 202- 522-3234 (fax).
© 2005 The International Bank for Reconstruction and Development / The World Bank 1818 H Street, NW
Washington, DC 20433
All rights reserved.
India - Private Health Services for the Poor A Policy Note
Ismail Radwan
aa
Senior Private Sector Development Specialist, South Asia Region, the World Bank, Washington, USA.
Paper prepared for the State Health Systems Workshop Government of India, New Delhi, India, June 2004
The paper was made possible by funding from
the World Bank and the Department for International Development, U.K.
Abstract: Despite India’s great strides since Independence, fertility, mortality and morbidity remain unacceptably high. Although poverty and low levels of education are the root causes of poor health outcomes, poor stewardship over the health system bears some responsibility.
Although India’s states exhibit a wide variation in health outcomes, all but the best-performing states need to focus on improving both sexual and reproductive health care and child health care and on reducing communicable diseases for the poor. This paper examines the public and private responses to this situation detailing the reasons behind the failure of the public sector and ways in which the private sector can be encouraged to play a role in providing health care for the poor in India. The paper concludes that there are three promising areas for the private sector including; (i) contracting out the primary health centers, (ii) social franchising and (iii) demand-led financing. The study is focused on what to do to improve health care for the poor, while a series of separate background papers focus on how to do it and state specific issues in Andhra Pradesh, Bihar, Karnataka, and Punjab.
Keywords: private sector, health care, social franchising, contracting out, maternal and child health care, India, the poor.
Disclaimer: The findings, interpretations and conclusions expressed in the paper are entirely those of the authors, and do not represent the views of the World Bank, its Executive Directors, or the countries they represent.
Correspondence Details: Ismail Radwan, Senior Private Sector Development Specialist, the World Bank, 1818 H. Street N.W., Washington, D.C. 20433, USA. Tel: +1 202 473 1000, Fax:
+1 202 522 1145, Email: iradwan@worldbank.org, www.worldbank.org.
Acknowledgments ... vii
Preface ... ix
Abbreviations and Acronyms ... xi
1 Introduction to the Health Characteristics of the Poor ... 1
Who Are the Poor? ... 1
What Are the Health Characteristics of the Poor? ... 1
What Are the Implications for Health Service Delivery? ... 4
2 Public Health Care for the Poor ... 7
Public Primary Health Care ... 7
Reasons for Poor Public Sector Performance ... 9
3 Private Health Care for the Poor ... 12
Growth of the Private Sector ... 12
Structure of the Private Sector ... 12
Use of the Private Sector ... 15
Challenges of Increased Private Sector Participation ... 18
4 Financing Options for the Poor ... 20
Total Health Care Spending ... 20
Health Insurance ... 23
Initial Observations on Insurance Market Development ... 36
5 Engaging the Private Sector to Care for the Poor ... 38
Summary of the Challenge ... 38
Successful Case Studies ... 39
Political Economy of Change ... 42
6 Policy Recommendations... 46
Different Solutions for Each State ... 46
Improving Stewardship and Oversight ... 46
Improving Responsiveness ... 47
Improving Quality ... 49
Reducing Costs ... 50
Areas for Further Research ... 52
Geographic Location ... 53
Economic Characteristics ... 53
Gender Inequalities ... 53
Illiteracy ... 54
Scheduled Castes/Scheduled Tribes ... 54
Access to Water and Sanitation ... 54
Alcoholism and Tabacco Use ... 55
Appendix B The Public Primary Health Care System ... 56
Appendix C Rural Medical Providers ... 58
Equipment ... 58
Qualifications ... 58
Medical Practices ... 58
Referrals ... 59
Popularity ... 59
Cost Structure ... 59
Some Suggestions on RMPs ... 60
Appendix D Community-Based Health Insurance ... 61
Appendix E Improving Public Sector Management of Health Facilities ... 63
Improving Primary Health Care ... 63
Improving Secondary Health Care ... 64
References ... 66
This report presents the findings of a World Bank team that visited Karnataka in 2003 and Bihar, Andhra Pradesh, and Punjab in 2004. The team was led by Ismail Radwan (a senior private sector development [PSD] specialist) and included Paolo Belli (a health economist), Chiaki Yamamoto (a PSD specialist), Venkatachalan Selvaraju (a health economist), Juliana Riparip (a consultant), and Kareem Aziz (a consultant). Nina Anand, Maria Espiritu, H. Bhawani, and Ritika Rodrigues provided administrative support. The work was conducted under the general guidance of Charlie Griffin (the director of South Asia human development) and Anabela Abreu (the sector manager for South Asia health). The peer reviewers for this work were April Harding, Robert Taylor, Cristian Baeza, Tonia Marek, and Sarbani Chakraborty.
The team received valuable comments on various drafts of the background papers from Peter Berman, Benjamin Loevinsohn, Stephen Howes, Preeti Kudesia, Peter Heywood, G. N. V.
Ramana, Katherine Tulenko, Catherine Commander O’Farrell, Robert Hecht, and Priya Basu.
The mission team would like to take this opportunity to thank the government officials in all four states visited as well as Delhi for their interest, cooperation, and support throughout the study. They are mentioned by name in the individual state background papers that accompany this report. We hope that this policy note and the accompanying background papers will prove a valuable instrument to further the reform process across India with a view to securing improved health outcomes for India’s poor.
The author is grateful to the World Bank for publishing this report as an HNP Discussion Paper.
The author would also like to recognise the generous funding for this report from the UK
Department for International Development.
Why Are We Doing This Study?
Although India has made great strides since Independence, fertility, mortality, and morbidity remain unacceptably high compared to both countries in the region and those at similar income levels. Almost a third of the Indian population lives in poverty. The effect of poverty on health care—and vice versa—is significant.
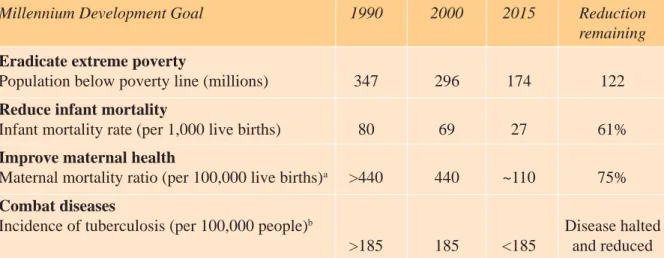
Achieving National Health Targets and the related Millennium Development Goals will entail addressing challenges to the existing health system (see table 1).
Although the root causes of poor health outcomes are poverty and low levels of education, government stewardship of the health sector bears some responsibility. Since Independence, public financing and provision of health care services have been the main foundation of health care policy. Public sector health programs in India have faced well-recognized problems, such as inadequate access by the most vulnerable groups, poor quality and coverage of primary and secondary facilities, and—until recently—excessive focus on sterilization and inadequate focus on maternal and child health.
The private sector has filled this gap. At Independence, the private sector accounted for just 8 percent of health care facilities. That figure had risen to 60 percent by the early 1990s. Evidence is mounting that the private sector provides an increasing share of primary health care and that large segments of the poor use the private sector.
Until recently, governments have not explicitly recognized their responsibility for health policies outside the public sector. To date, private health care institutions in India have, therefore, grown in the absence of an explicit policy to define their role, which has raised questions regarding the quality and legality of care as well as the exploitation of the poor. Recently, the Indian government requested World Bank support in addressing these challenges. This study aims at presenting policymakers with suggestions for addressing this situation.
Table 1. The Millennium Development Goals and How They Relate to India
Millennium Development Goal 1990 2000 2015 Reduction
remaining Eradicate extreme poverty
Population below poverty line (millions) 347 296 174 122
Reduce infant mortality
Infant mortality rate (per 1,000 live births) 80 69 27 61%
Improve maternal health
Maternal mortality ratio (per 100,000 live births)
a>440 440 ~110 75%
Combat diseases
Incidence of tuberculosis (per 100,000 people)
bDisease halted
>185 185 <185 and reduced
a
Modeled estimates, 1990 numbers assumed to be greater than 2000 estimate.
b
Author’s estimates.
Sources: Millennium Development Goal statistics and author’s estimates.
This study seeks to answer the following question:
Given the importance of the private health care financing and provision of services, how can the government of India better use the private sector in delivering health services to the poor?
Within that broad framework, three policy questions are of particular interest to the government of India-
How to increase coverage for the poor, especially for essential health care priorities?
The most important health goals both for the government of India and from the perspective of the poor are assumed to be those captured by the Millennium Development Goals.
1Many states, especially the poorer ones, that have developed their own state health plans have indeed adopted these goals.
How to improve the quality of care for the poor? A significant number of private health care providers in India (especially in the rural areas) are untrained practitioners. Although reliable data on their numbers are difficult to compile, it has been estimated that they number well over 1.25 million. The vast majority of these providers are not registered, qualified, or regulated. Evidence shows that the quality of care they provide is extremely low and can at times actually harm the health status of the patients. The Supreme Court has ruled their operations to be illegal and labeled them “quacks” (Peters and others 2002, 156). This highlights the need for a sensible government policy toward this sector.
How to reduce expenses for the poor? Due to well-known asymmetries of information, the poor are especially vulnerable to exploitative charging practices. Without access to affordable health insurance, they face the largest health care bills as a proportion of their income. Moreover, they face the largest out-of-pocket expenses, which can often lead them into an unsustainable spiral of indebtedness and increasing poverty. Given this situation, how should the government respond?
What Should Be Done?
Within that broader context, this study seeks to provide some suggestions to policymakers on these important questions. This study presents high-level information on the issues at a national level, drawing on examples from various states in India.
How Can It Be Done?
Although this study points to what should be done, more in-depth case studies and manuals have been developed as background papers to this study. They present
State-level assessments of Andhra Pradesh, Bihar, Karnataka, and Punjab. Those states were selected to give an overview of poor, intermediate, and richer states, as well as to feed into current World Bank–supported state health systems projects and other state- level initiatives.
Guides to contracting for primary health care and social franchising.
International case studies on the use of vouchers, health insurance, and self-help groups.
It is hoped that these background documents will provide interested policymakers with concrete suggestions and a guide to how they can be implemented.
1
These goals are reducing child mortality, reducing maternal mortality and improving reproductive health, combating communicable
diseases (especially tuberculosis, malaria, and HIV/AIDS), and eradicating malnutrition.
AIDS Acquired immune deficiency syndrome ANM Auxiliary nurse midwife
BIMARU Bihar, Madhua Pradesh, Rajasthan, and Uttar Pradesh BPL Below poverty line
CBHI Community-based health insurance CHC Community health center
DALY Disability-adjusted life years ESIS Employees State Insurance Scheme GDP Gross domestic product
HIV Human immunodeficiency virus
HMIS Health management information system IMR Infant mortality rate
MDG Millennium Development Goals MMR Maternal mortality rate
MSA Medical savings account
NFHS National Family and Health Survey
NFP Not for profit
NGO Nongovernmental organization NIC National Insurance Corporation PHC Primary health center
PHSC Punjab Health Systems Corporation PHU Primary Health Unit
PSD Private sector development RMP Rural medical provider
SC/ST Scheduled caste/scheduled tribe
SHG Self-help group
TPA Third-party administrator UHC Urban health center
UHIS Universal Health Insurance Scheme
UNDP United Nations Development Programme
2
Appendix A presents a fuller analysis of poverty in India for those not familiar with the country situation.
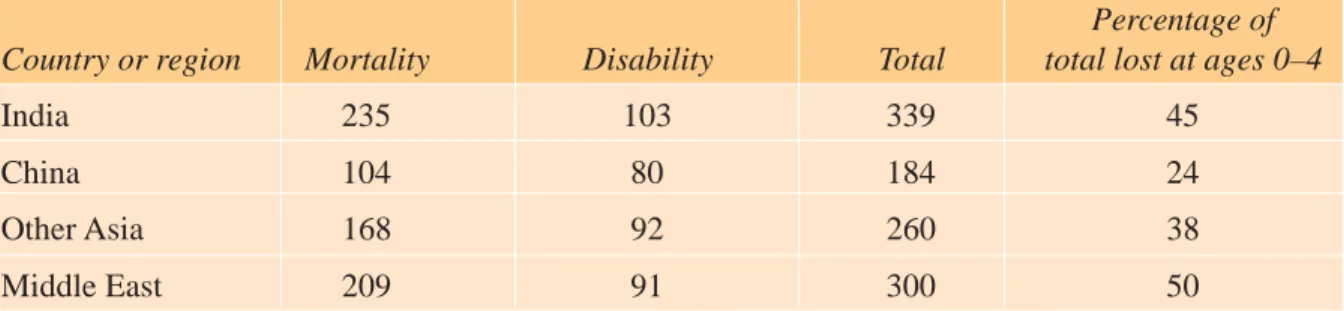
Table 1.1. Burden of Disease: Disability-Adjusted Life Years (DALYs) per Thousand Population Lost to Mortality and Disability
Lost DALYs per 1,000 population
Percentage of Country or region Mortality Disability Total total lost at ages 0–4
India 235 103 339 45
China 104 80 184 24
Other Asia 168 92 260 38
Middle East 209 91 300 50
Sources: Murray and Lopez (1996). Also quoted in World Bank (1999).
1 INTRODUCTION TO THE HEALTH CHARACTERISTICS OF THE POOR
Who Are the Poor?
It is estimated that approximately 29 percent of the Indian population lives below the poverty line (World Bank 2003). This figure accounts for more than 290 million people, or nearly 25 percent of the world’s poor population. Although India has made significant progress in reducing poverty (down from an estimated 36 percent in 1993/94), a considerable challenge remains. To meet the Millennium Development Goals (MDGs), India will need to reduce the number of people living in poverty by an additional 123 million people by 2015.
The poor are concentrated in rural areas in the north, where they are predominantly engaged in agricultural activities. On average, the poor have lower levels of education than the general population and suffer from higher disease prevalence. Women are typically more disadvantaged than men in socioeconomic status. They are less literate and suffer from poor health care and a high rate of maternal mortality. The poor have less access to health facilities than the general population, and they have very low access to clean water and sanitation. Scheduled castes and tribes are overrepresented in below-poverty-line (BPL) households. More than 65 percent of scheduled caste/scheduled tribe (SC/ST) households live below the poverty line.
2The effect of poverty on health care—and vice versa—is significant. Studies have shown that the poor in India are disproportionately affected by disease and have limited access to adequate medical services. High illiteracy rates, limited access to safe water, and poor sanitation all contribute to the terrible state of health in which many of the poor live. Although India has made significant strides toward improving the overall health condition of its people, a substantial unmet demand for basic health services remains.
What Are the Health Characteristics of the Poor?
National Health Status
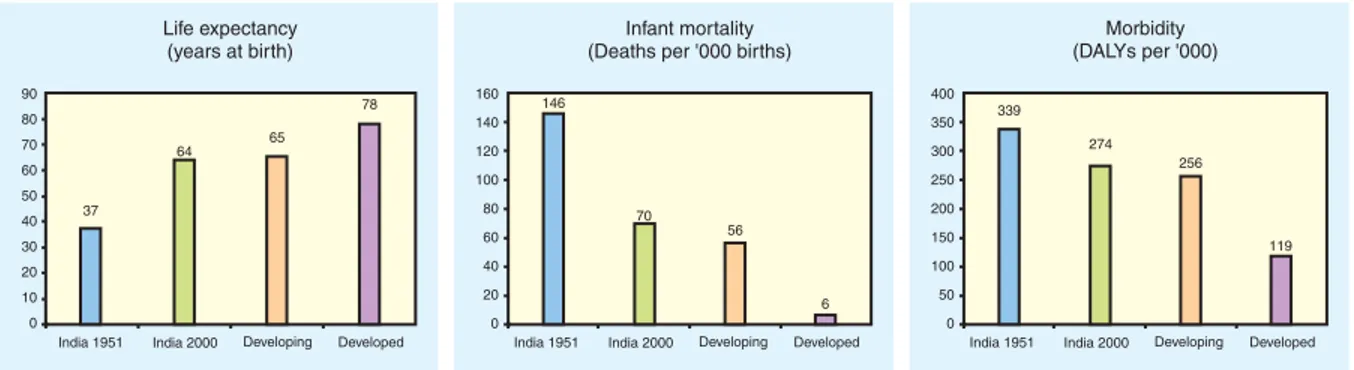
India has made considerable progress in reducing fertility, mortality, and morbidity since
Independence. India’s efforts to generate growth and reduce poverty have been rewarded with
tremendous improvements in key health outcome indicators (see figure 1.1). However, key
health indicators remain unacceptably high compared both with countries in the region and
with those at similar income levels (see table 1.1).
Subnational Health Status
Within India, wide disparities exist in health status among states (see table 1.2). A few states, such as Kerala, Maharastra, and Tamil Nadu, are far above the country average and, in certain cases, close to the averages in industrial countries. Others, such as Bihar, Orissa, and Uttar Pradesh, lag far behind. High incomes and low poverty levels alone cannot secure the best health outcomes. Despite being the richest state and reducing poverty to just 6 percent, Punjab has health indicators that are only a little better than the national averages. This statistic implies that the health system does make a difference and that different states will have to focus on different health priorities.
Table 1.2. Key Health Indicators for India and Selected States
State Income Poverty Infant Maternal Immunization Malnutrition
(Rs per (headcount mortality rate mortality rate (percent of (weight capita for ratio for (per 1,000 (per 100,000 population fully for age)
2001/02) 1999/2000) births) population) immunized)
All India 20,198 26.1 67.6 453 53.3 45.5
Andhra Pradesh 20,112 15.8 65.8 436 59.0 38.6
Bihar 6,006 42.6 72.9 452 11.18 54.3
Karnataka 22,816 20.0 51.5 450 60.0 36.6
Kerala 26,603 12.7 16.3 87 79.7 21.9
Marahastra 29,873 25.0 43.78 336 78.4 39.9
Orissa 11,093 47.2 90 367 44.0 54.1
Punjab 29,973 6.2 57.1 369 72.1 39.2
Tamil Nadu 23,414 21.1 48.2 376 88.8 29.4
Uttar Pradesh 12,038 33.0 82 707 44.0 51.7
West Bengal 20,039 27.0 48.7 389 43.8 41.5
Sources: State gross national product and poverty count: World Bank draft Punjab Economic Report; infant mortality rate:
National Family Health Survey 1998/99; maternal mortality rate: UNICEF (1995).
Figure 1.1 : Health Improvements since Independence
Sources : ICRA Indian Health Care Industry (2003) and McKinsey : Health Care in India.
Major Challenges: Communicable Diseases, Maternity, and Nutrition
India’s states are at different stages of the epidemiological and demographic transition.
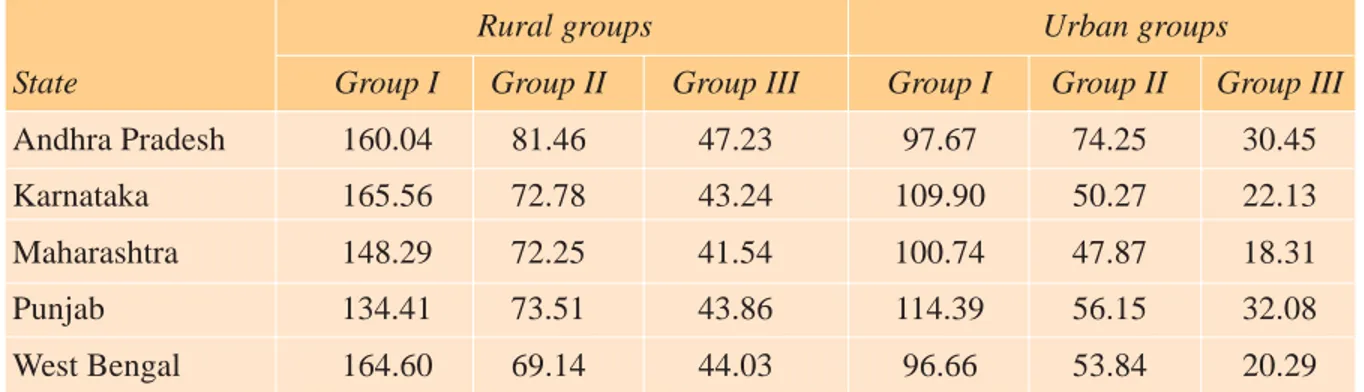
However, a burden-of-disease analysis indicates that all states still need to focus on Group I diseases. Group I diseases include pretransition disorders such as communicable diseases and maternal and perinatal nutritional deficiency. Groups II and III include noncommunicable diseases plus injuries and accidents, respectively. Table 1.3 indicates the relative burden of disease caused by type of disease.
The Need to Improve Maternal and Child Health Care
The highest incidence of lost disability-adjusted life years (DALYs) is among children ages 0 to 4 years who succumb to communicable diseases. Figure 1.2 presents data for Andhra Pradesh but is representative of the whole country. These data argue strongly for increased resource allocation to sexual, reproductive, and child health care; to immunization; and to improved nutrition. Future reforms and initiatives to strengthen the health care system must give priority to those areas and to the primary sector in general.
Table 1.3. DALYs Lost per Thousand Population, by Major Cause Groups in Rural and Urban Areas
Rural groups Urban groups
State Group I Group II Group III Group I Group II Group III
Andhra Pradesh 160.04 81.46 47.23 97.67 74.25 30.45
Karnataka 165.56 72.78 43.24 109.90 50.27 22.13
Maharashtra 148.29 72.25 41.54 100.74 47.87 18.31
Punjab 134.41 73.51 43.86 114.39 56.15 32.08
West Bengal 164.60 69.14 44.03 96.66 53.84 20.29
Source: ASCI (2001).
Figure 1.2 : Distribution of DALYs Lost by Age Group in Andhra Pradesh
Source: ASCI (2001).
India’s Major Diseases
India has a disproportionately higher rate of acute respiratory infections and diarrheal disease per capita than the rest of the world has (table 1.4). Many diseases prevalent in India, such as tuberculosis, diarrhea, and measles, affect the poor more than the nonpoor, and the diseases are preventable with inexpensive and simple interventions. In many states, perinatal mortality causes account for about 20 percent of Group I DALYs; moreover, maternity and related conditions account for 10 percent of Group I DALYs in the female population. Tackling India’s burden of disease will require a focus on primary health care and on efforts to improve maternal and child health care, including an increase in the proportion of children who are immunized and a reduction in communicable diseases. All those areas are targeted by the MDGs. Such improvements will require improvements in the current primary health care system, as well as a strengthening of emergency obstetric care at the secondary and tertiary levels.
Although HIV/AIDS infection rates on a per capita basis in India are below the world average, in some states (such as Andhra Pradesh and Karnataka) the disease has begun to spread beyond the high-risk groups and into the general population. HIV/AIDS infections are concentrated primarily in the urban areas and are not yet a major health concern in rural communities. HIV/
AIDS education, however, is critical to prevent the spread of the disease into those communities.
Studies have shown that HIV/AIDS awareness is very low among poor communities.
What Are the Implications for Health Service Delivery?
The Need to Focus on Primary Health Care
Given the situation described in the previous section, the primary health care system will clearly play the most important role in reducing the burden of disease through prevention, promotion, Table 1.4. Top 10 Specific Causes of Lost DALYs in India, 1998
Causes of lost Number of lost Percentage of India’s percentage of the DALYs DALYs all causes world lost DALYs
Acute lower respiratory infections 24,806 9.2 30.1
Diarrheal disease 22,005 8.2 30.1
Ischemic heart disease 11,697 4.3 22.5
Falls (injuries) 10,898 4.1 40.3
Unipolar major depression 9,679 3.6 16.6
Tuberculosis 7,577 2.8 26.9
Road traffic injuries 7,204 2.7 18.5
Measles 6,474 2.4 21.4
Anemia 6,302 2.3 25.5
Fire-related injuries 5,723 2.1 47.8
All causes 268,953 100.0 19.5
Population (thousands) 982,223 100.0 16.7
Source: WHO (1999).
and curative services, as appropriate. It is important that the primary health care system function efficiently, providing all children with all vaccines, providing all pregnant women with a full program of antenatal care and a location for safe institutional delivery, and meeting the demand for family planning services. The primary health care system should also provide a first port of call for the sick and an effective referral system. Within primary health care, governments should focus on sexual, reproductive, and child health. A sound and functioning primary system would then need to be supported with improved emergency obstetric care available at the secondary and tertiary levels.
The Need to Focus on Nutrition and Sexual, Reproductive, and Child Health
Providing health care for the poor means focusing on areas that most strongly affect the poor. Coverage levels diverge widely between the richest and poorest segments of society with respect to key interventions, such as antenatal care provision, contraceptive prevalence, and institutional deliveries. The poorest population quintile has fertility rates of 4.1 children per woman, and the richest quintile has fertility rates of 2.1 (World Bank 2003). Increased fertility only increases the level of poverty caused by the increased financial burdens that accompany larger family sizes.
Almost half the poor children in India are not immunized at all (World Bank 2002, p. 53).
This statistic stands in stark contrast to the wealthiest segment, in which less than 8 percent of children were not immunized (see table 1.5). The BIMARU region (consisting of Bihar, Madhya Pradesh, Rajasthan, and Uttar Pradesh) has the lowest rates of immunization in the country. Tuberculosis and measles—diseases that can be easily prevented provided that the adequate immunization is administered—are among the top 10 causes of lost DALYs in India (see table 1.4).
Almost half of Indian children suffer from some form of malnutrition, and diseases and symptoms resulting from malnutrition, such as stunting and wasting, are prevalent in the rural communities, especially in poorer areas. Malnutrition is a key risk factor for many childhood illnesses and affects the health status of the poorest women. Interventions to improve nutritional outcomes are vital in tackling the burden of disease and achieving the MDGs.
Table 1.5. Comparison of Health Status of Children in India (percent)
Condition Poorest Wealthiest
quintile 2nd quintile 3rd quintile 4th quintile quintile Total
Malnutrition
a55.6 54.0 48.6 43.4 30.9 47.1
No immunization 48.4 40.8 27.5 18.0 7.9 30.0
All immunizations 17.1 21.7 34.7 48.2 65.0 35.4
a
As measured by stunting versus height for age.
Source: World Bank (2002, p. 53).
3
For more practical information on this topic, see Garcia-Abreu and others (2002).
The Need for Public Health Surveillance
Given the high rate of communicable disease and the low rate of immunizations, the health
system will need to provide for a large number of people suffering from tuberculosis, acute
respiratory infections, measles, malaria, leprosy, and other common ailments, as well as
HIV/AIDS. Such care and treatment require establishing an effective public health
surveillance system, systematically collecting and analyzing timely and accurate health
data, disseminating those results, and developing action plans to combat disease. Such a
system will also monitor the effectiveness of disease control programs. Because many
infected patients approach private facilities first, close links must be formed and information-
sharing channels opened with the private sector and even informal providers (see later
chapters), especially to combat outbreaks of infectious diseases.
3Such a system does not
currently exist in most states.
4
A fuller picture of the primary health care system is presented in appendix B, using Karnataka as a case study.
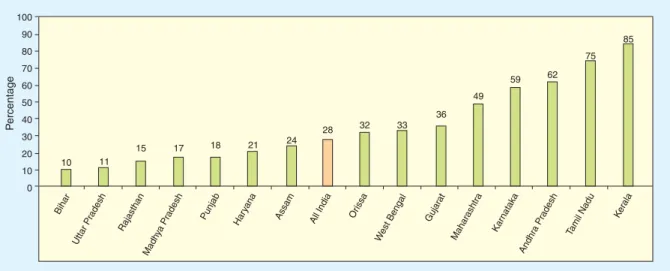
Figure 2.1 : Percentage of Population Receiving Full Antenatal Care
Source: National Family Health Survey-2 (1998/99).
2 PUBLIC HEALTH CARE FOR THE POOR
Public Primary Health Care
India’s primary health care system is based on the primary health center (PHC) and its attached subcenters. Each PHC is targeted to cover a population of 30,000 (or 20,000 in remote or rural areas). The PHCs are hubs for five or six subcenters that each cover three or four villages.
PHCs are operated by an auxiliary nurse midwife (ANM). They act as referral centers for the community health centers (CHCs), 30-bed hospitals, and higher-order public hospitals such as the taluka or district-level hospitals.
4The PHC is charged with providing promotive, preventive, curative and rehabilitative care. Thus, it should offer a wide range of services, such as health education, nutrition promotion, basic sanitation, mother and child family welfare services, immunization, disease control, and appropriate treatment for illness and injury. Unfortunately, PHCs are not currently fulfilling all these functions, many of which have a strong component serving the public good.
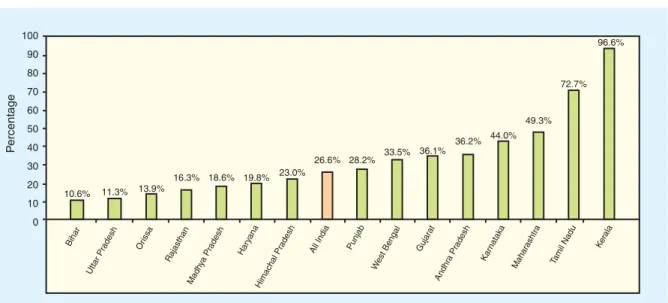
Although state governments throughout India are focused on reducing the infant mortality rate
(IMR), maternal mortality rate (MMR), and communicable diseases, public health systems in
only a few states have been able to meet this challenge. Figures 2.1 and 2.2 illustrate that even
with support from the private sector, less than half the children are fully immunized and less
than one-third of deliveries are institutional, which, in turn, contributes to high levels of disease
and maternal and infant mortality. As the figures illustrate, there is large variation among the
states. Unfortunately, the most populous states happen to be the poorest and are unable to reach
even a quarter of the target population.
Moreover, the public sector is not good at reaching the poor or those in remote areas.
A recent assessment (Mahal and others 2001) of the public subsidy to the health sector has shown that the poorest 20 percent of the population captures only 10 percent of the subsidy, less than a third of that captured by the richest 20 percent (see figure 2.3).
Figure 2.3 : Distribution of Public Expenditures in India on Curative Care, 1995-96
Source: NCAER (2000).
Figure 2.2 : Institutional Deliveries (percent per 1,000 live births)
Source: Mahal and others (2001).
Empirical studies have also shown that the quality of primary public services provided by the public sector did not improve significantly between 1987 and 1996. Moreover, income, education, and the overall quality of state administration are more important than specific public health interventions in explaining differences in demographic and health indicators during the period from 1981 to 1991.
Reasons for Poor Public Sector Performance
Although many reasons for poor public performance exist, almost all of them stem from weak stewardship of the sector. Three basic issues are highlighted here that together produce a poor incentive framework. Each of the following areas is discussed in detail:
1. A bureaucratic approach to health care provision
2. Lack of accountability and responsiveness to the general public 3. Incongruence between available funding and commitments A Bureaucratic Approach
State governments approach the provision of health care from a bureaucratic paradigm, with the following results:
A rigid PHC structure. The PHC structure is the same for every area and, therefore, unable to respond effectively to local realities and needs. PHCs exhibit very little differentiation despite serving markedly different populations and circumstances. For instance, the number of ANMs per PHC is the same throughout the country, even though some states have twice the fertility level as others. Rather than responding to local needs, public health officials are focused on and limited by the requirement to fill sanctioned posts. Moreover, political interference in the location of health facilities often results in an irrational distribution of PHCs and their subcenters.
A focus on inputs rather than outputs. Government health departments are focused on implementing government norms, paying salaries, and ensuring that minimum facilities are available rather than on measuring health system performance or health outcomes.
This focus results in a supply-driven approach. For instance, despite being completely underused, each PHC still has six beds.
Lack of public health management capacity. In general, the public health care system is managed and overseen by the district health officers. Although they are qualified doctors, they have little or no training in public health management and are transferred frequently.
Moreover, even if they had the training, they do not have the flexibility to reallocate financial capital and human resources to achieve better outcomes. Strengthening the capacity for public health management at the district and taluk level is crucial to improving public sector performance and nurturing partnerships with the private sector.
Vacancies in PHC posts for long periods. A field visit to a PHC in Nelamangala Taluka
(in Karnataka) revealed a sanctioned post complement of 25, of which only 18 positions
were filled. Budgetary figures indicate that, on average, 25 percent of sanctioned PHC
posts in Karnataka are unfilled. It is not clear whether this high percentage of vacancies
is a deliberate strategy to reduce the budgetary burden or simply a result of administrative
inefficiencies. Moreover, when posts are filled, doctors are often absent (as discussed later in this chapter).
Lack of Accountability
The lack of accountability and responsiveness stems from the lack of a formal feedback mechanism, exacerbated by no tradition of and no incentive to treat citizens as clients. In every state visited, patients complain about rude or abrupt health workers who discriminate against women and minorities from scheduled castes or tribes and the poor in general. Patients understand that the incentives within the public sector cannot stimulate performance: “Anyhow they will get their money, so they don’t pay much attention,” says a patient in Andhra Pradesh (Probe Qualitative Research 2003a). As another patient remarks in Mumbai, “The same government doctor who was not easily or conveniently accessible, whose medication was not satisfactory, and whose manner was brusque and indifferent transformed into a perfectly nice and capable doctor when he was seeing a patient in his private practice” (Probe Qualitative Research 2003b).
In general, the lack of accountability results in the following service deficiencies:
Absentee doctors. It is difficult for the public sector to attract qualified doctors to the rural areas. Although in theory medical officers are required to be present at the practice, many medical officers visit the PHC infrequently, preferring to operate parallel private clinics in urban areas or to operate private practices from their residences after hours. A recent study has estimated that countrywide absenteeism rates in India are 43 percent in the public health sector (Chaudhury and others 2003). When doctors are present, their poor behavior discourages patients from approaching the PHC for health care.
Unresponsive ANMs. In Karnataka, dais
5attend as many deliveries as ANMs, about 12 percent of total births. Villagers complain that ANMs are not available for deliveries at night, even if the mother is willing to come to the PHC. In addition, nearly a third of women who had planned to have an ANM assist at their deliveries finally had a dai or an experienced relative in attendance because the ANM was either unavailable or unwilling to attend if women went into labor at night.
Inconvenient opening times. PHCs are very underused by outpatients for the reasons outlined in this section. The situation with respect to inpatients is even worse because PHCs have limited opening hours and no one is available to attend to the patients in the evenings or during the weekends.
Informal payments. Although not officially sanctioned, most PHCs require patients to make small, informal payments before receiving treatment. After the costs of transportation and time taken to get to the PHC are factored in, this additional payment often makes the cost of public sector health care more expensive than low-cost private providers.
Little or no community participation. The community is not involved in the operation of the PHC. In theory, the PHC is monitored by the Panchayati Raj system through a community health committee; however, in practice, villagers complain that they do not who is on the committee, resulting in a situation in which the PHC is not responsive to local needs such as opening times, range of services, and customer satisfaction.
5 Dais are informal midwives who operate in the rural areas. They have no formal training; the job is hereditary and passed down within
certain lower castes.
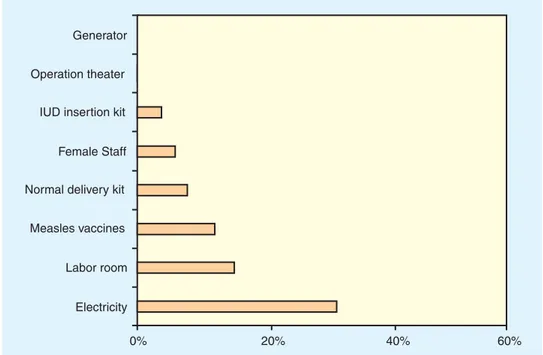
Incongruent Budgets and Commitments
The lack of resources, which in some states is acute, is certainly a contributing factor to the poor performance of the primary health care system (see figure 2.4). In poor states, spending levels are extremely low, yet expectations for coverage remain high. This incongruence is a key factor in explaining poor use of public spending. Government officials are quick to blame inadequate budgetary provision for the breakdown in the system, however, without examining how government could improve its efficiency using current resources. The incongruence between resources and targets results in the following problem areas:
Lack of medicines. The current annual budget for essential drugs at a PHC of Rs 75,000 is inadequate to ensure that sufficient drugs are available, especially if the PHC is staffed with dedicated health workers and able to attract a large number of patients.
Limited doctor salaries. Low salaries are an obstacle to attracting qualified doctors to rural areas, especially given the high costs that many students will pay for their medical training.
Poor condition of PHC infrastructure. When government budgets are under extreme pressure, the first area that is usually identified for cutbacks is the maintenance budget.
PHCs across India are poorly maintained and are supplied only sporadically with electricity. Vehicles quickly fall into disrepair because spare parts are not forthcoming, and the process required to replace the simplest parts is so convoluted that even a flat tire can put a car out of action for more than a year. This situation deters patients from seeking care there. Within such a context, it is important to focus on system reforms before considering any potential budget increases.
Figure 2.4 : Equipment and Facilities Available at PHCs in Bihar State
Source: National Family Health Survey-2 1998/99
6
For the purposes of this study, the private sector is defined as all nongovernmental health care, including NGOs, for-profit and not-for profit institutions, private clinics and nursing homes, informal rural medical practitioners (whether registered or not), and donor-funded project facilities.
Figure 3.1 : The Private Sector Captures Increasing Market Share from the Public Sector
Source: National Family Health Survey 1998/99; National Sample Survey 1995/96; and KPMG (2003).
3 PRIVATE HEALTH CARE FOR THE POOR
Growth of the Private Sector
At Independence, less than 8 percent of all medical institutions in the country were maintained by wholly private agencies (Bhore Committee 1946). By the early 1990s, this figure had reached close to 60 percent, and there are indications that it increased even further during the past decade. In large part, the private sector has emerged in response to the current health care situation as outlined in chapters 1 and 2.
6The decade to 1996 witnessed a steep decline in the market share of public health services (see figure 3.1).
The proportion of patients seeking ambulatory care in the public sector fell from 32 percent to 26 percent in rural areas and from 30 percent to 17 percent in urban areas.
Similarly, by 1996 the private sector accounted for 54 percent of rural hospitalization and 70 percent of urban hospitalization (National Sample Survey 1995/96). Strong evidence exists that such official statistics grossly underestimate the size of the private sector. Facility surveys in various states have recently estimated that the private sector includes as much as 93 percent of all hospitals and 64 percent of all beds nationwide (World Bank 2001). This remarkable growth in private sector health services has occurred largely by accident as the private sector has stepped in to meet needs that the public sector could not address.
Structure of the Private Sector
The private sector is a broad group that includes for-profit and not-for-profit providers,
nongovernmental organizations (NGOs), missionary hospitals, private pharmacies, and blood
banks plus unqualified informal providers, some of whom are registered and others who are
not. For the purposes of this study, it is useful to divide private sector providers into the following
three major groups, each of which is discussed in more detail:
1. Rural medical providers (RMPs)
72. Not-for-profit (NFP) sector, including NGOs and religious-based facilities 3. Corporate, or for-profit, sector
Rural Medical Providers
RMPs are unqualified medical practitioners. They operate on a for-profit basis, offering mainly curative services in the rural and semiurban areas. The vast majority are male solo practitioners in outpatient settings. A study in Punjab revealed that less than 1 percent of RMPs had inpatient beds. Responding to demand, the vast majority offer allopathic medicine, even though some RMPs are qualified in Indian systems of medicine. The majority (87 percent) are educated to the high school level. Those who have more education or training tend to operate in or around urban areas. Estimates of the number of informal providers nationwide vary widely from 500,000 (based on surveys in Andhra Pradesh and Utter Pradesh) to 1.27 million (assuming that that each village has, on average, two such informal providers).
8Each RMP sees 20–50 patients per day and receives anywhere between Rs 10 and Rs 50 per consultation, depending on the ailment and the state in which the RMP operates. Higher consultation fees are charged in richer states. Despite their lack of knowledge and frequent involvement in potentially harmful practices, RMPs continue to hold the public’s trust and earn a comfortable living from consultation fees and commissions for referrals to local private hospitals.
In the absence of regulation, such providers have been allowed to prosper, especially in rural areas, where they are often the only form of easily accessible care. Adapting flexibly to demand, some RMPs are peripatetic, visiting two or more villages during the week. Villagers stated that the reasons they used RMPs included that the practice is open at convenient times (usually 8:00 a.m.–1:00 p.m. and 6:00 p.m.–10:00 p.m.). Practices where the RMP lives on the premises are open at all hours. Moreover, RMPs are prepared to make house calls on elderly or incapacitated patients and often have a good standing within the community. They uniformly treat patients with kindness and respect. Another attractive feature is that RMPs will provide service on credit to those who cannot afford to pay immediately.
Not-for-Profit Sector
Although the NGO sector—and the NFP sector more broadly—is widely discussed in India, it provides a tiny proportion of health care services. In most states, the share of the NFP sector is less than 1 percent. NGOs, especially those funded internationally, tend to be more active in poorer states, whereas locally based religious organizations are able to attract more funding in richer states.
The NFP sector tends to mirror the facilities provided in the for-profit sector. However, NFP services are clustered in charitable clinics and larger hospitals. The small nursing home sector that characterizes the for-profit sector is almost entirely absent from the NFP sector.
7
More detailed information on RMPs is presented in appendix C.
8