DELIVERING BETTER HEALTH SERVICES TO PAKISTAN’S POOR
April, 2010.
Public Disclosure AuthorizedPublic Disclosure AuthorizedPublic Disclosure AuthorizedPublic Disclosure Authorized
68258
Page ii
ABBREVIATIONS AND ACRONYMS
ADP Annual Development Program
AIDS Acquired immunodeficiency syndrome
AJK Azad Jammu and Kashmir
BHU Basic health unit
BCC Behavior change communication
BHC Basic health center
BHU Basic health unit
BISP Benazir income support program
CAD Coronary Artery Disease
CCT Conditional cash transfer
CIDA Canadian International Development Agency
CIET Tropical Disease Research Centre (or Centro de
Investigación de Enfermedades Tropicales)
CPR Contraceptive Prevalence Rate
DALY Disability-adjusted life years
DfID Department for International Development
DG District government
DHDC District Health Development Center
DHIS District Health Information System
DHO District health officer
DHQ District headquarters
DHS Demographic and Health Survey
DOH Department of Health
DOTS Directly Observed Treatment, Short course
DPT Diphtheria, Pertussis, and Tetanus
EDO Executive District Officer
EDO(H) Executive District Officer (health)
EmOC Emergency obstetric care
ESW Eunuch sex worker
FANA Federally Administered Northern Areas
FATA Federally Administered Tribal Areas
FSW Female sex worker
GDP Gross Domestic Product
GOP Government of Pakistan
GTZ German Technical Cooperation (or Gesellschaft
für Technische Zusammenarbeit)
HIES Household-Integrated Economic Survey
HIV Human Immunodeficiency Virus
HMIS Health Management Information System
HNP Health, Nutrition, and Population
HR Human resources
IDU Injecting drug user
IMCI Integrated Management of Childhood Illnesses
IMR Infant mortality rate
Page iii
LGO Local government ordinance
LHS Lady Health Supervisors
LHV Lady health visitor
LHW Lady health worker
MDG Millennium Development Goal
M&E Monitoring and evaluation
MMR Maternal mortality ratio
MNCH Maternal neonatal and child health
MOH Ministry of Health
MSW Male sex worker
NCD Non-communicable disease
NID National Immunization Day
NHA National Health Account
NHSP National Health Survey of Pakistan
NGO Non-governmental organization
NNS National Nutrition Survey
NSPS National Social Protection Strategy
NTP National Tuberculosis Program
NWFP North Western Frontier Province
OPD Outpatient department
PDS Pakistan demographic survey
PFFPS Pakistan fertility and family planning survey
PG Provincial government
PHC Primary health care
PHDC Provincial Health Development Center
PDHS Pakistan Demographic and Health Survey
PIHS Pakistan Integrated Household Survey
PPHI People’s Primary Healthcare Initiative
PRHFPS Pakistan Reproductive Health and Family
Planning Survey
PSDP Public Sector Development Program
PSES Pakistan Socio-Economic Survey
PSLSM Pakistan Social and Living Standards
Measurement Survey
RHC Rural Health Center
RSP Rural Support Program
RYK Rahim Yar Khan
SAP Social Action Program
SIA Supplementary Immunization Activities
SIUT Sindh Institute of Urology and Transplantation
SNID Sub-National Immunization Day
TB Tuberculosis
TBA Traditional birth attendants
TFR Total fertility rate
U5MR Under-five mortality rate
USAID United States Agency for International
Page iv
Development
WDI World Development Indicators
WHO World Health Organization
Page v
TABLE OF CONTENTS
ABBREVIATIONS AND ACRONYMS ... ii
ACKNOWLEDGMENTS ... viii
EXECUTIVE SUMMARY ... ix
Introduction ... 14
Chapter 1. Health Status in Pakistan ... 16
1.1 Infant and Child Mortality... 16
1.2 Child Nutritional Status ... 22
1.3 Maternal Mortality ... 26
1.4 Fertility ... 28
1.5 Generating a Demographic Dividend and Capturing the Benefits ... 31
1.6 Burden of Disease ... 35
Chapter 2. Performance of the Public Health Service ... 39
2.1 Utilization and Coverage of Key Health Services ... 39
2.2 Utilization, Economic Status and Region ... 42
2.3 Choice of Health Service Provider ... 45
2.4 Why Private Providers? Performance of Public Providers ... 47
Chapter 3. National Programs: Impact and future direction ... 50
3.1 Introduction ... 50
3.2 National Polio Eradication Program. ... 50
3.2.1 Operational management ... 50
3.2.2 Coverage ... 51
3.2.3 Monitoring and Evaluation System ... 51
3.2.4 Impacts on the system ... 51
3.2.5 Future directions ... 52
3.3 National Tuberculosis Control Program ... 53
3.3.1 Operational management ... 53
3.3.2 Coverage ... 53
3.3.3 Monitoring and Evaluation System ... 53
3.3.4 Impacts on the system ... 53
3.3.5 Future directions ... 54
3.4 National Lady Health Worker Program ... 54
3.4.1 Operational management ... 54
3.4.2 Coverage ... 55
3.4.3 Monitoring and Evaluation System ... 56
3.4.4 Impacts on the system ... 57
3.4.5 Future directions ... 57
3.5 Conclusion ... 58
Chapter 4. Health Financing in Pakistan ... 59
Page vi
4.1 Total Health Expenditure ... 59
4.2 Public-Private Mix ... 61
4.3 Public Health Expenditure in Pakistan ... 63
4.3.1 Level and Trend ... 63
4.3.2 Sources of Public Financing ... 66
4.4 Private Health Expenditure ... 67
4.5 Organization of Government Spending and Allocation Responsibilities ... 71
4.5.1 Description ... 71
4.5.2 Issues ... 72
4.6 Purchasing and Resource Allocation in the Public Sector ... 74
4.7 Performance of Public Health Financing ... 75
Chapter 5. Organization and Management of the Public Health System in Pakistan ... 79
5.1 The Evolution of the Health Sector’s Organization and Management ... 79
5.1.1 Emphasis on Public Sector Delivery... 79
5.1.2 Organizational Structure of the Public Health System: ... 82
5.2 Application of Key Stewardship Functions ... 86
5.2.1 Setting Policy and Strategic Direction ... 86
5.2.2 Monitoring and Evaluation ... 87
5.2.3 Setting Standards, Regulating, and Accrediting the Public and Private Sectors 89 5.2.4 Managing Human Resources ... 89
Chapter 6. Concluding Remarks ... 92
6.1 General ... 92
6.2 Specific Options ... 95
6.2.1 Options for Improving Health Status ... 95
6.2.2 Options for Increasing Protection Against the Impoverishing Impact of Ill Health. 97 6.2.3 Options to Support the Organization and Management of the System ... 99
Tables Table 1.1. Infant Mortality Rate (per 1,000 live births) ... 17
Table 1.2. Under-Five Mortality Rate (per 1,000 live births) ... 17
Table 1.3. Summary of Micronutrient Deficiency Prevalence Rates (percent) ... 24
Table 1.4. Maternal Mortality Ratios from Different Studies in Pakistan ... 27
Table 1.5. Proportion of Birth Assistance by Type of Provider ... 28
Table 1.6. Healthy Life Years (HeaLYs) Lost Due to Cause-Specific Mortality... 36
Table 1.7. HIV Prevalence among High-Risk Groups (Various Studies 2004-2006) ... 37
Table 1.8. Prevalence of Risk Factors for CAD/Stroke ... 38
Table 2.1. Trends in Coverage & Access of Key Health Indicators ... 39
Table 2.2. Child and Maternal Health Indicators by Expenditure Quintiles and Residence ... 43
Table 2.3. Inter-district Variation in Key Indicators... 45
Table 2.4. Cost of a Case of Fever in Facilities ... 47
Table 5.1. Different Levels of Government and Their Roles/Responsibilities ... 85
Boxes
Page vii
Box 4.1: Health Spending in Pakistan ... 62
Box 4.2: Fragmentation of budgetary decisions ... 73
Box 4.3: Building upon successful philanthropic activities in the health sector. ... 77
Figures Figure 1.1. Infant Mortality Rate ... 16
Figure 1.2. Under-Five Mortality Rate ... 16
Figure 1.3. Under-5 Mortality Rates for the Poorest Income Quintile and the Whole Population, 1990 to 2006-07 ... 18
Figure 1.4. Progress on Reducing U5MR Compared to the MDG4 Target (1990 = 100) ... 19
Figure 1.5. Projections of U5MR and IMR to 2015 Compared to the MDG Targets (Based on PDHS Data) ... 19
Figure 1.6. The Composition of Under-5 Mortality ... 20
Figure 1.7. Prevalence of Malnutrition (moderate and severe under-weight) ... 23
Figure 1.8. Malnutrition Prevalence by Gender – National Nutrition Survey 2001-02 .. 24
Figure 1.9. Projected Child Underweight Rate to 2015. Under Different Intervention Scenarios (cumulative effect of each additional intervention) ... 25
Figure 1.10. Skilled Birth Attendance (percent) Across South Asia ... 28
Figure 1.11. Total Fertility Rate (children per woman) 1990 - 2005 ... 29
Figure 1.12. Contraceptive Prevalence Rate (all methods, percent) Over Time in Pakistan ... 29
Figure 1.13. CPR (all methods, percent) in South Asia ... 30
Figure 1.14. Abortion Rate (per 1,000 women) and Unmet Need ... 30
Figure 1.15. Regional Comparisons of Total Fertility Rate Forecasts ... 32
Figure 1.16. Dependency Ratios (dependents per working-age person) 2005 ... 33
Figure 1.17. Regional Comparisons of Dependency Ratio Forecasts ... 33
Figure 1.18. Burden of Disease based on Disability Adjusted Life Years (DALYs) Lost and Healthy Life Years (HeaLYs) Lost ... 35
Figure 1.19. Top Ten Causes of Death and Years of Life Lost in 2002 in Pakistan ... 36
Figure 2.1. Regional Comparisons of Contraceptive Prevalence ... 41
Figure 2.2. Regional Comparisons of Immunization Rates ... 41
Figure 2.3. Regional Comparisons in Reproductive Health Indicators ... 42
Figure 2.4. Immunization by Province (rural) ... 44
Figure 2.5. Selected Indicators by Province ... 44
Figure 2.6. Coverage of Selected Health Service by Public and Private Providers ... 46
Annex 1: The Proximate Determinants of Fertility ... 101
Annex 2: District Ranking of Key Health Indicators ... 102
Page viii
ACKNOWLEDGMENTS
A number of new developments have occurred in Pakistan since work on the report began. The report has taken these developments into account and attempts to provide options for addressing the challenges the sector is currently facing.
The team would like to thank officials of the Government of Pakistan and in particular the Ministry of Health for their support during the preparation of the report.
The report was prepared by a team including Tekabe Belay (Team Leader), Agnes
Couffinhal, Inaam Haq, Shahnaz Kazi, and Benjamin Loevinsohn. The team would like
to thank Julie McLaughlin for her support and guidance; Kees Kostermans for extensive
comments on the draft; Sameen Siddiqui, Zulfiquar Bhutta and Pablo Gottret for
reviewing the report and providing critical commentary; Luc Laviolette for comments on
nutrition section of the report; Silvia Albert for formatting the document and Amna Mir
and Nasreen Kazmi for administrative support. The team would also like to acknowledge
the contributions of Fouzia Rehman, Tayyeb Masud, Arjuman Faisal for their work on
background papers; and Brandon Fenley, Shanaz Khan and Ayesha Ahmad for the
assistance in data analysis and literature review. DfID provided financial support for the
background studies used in the review.
Page ix
EXECUTIVE SUMMARY
Pakistan is not on track to achieve most Millennium Development Goals (MDGs) related to health, nutrition and population. Given its current rate of progress, in 2015 Pakistan’s infant mortality rate (IMR) will be 65 deaths per 1,000 live births and the under-five mortality rate (U5MR) will be 78, considerably above the MDG4 targets of 33 and 43 deaths per 1000 births respectively. Pakistan will not achieve the MDG related to nutrition. Childhood malnutrition in Pakistan is higher than in sub-Saharan Africa, and the rate of decline is significantly slower than in the rest of South Asia. In addition, Pakistan’s fertility rate currently at 4.1, although declining, is higher than its neighbors’
and predicted to remain so. While there has been some progress on improving health outcomes, the rate of progress is much slower and the poor, in particular, are being left behind.
Though on the decline, child mortality is still high. Currently, the IMR and the U5MR stand at 78 and 94 deaths per 1,000 live births, respectively. Comparing the levels with 2001-02, this implies that almost 1 in every 10 children born in Pakistan between 2001- 02 and 2006-07 died before reaching five years of age.
Despite a decline among the general population, under-five mortality among the poorest has made no improvements in the last 15 years. The 1990 and 2006 Pakistan Demographic and Health Surveys indicate that the poorest income quintile has seen almost no change in its U5MR. This is despite a decline in under-five mortality among the general population.
Maternal mortality appears to be declining, but remains high. The rate of institutional delivery, often used as a proxy for the maternal mortality rate, has increased, mainly due to increased use of private sector facilities. Still women in Pakistan run a 1 in 80 chance of dying of maternal causes during their reproductive life.
Pakistan lags behind its neighbors in immunization coverage and contraceptive prevalence rate. Results from Demographic and Health Surveys conducted between 2005 and 2007 show that India and Pakistan are lagging their neighbors in terms of vaccination coverage. It is also not clear whether Pakistan is actually making progress in immunizing its children, and there is a debate on whether the decline seen recently is real.
The contraceptive prevalence for Pakistan is only 22 percent, less than half that of other South Asian countries.
Pakistan has the potential to generate a demographic dividend by supporting
fertility decline with sound polices. To materialize this potential, Pakistan has to focus
on rural areas where the decline in fertility has been slow. Such efforts are required to
realize a general decline in fertility, and will results in an increase in the share of the
working age population and the labor force. This generates the first pillar of the
demographic dividend, which has to be supported by sound policies to ensure the health
status and capacities of the increased potential labor force.
Page x
The gap between the poor and the wealthy and geographic differences in access to health, nutrition, and population (HNP) services remain large. The gap in access to services between the poorest income quintile and the wealthiest does not appear to be narrowing. There are also large rural-urban differences in access that are not explained by poverty differentials alone. Similarly, there are large geographical variations in coverage of services. Even within a province, average coverage rates hide very large variations between districts. For example, in Baluchistan immunization coverage between the best and the worst performing districts differs by 69 percentage points.
The quality of care in public facilities is low, resulting in low utilization of public health facilities. Recent health facility surveys in Baluchistan and Sindh indicate that many health workers do not show up regularly to work. In Baluchistan, the absentee rate for all staff was 50 percent, while for doctors it was 58 percent and for female paramedics, 63 percent. The situation was similar in Sindh where 45 percent of the doctors were absent from basic health units (BHUs) and 56 percent were absent from rural health centers (RHCs). These facilities were also poorly equipped and lacked drugs.
A 2006 study found that only 46 percent of first level health care facilities had a water supply and only 33 percent had toilets. Only half of the BHUs and RHCs in Sindh had the equipment necessary to carry out proper deliveries. In Baluchistan, contraceptives were available in only 15 percent of BHUs while in Sindh antibiotics were available in only 12 percent of RHCs and 22 percent of BHUs. Oral rehydration salts were available in only one-third of the BHUs and RHCs. As a result, utilization of the public sector, even by the poor, is low; only 25 percent seek care in public facilities.
A large part of total spending in health comes from out-of-pocket payments, which drive about 4 percent of the population into poverty every year. Public spending on health represents only a quarter of total expenditure. The largest share of the rest is out- of-pocket payments made by patients at the time of service utilization. Out-of-pocket payments remain large even for those using public facilities. In addition to the income loss associated with being unable to work due to illness, medical costs by themselves can push households into poverty.
Providing protection against the impoverishing impact of ill-health is urgent but
requires careful consideration. Designing the mechanism and the benefit package needs
to take into account a number of factors. The first consideration is who will be covered,
and the number and mix of health service providers in the market. When the majority of
the providers are public facilities, an option such as expanding health insurance needs to
be accompanied by reforms related to the governing of public facilities. The second
consideration is the structure of the cost of health shock. When forgone earnings and non-
medical payments constitute the largest share of the cost of health shocks, there needs to
be provisions in the benefit package that covers such losses if the package is to provide
meaningful protection.
Page xi
The poor in Pakistan might be better protected against the financial risk of health shocks through targeted transfers using tools such as those developed for the Benazir Income Support Program. Direct transfers that are conditioned on health shocks would both protect the poor from the actual cost of treatment and provide partial compensation for foregone earnings. On the other hand, providing insurance coverage to the rural poor without restructuring the existing supply of health care services would result in limited use and impact of the scheme. Moreover, by paying for insurance premiums which will then cover the cost of services provided by the public sector, the government may end up effectively paying twice for the same services.
Pakistan cannot afford to ignore the HNP sector if it is to realize sustained economic growth. Interventions focused on improving HNP outcomes are necessary for the sector to serve both as a catalyst to growth and as a beneficiary of it. These interventions include the following options for gradual scale-up:
i. Accelerate the decline in child mortality by (a) addressing neonatal mortality through training lady health workers (LHWs), increasing early post-partum visits, and increasing institutional deliveries; (b) increasing access to effective preventive and curative services; and (c) more regularly tracking the IMR and U5MR and cause of death though demographic surveillance.
ii. Reduce maternal mortality by (a) increasing access to family planning services; (b) increasing the number of skilled providers in rural areas through incentives for doctors, mid-wives, and lady health visitors (LHVs) who work in under-served areas; (c) further expanding 24-hour emergency obstetrical care; (d) improving nutritional status before and during pregnancy (e) providing incentives such as conditional cash transfers for use of prenatal, obstetrical, and post-partum care; and (e) providing vouchers for deliveries.
iii. Intervene on a broad scale to reduce childhood malnutrition by (a) controlling childhood infections, possibly through the use of incentives aimed at increasing vaccination coverage and well-child care; (b) promoting early and exclusive breastfeeding and adequate complementary feeding; (c) addressing micronutrient deficiencies; and (d) treating severely malnourished children using ―protocolized management‖, including community-based approaches
iv. Increase the use of contraceptives to reduce the fertility rate by (a)
increasing the focus of LHWs and other rural health workers on providing
family planning services and supplies; (b) increasing the number of public
facilities that provide a broad menu of family planning methods; (c)
broadening social marketing of contraceptives and ensuring results by
paying contracts based on performance; and (d) offering supply-side
incentives to providers.
Page xii
v. Focus particularly on the poor, including the urban poor by (a) engaging more with non-governmental organizations (NGOs) to provide basic preventive and promotive services; and (b) assessing whether the deployment of LHWs can be targeted and deployed in urban areas.
vi. Protect the poor from impoverishing health shocks by ensuring access to a clearly defined package of services and coordination with the social protection strategy to ensure adequate protection.
These interventions require more resources than what Pakistan currently spends on health. Compared to other countries at its level of development, Pakistan spends very little on HNP services. As a proportion of GDP, the Government of Pakistan spent only 2.6 percent in 2005/06, the lowest in all South Asian countries. Not only is the level of expenditure low, the rate of increase in spending is very slow.
In addition to spending more resources, Pakistan also needs to manage the sector better and spend efficiently. Because of the lack of a clear strategy, expenditures are volatile. There have been large expenditures on hospitals planned in the Public Sector Development Program (PSDP) that seem at odds with efforts to address the MDGs and improve equity. Further, the public financing system is highly fragmented with various entities being responsible for funding limited components and activities of a program in the health system. Such fragmentation weakens accountability and contributes to the inefficiency of delivery.
Domestic initiatives, such as the People’s Primary Healthcare Initiative (PPHI), offer a means for improving the management of publicly financed services: The PPHI is a locally developed and financed approach to improving publicly financed primary care using NGO management. An evaluation of the initiative in two districts in Punjab showed that utilization of BHU services increased significantly and also community satisfaction of services increased. The PPHI can be further expanded and strengthened by (a) including Rural Health Centers under the responsibility of PPHI, and health workers such as lady health workers and vaccinators report to PPHI managers rather than vertically managed by the programs;(b) making the indicators of success explicit and having third party evaluation; and (c) using competitive selection of the NGOs to ensure innovative approaches.
The government could better harness the private sector to attain national health objectives. Much of the improvement in access to prenatal and obstetrical care is due to increased access to and use of the private sector. Taking advantage of private sector growth, even in rural areas, the government could devise alternatives to increase poor people’s access to private providers. It could also consider buying services, such as institutional delivery, from the private sector.
In addition to the for-profit private sector, the government should explore ways to
work with the philanthropic sector. This sector is performing well in managing and
running hospitals, ambulances, and related health services. The results of half-hearted
Page xiii
attempts at giving public hospitals autonomy were modest. A better way of strengthening hospital services, especially for the poor, may be for the government to work with the philanthropic sector. This would involve partnering with philanthropies expand their services. Based on the performance of the philanthropies so far, this approach would appear to have a high likelihood of success.
Improving the HNP outcomes through the above strategies calls for the government to assume a stronger stewardship role in the sector. Because they remain occupied with service delivery, the federal and provincial governments devote little time to stewardship functions such as where they have a unique and irreplaceable role to play.
This neglect could be partly because of lack of structure, resources, and skilled people to
carry out the core stewardship functions both at the federal ministry and in the provincial
level. The governments need substantial capacity building to enable them refocus on
these core functions.
Introduction
Page 14Introduction
Unless coherently addressed, Pakistan’s poor health outcomes and high fertility rate will remain obstacles to poverty reduction efforts. Although Pakistan is making progress, it is unlikely to achieve the health MDGs at its current pace and the country will remain far behind other large South Asian countries. An analysis of both infant mortality and child malnutrition rates indicates that even with increases in maternal education, income, and immunization coverage, Pakistan is not on track to achieve the MDG targets for these indicators.
A comprehensive review of the sector is critical to guide the necessary reform efforts. Few studies have analyzed the serious weaknesses from which the sector suffers and the challenges it faces to more effectively use the limited resources available to it.
Utilization of public facilities remains low, absenteeism is rampant, the quality of care is poor, and coverage of some key interventions is low. So far a comprehensive assessment of the sector is missing, although this is a prerequisite for the design of strategic reforms and for the engagement of all stakeholders.
1. Objective, Scope, Methods, and Audience
Objective: The review aims to develop a limited set of practical options that would allow the government and other stakeholders to improve the availability and use of health services, especially for the poor.
Scope The topics covered in the review were identified after extensive consultation with the Ministry of Health (MOH) and its development partners. The value added of the report lies in helping the various levels of government and their development partners focus on actions that are likely to improve the quality and coverage of health services.
Though the selected topics are considered most pressing and are areas where synthesized documentation is needed, the review also identifies areas where there is knowledge gap. Of particular importance are human resources for health and the private sector. While human resource management issues are discussed in parts of the report, it needs further in-depth assessment to understand the governance, deployment and retention issues affecting service delivery. Accordingly, preparation is underway to have a separate study that can provide actionable recommendations supported by evidence.
Similarly, as important as the private sector is in terms of both service provision and reaching the poor, little is available in the form of documented knowledge that can guide the government in its engagement with public private partnerships.
Methodology and data sources: The report mainly focuses on synthesizing the available
body of knowledge through review of existing studies, reports and research. The review
draws on existing household surveys, particularly the Pakistan Demographic Surveys
(2003 and 2005), Pakistan Health and Demographic Survey (2006/07), Pakistan
Integrated Household Survey (2001/02), Pakistan Social and Living Standard
Measurement Survey (2004/05, 2005/06 and 2006/07), Pakistan Reproductive Health
and Family Planning Survey (2000/01), Household Integrated Economic Survey
Introduction
Page 15(1992/93, 1993/94), Pakistan National Health Accounts (2005/06). In addition, data from World Development Indicators (2001-2009), special survey such as that conducted by the Tropical Disease Research Center ( or Centro de Investigación de Enfermedades Tropicales- CIET 2005), and data from Biological and Behavioral Surveillance (IBBS 2005 and 06) conducted by Agriteam in partnership with the University of Manitoba and Pro-Action, were also used.
Audience: The primary audience for this report consists of the GOP and its development partners, including the Bank management and staff involved in current and future operations in Pakistan.
Use of the report: The review provides various options to improve health service delivery and reach the poor. It highlights alternative interventions that are known to have quick impact and also interventions that need piloting. It also suggests alternative management systems that have worked in Pakistan to improve the performance of the system. The presented options can help guide the government’s effort to focus to improve service delivery for the poor in order to achieve HNP targets of the MDGs. The options are also intended to inform development partners’ support to the sector.
3. Structure of the report
The report starts with a description of the health and nutrition status of the population,
Pakistan’s fertility and growth rates and potential to benefit from a demographic
dividend, the burden of diseases and trends in the past few years. The second and third
chapters describe the performance of the public health care system over time, including
coverage and utilization, quality of care, equity, and patient satisfaction and the impact
of national programs. Chapter four discusses the financing of the sector, including
overall trends, and the composition of public and private expenditures. Chapter five
describes the organization and management of the sector and examines the role of
government. Chapter six concludes by summarizing the key challenges facing the sector
and suggesting a way forward.
Chapter 1: Health Status in Pakistan
Page 16CHAPTER 1. HEALTH STATUS IN PAKISTAN
This chapter presents trends on key health, nutrition, and population outcomes and examines whether Pakistan’s rate of progress is sufficient to achieve the health MDGs by 2015. It looks specifically at (a) infant and child mortality; (b) nutritional status, particularly among children; (c) maternal mortality; (d) fertility and population; (e) the potential to benefit from a demographic dividend; and (f) the burden of disease and emergence of non-communicable diseases (NCDs). This chapter also looks at income, social, and gender variations in health status and suggests options for dealing with the challenges Pakistan still faces.
1.1 Infant and Child Mortality
Pakistan’s infant and child mortality rates are high by regional standards.
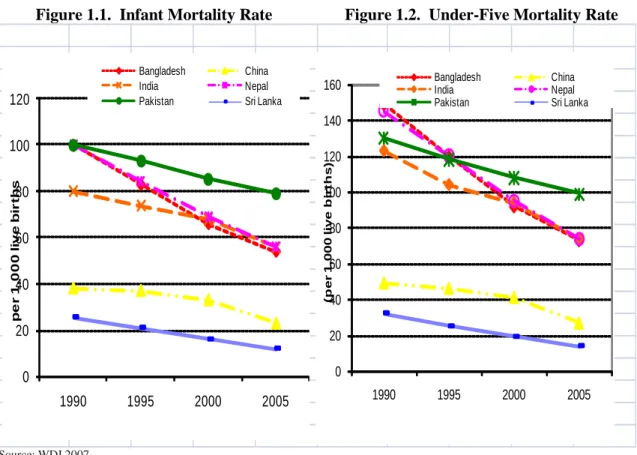
Although both the infant mortality rate (IMR) and the under-five mortality rate (U5MR) have steadily declined since 1990, the rate of decline over the last 15 years has been considerably slower than that of its South Asian neighbors according to World Bank and United Nations estimates (See Figures 1.1 and 1.2). Between 1990 and 2005, the rate of decline in the IMR was 21 percent in Pakistan—less than half of what it was in Bangladesh and Nepal where the IMR declined 46 and 44 percent, respectively
1.
Figure 1.1. Infant Mortality Rate Figure 1.2. Under-Five Mortality Rate
0 20 40 60 80 100 120
1990 1995 2000 2005
per 1,000 live births
Bangladesh China
India Nepal
Pakistan Sri Lanka
0 20 40 60 80 100 120 140 160
1990 1995 2000 2005
(per 1,000 live births)
Bangladesh China
India Nepal
Pakistan Sri Lanka
Source: WDI 2007.
Chapter 1: Health Status in Pakistan
Page 17More than 400,000 children die every year. Similar to the IMR, the U5MR fell by only 24 percent in Pakistan between 1990 and 2006, compared to 57 percent in Sri Lanka and 40 percent in India
2. Currently, infant mortality and under-five mortality stand at 78 and 94 deaths per 1,000 live births, respectively (see Tables 1.1 and 1.2).
3This implies that almost 1 in every 10 children born in Pakistan between 2001-02 and 2006-07, died before turning five. This translates into more than 400,000 child deaths every year.
Table 1.1. Infant Mortality Rate (per 1,000 live births) by Various Sources 1990-2007
Survey Year
Reference
Period IMR
PDHS 1990-91 94
PIHS 1995-96 101
PFFPS 1996-97 92
PIHS 1998-99 1995-97 89
PDS 2000 2000 77
PRHFPS 2000-01 85
PIHS 2001-02 1997-99 82
PDS 2003 2003 76
PDS 2005 2005 77
PSLSMS 2004-05 82
PSLSMS 2005-06 2001-03 70
PDHS 2006-07 2001-06 78
Source: Pakistan Demographic and Health Survey (PDHS), Pakistan Integrated Household Survey (PIHS), PFFPS, PDS, PRHFPS, and Pakistan Social and Living Standards Measurement Survey (PSLSMS), various years.
Table 1.2. Under-Five Mortality Rate (per 1,000 live births) by Various Sources 1990-2007
Survey
Year
Reference
Period U5MR
PDHS 1990-91 120
PSES 2000-01 1991-1999 96
PRHFPS 2000-01 1997-1999 105
PRHFPS 2000-01 103
PDHS 2006-07 2002-06 94
Sources: PDHS, PSES, PRHFPS, PDHS, various years.
The poorest have made little progress and the gap between rich and poor has
increased. The 1990 and 2006 Pakistan Demographic and Health Surveys indicate that
the poorest income quintile has seen almost no change in its under-5 mortality rate (see
Chapter 1: Health Status in Pakistan
Page 18Figure 1.3). This is discouraging and points out the need for ensuring that health services reach the poorest segment of the society.
Figure 1.3. Under-5 Mortality Rates for the Poorest Income Quintile and the Whole Population, 1990 to 2006-07
Source: PDHS, 1990-91 and 2006-07.
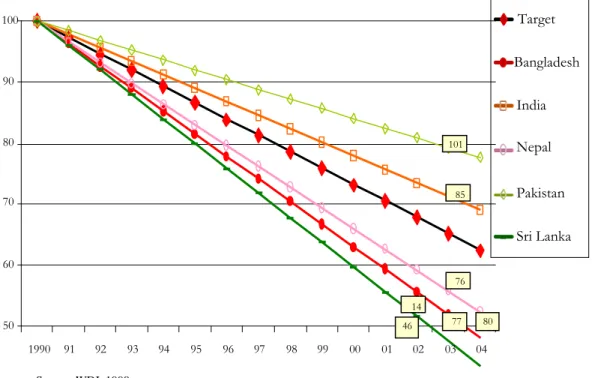
Based on current trends, Pakistan will not achieve the child mortality millennium development goal. The MDG for child health (MDG 4) calls for a reduction by two- thirds in the 1990 levels of U5MR and IMR by 2015. For Pakistan, this translates into an IMR of 33 deaths per 1,000 live births and an U5MR of 43 deaths per 1,000 live births based on United Nations data and World Development Indicators
4. A linear projection suggests that in 2015 Pakistan’s IMR will actually be 65 deaths per 1,000 live births and the U5MR will be 78, considerably above the MDG4 targets. It also appears that Pakistan is the least likely country in South Asia to achieve MDG4. Figure 1.4 sets each country’s 1990 U5MR at 100 and plots the percentage decline since then compared to what would be needed to achieve the MDG4 target (the absolute levels for the latest available year are in boxes at the right).
0 20 40 60 80 100 120 140
Lowest Income Quintile Total
1990 2006-07
Chapter 1: Health Status in Pakistan
Page 19Figure 1.4. Progress on Reducing U5MR Compared to the MDG4 Target (1990 = 100)
Source: WDI, 1990.
Using different sources of data does not change the results of the projections. Using the results of the 1990-91 and 2006-07 Pakistan Demographic and Health Surveys (PDHS) instead of UN and World Bank data does not change the projections about the likelihood of Pakistan achieving MDG4; on the contrary, the PDHS data projects the likely shortfall to be worse (see Figure 1.5).
Figure 1.5. Projections of U5MR and IMR to 2015 Compared to the MDG Targets (Based on PDHS Data)
Source: DHS 1990-91 and 2006-07.
0 20 40 60 80 100 120
1990 1995 2000 2005 2010 2015
Mortality per 1,000 live births
U5MR U5MR Target IMR
IMR Target 50
60
70
80
90
100
1990
91
92
93
94
95
96
97
98
99
00
01
02
03
04
Target
Bangladesh
India
Nepal
Pakistan
Sri Lanka
101
85
76
80
77
14
46
Chapter 1: Health Status in Pakistan
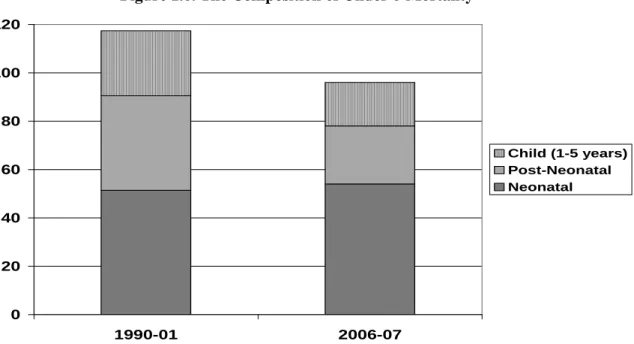
Page 20Neonatal mortality accounts for 57 percent of under-five mortality and has changed little since 1990. Neonatal mortality (that which occurs in the first 28 days of life) now accounts for 57 percent of all under-five deaths in Pakistan. Unlike post- neonatal mortality (children who die between 28 days and their first birthday) and child mortality (children who die between their first and fifth birthdays), neonatal mortality rates have changed little since 1990 (see Figure 1.6). In fact, Pakistan has the highest neonatal mortality in the region
5and neonatal mortality levels have remained more or less stagnant during the last three decades
6.
aFigure 1.6. The Composition of Under-5 Mortality
Source: PDHS 1990-91 and PDHS 2006-07
Gender does not appear to be an important factor in child mortality: PSLSM surveys since the mid-1990s up to the present (and including the PDHS 2006-07) show that girls in Pakistan display the expected biological advantage in IMR. This is quite different from India where boys have a lower U5MR than girls (98 vs. 105 – WDI 2007).
a Regional comparisons were obtained from the WHO’s Statistical Information System (2007). Estimates for neonatal mortality are for 2004. The WHO neonatal estimate for Pakistan in 2004 was 53 deaths per 1,000 live births.
0 20 40 60 80 100 120
1990-01 2006-07
Child (1-5 years) Post-Neonatal Neonatal
Chapter 1: Health Status in Pakistan
Page 21Multivariate analysis suggests that health interventions will have the largest impact on the IMR. A multivariate probit
bmodel using the Pakistan Socio Economic Survey (PSES) suggests that specific health interventions will have the largest impact on IMR (World Bank 2005
7). Figure 1.7 shows the projected decline in the IMR in Pakistan with three selective interventions
cbeing pursued simultaneously and gradually to 2015.
dAn expansion of female schooling and increased sanitation coverage are each associated with declines in infant mortality of three to four deaths per 1,000 live births. On the other hand, expanded immunization coverage, likely linked with other health services, is associated with a large decline of 28 deaths per 1,000 live births. With the full package of interventions, the IMR in the country is projected to decline by 35 infant deaths per 1,000 live births by 2015.
Figure 1.7. Projected Infant Mortality Rate to 2015 Under Different Intervention Scenarios (cumulative effect of each additional intervention)
Evidence suggests that broad socio-economic progress by itself will not be sufficient to help Pakistan achieve the MDG related to reducing child mortality rates. First, the economic growth that has taken place over the last 15 years appears to have had little impact on the U5MR of the poorest income quintile. Second, controlling
b Since the dependent variable is dichotomous the model has been estimated by the maximum-likelihood probit method. The simulations discussed should be treated as indicative of possible trends in the future – not as definitive predictions.
c The starting value of the percentage of women with 10 or more years of schooling is 8.3 in 1998-99 and a 0.5 percentage point change is assumed per year. Percentage of households with access to toilet was 44.5 percent and a 1.8 percentage point change is assumed. Lastly, 68.5 percent of the population had immunization coverage in a district and 2.1 percentage point change per year was assumed.
d The scope and magnitude of the assumed interventions illustrate the likely reduction in IMR under one possible scenario. There is no implication that the assumed interventions will take place and, even if they do, whether the interventions will proceed at the pace assumed.
Source: World Bank, South Asia Human Development Sector,”Attaining the Millennium Development Goals in Pakistan”
Discussion Paper Series Report No. 8, May 2005.
30 35 40 45 50 55 60 65 70 75 80
2001 2002 2003 2004 2005 206 2007 2008 2009 2010 2011 2012 2013 2014 2015 30 35 40 45 50 55 60 65 70 75 80
30 35 40 45 50 55 60 65 70 75 80
2001 2002 2003 2004 2005 206 2007 2008 2009 2010 2011 2012 2013 2014 2015 30 35 40 45 50 55 60 65 70 75 80
Intervention
Expansion of female schooling Improving sanitation access Improving immunization coverage
Chapter 1: Health Status in Pakistan
Page 22for other variables, non-health interventions appear to have had only modest impact on the IMR. Third, other countries in the region with similar or worse economic growth rates (such as Bangladesh and Nepal) have achieved much greater rates of decline in the IMR and U5MR.
1.2 Child Nutritional Status
Pakistan has a high prevalence of malnutrition by global standards, although lower than elsewhere in the South Asia Region. With the exception of Sri Lanka, at 38 percent Pakistan has the lowest prevalence of under-weight in South Asia
e. However, the extent of malnutrition in the country is still very high by global standards and still compares poorly even against averages for sub-Saharan Africa (Figure 1.8).
Figure 1.8. Prevalence of Malnutrition (children more than two standard deviations below the weight for age norms) Among Children Under 5 in Percent
Source: Sri Lanka Pakistan (DHS 2003) Nepal (DHS 2006); Bangladesh (DHS 2007), India (NFHS 2005- 06). Sub-Saharan África (SSA) 2007 estimate.
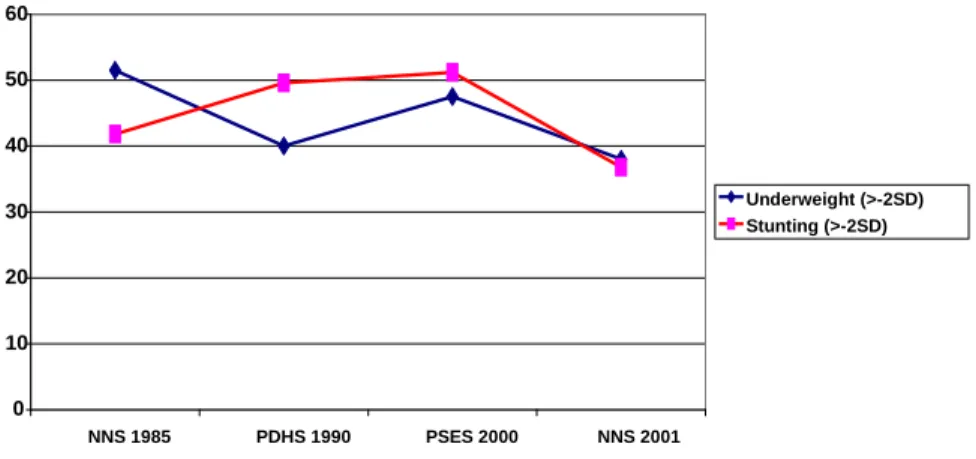
The trend in child nutritional status appears static. From the currently available survey data it does not appear that malnutrition as measured by the prevalence of underweight (i.e., more than two standard deviations below the weight for age norms) has changed much since the early 1990s (see Figure 1.9). Stunting (i.e., the proportion of children more than two standard deviations below the height for age norms), an indicator of chronic under-nutrition, appears to have declined from the early 1990s. But this suggests little sustained progress when compared to the national nutrition survey in 1985.
Figure 1.9. Prevalence of Under-5 Malnutrition According to Various Surveys
e This is using population reference of the National Center for Health Statistics.
0 10 20 30 40 50 60
SSA Sri Lanka 2002 Pakistan 2002 India 2005-06 Bangladesh 2007 Nepal 2006
Chapter 1: Health Status in Pakistan
Page 23 Source: NNS 1985, 2001; PDHS 1990; and PSES 2000Pakistan is not on track to achieve the MDG related to reducing malnutrition.
Without concerted efforts, it does not appear that Pakistan will achieve the MDG nutrition target as it has the slowest rate of decline in malnutrition rates in South Asia.
Figure 1.10 plots the percentage decrease in malnutrition prevalence of South Asian countries by setting the prevalence in 1990 to 100.
Figure 1.7. Prevalence of Malnutrition (moderate and severe under-weight) (1990 = 100)
Source: WDI 2006 and UNDP 2005-06.
There are widespread micronutrient deficiencies in Pakistan: According to the 2001-02 National Nutrition Survey (NNS), 12.5 percent of children suffered from Vitamin A deficiency; nearly 36 percent, from iron deficiency anemia; and 37 percent, from zinc deficiency (see Table 1.3). While 6.5 percent of children were found to suffer from a clinical sign of severe iodine deficiency in 2001-02, biochemical evidence of subclinical iodine deficiency (urinary levels below 20 ug/ml) was found in 59 percent of school-aged children (23 percent had severe deficiency, 17 percent moderate, and 19 percent mild)
8. These micronutrient deficiencies are very serious because the causal link between them and adverse child health and developmental outcomes is very strong.
60 70 80 90 100
1990 91 92 93 94 95 96 97 98 99 00 01 02 03 04 05 06 07 08
Target Bangladesh India Nepal Pakistan Sri Lanka 0
10 20 30 40 50 60
NNS 1985 PDHS 1990 PSES 2000 NNS 2001
Underweight (>-2SD) Stunting (>-2SD)
Chapter 1: Health Status in Pakistan
Page 24Table 1.3. Summary of Micronutrient Deficiency Prevalence Rates (percent)
Survey Sample Vit. A Deficiency
Severe Iodine Deficiency
Iron Deficiency
Anemia
Zinc Deficiency
NNS 2001-02
Children
0-5 Years 12.5 22.9 35.6 37
Mothers 15-49 years
of age
5.9 36.5 25.5 41
Source: GOP, Micronutrient Initiative and Nutrient Wing, National Plan of Action for the Control of Micronutrient Malnutrition in Pakistan, p. 14.
The consequences of widespread malnutrition are many and serious. In addition, to interfering with psycho-motor development and increasing the risk of dying in childhood, wide-spread malnutrition reduces school performance and may independently reduce the productivity of the adult workforce. Chronic malnutrition in females may cause difficulty and death in future pregnancies and impaired physical and mental development in their offspring
9. Recent research also indicates that malnutrition in childhood increases the risk of developing chronic non-communicable diseases, such as heart disease, as an adult. Therefore, Pakistan cannot afford to have such high levels of malnutrition.
No evidence of gender differentials in nutritional status has been found. The results of the 2001-02 NNS (see Figure 1.11) and previous surveys, particularly the 1990-91 PDHS, do not show any obvious indication of gender differentials in rates of malnutrition. The similarities between males and females in terms of nutritional status remain even when taking income levels into account
.Figure 1.8. Malnutrition Prevalence by Gender – National Nutrition Survey 2001-02
0 5 10 15 20 25 30 35 40
% of underweight children under-five years
% of stunted children under-five years
% of wasted children under- five years
Males Females
Chapter 1: Health Status in Pakistan
Page 25 Source: NNS 2001-02Multivariate analysis suggests that health interventions will have the largest impact on malnutrition: The multivariate probit
fmodel discussed earlier also suggests that specific health interventions will have the largest impact on rates of malnutrition (World Bank 2005). Figure 1.12 shows the projected decline in the child underweight rate in Pakistan with five selective interventions being pursued simultaneously and gradually to 2015. A 5.4 percent annual increase in household consumption expenditure per capita is associated with a reduction of the child underweight rate by 2.4 percentage points. This is consistent with the finding that the national average daily per capita consumption of calories (2,350) and protein (62g) is adequate
10.Expansion of female schooling and increased sanitation and electricity coverage are associated with modest declines in the child underweight rate of about 1-1½ percentage points.
gHowever, expanded immunization coverage is associated with a dramatic decline in child malnutrition of about 10 percentage points, and it swamps the effect of the other interventions.
hWith the full package of interventions in place, the child underweight rate in the country is projected to decline by 16 percentage points by 2015.
Figure 1.9. Projected Child Underweight Rate to 2015. Under Different Intervention Scenarios (cumulative effect of each additional intervention)
f Since the dependent variable is dichotomous the model has been estimated by the maximum-likelihood probit method. The simulations discussed should be treated as indicative of possible trends in the future and not as definitive predictions as it does not include variables that may have large impact on nutrition such as early and exclusive breastfeeding, complementary feeding.
g In 2000-01, 20.5 percent of women had some formal schooling and a 2 % point change is assumed per year. 78 percent of households had an electricity connection in 2000-01 and a 1.45 % point annual increase has been assumed. 44.5 percent of households had access to a toilet and a 1.8 %point annual increase has been assumed. Lastly, 68.5 percent of the population in each district had immunization coverage and a 2.1% point annual increase has been assumed.
h The plausibility is that vaccines prevent infections (e.g. measles) that would reduce appetite, intake of food and reduce absorption.
Chapter 1: Health Status in Pakistan
Page 261.3 Maternal Mortality
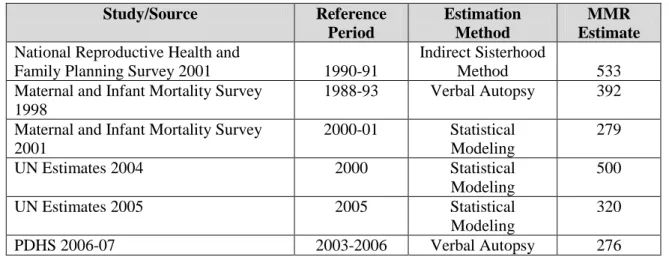
Maternal mortality appears to have decreased. The maternal mortality ratio (MMR) - - the number of maternal deaths per 100,000 births - is one of the hardest of the MDGs to measure, partly because, statistically, it is a rare event. As Table 4.1 shows, different studies using different methodologies provide varying estimates. Yet it shows a declining trend. Given an MMR of about 300 and a total fertility rate of 4.1, the average woman in Pakistan runs about a 1 in 80 risk of dying of maternal causes during her reproductive life.
15 20 25 30 35 40 45 50
15 20 25 30 35 40 45 50
2001 2002 2003 2004 2005 2006 2007 2008 2009 2010 2011 2012 2013 2014 2015 Real per capita income growth
Expanding electricity coverage Expansion of female schooling
Improving immunization coverage Imporving sanitation access
MDG
Chapter 1: Health Status in Pakistan
Page 27Table 1.4. Maternal Mortality Ratios from Different Studies in Pakistan
Study/Source Reference
Period
Estimation Method
MMR Estimate
National Reproductive Health andFamily Planning Survey 2001 1990-91
Indirect Sisterhood
Method 533
Maternal and Infant Mortality Survey 1998
1988-93 Verbal Autopsy 392 Maternal and Infant Mortality Survey
2001
2000-01 Statistical Modeling
279
UN Estimates 2004 2000 Statistical
Modeling
500
UN Estimates 2005 2005 Statistical
Modeling
320
PDHS 2006-07 2003-2006 Verbal Autopsy 276
Source: Pakistan Reproductive Health and Family Planning Survey 2001; Maternal and Infant Mortality Survey 1998; Maternal and Infant Mortality Survey 2001; UN Estimates 2004, 2005; PDHS 2006-07
There has been a slow increase in skilled birth attendance. Because of the
difficulties of measuring MMR accurately and frequently, more attention has been paid
to measuring increasing skilled birth attendance, which is seen as a proxy for maternal
mortality. Pakistan has made slow progress in increasing the proportion of women who
benefit from skilled birth attendance; the 2006-07 PDHS indicates that it has only
reached 38 percent. Although this is progress, it is significantly behind that of India and
far behind what has been accomplished in Sri Lanka (see Figure 1.13). A similar story
applies to delivery in a health facility, which has increased from 14.8 percent in the
1990-91 PDHS to 34.2 percent in the 2006-07 PDHS. In order to achieve MDG5 (i.e.,
reducing MMR by three fourths of 1990 levels) Pakistan will have to rapidly expand the
use of skilled birth attendants and delivery in a facility.
Chapter 1: Health Status in Pakistan
Page 28Figure 1.10. Skilled Birth Attendance (percent) Across South Asia
Source: WDI 2006 and UNDP 2005-06
Doctors are attending more deliveries. Over the last 6 years there appears to be an increase in the proportion of deliveries that are attended by doctors, even in rural areas.
As the data in Table 1.5 show, the increase in attendance by doctors seems to be displacing traditional birth attendants (TBAs) and completely unskilled attendants.
Midwives, nurses and LHVs play a relatively smaller role than doctors, even in rural areas.
Table 1.5. Proportion of Birth Assistance by Type of Provider 2001-02 PIHS 2006-07 PSLSMS Urban Rural Overall Urban Rural Overall
Doctor 40 11 19 48 17 26
Nurse 8 3 4 10 6 7
Trained Dai/TBA 43 61 56 32 56 49
Midwife 6 3 3
Family member/Neighbor/Friend 8 23 19 5 18 14
LHV
Total 100 100 100 100 100 100
Source: PSLSMS 2005-06
Note: (1) Based on births during the past three years to all ever married women aged 15-49 years (last pregnancy only). Totals may not add to 100 because of rounding.
1.4 Fertility
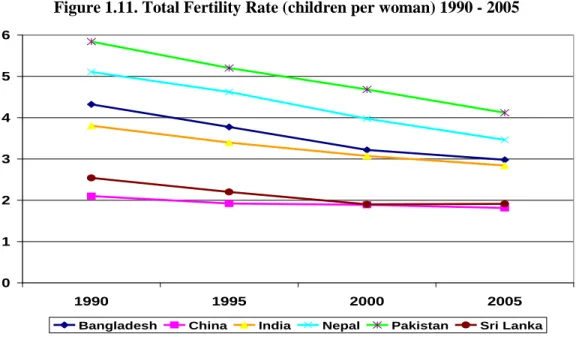
Pakistan’s fertility rate is much higher than that of its neighbors. Although Pakistan has witnessed a decline from 5.6 children per women in 1990-91 to 4.1 in 2006-07, its total fertility rate (TFR) is still considerably higher than any of its neighbors’ (see Figure 1.14). When combined with the young population age structure,
0 20 40 60 80 100
1990 91 92 93 94 95 96 97 98 99 00 01 02 03 04 05 06
Bangladesh India Nepal Pakistan Sri Lanka
Chapter 1: Health Status in Pakistan
Page 29the annual population growth rate has remained nearly constant over the last 15 years, at around 2.4 percent per year, an effect known as ―demographic momentum.‖
Figure 1.11. Total Fertility Rate (children per woman) 1990 - 2005
Source: WDI 2007
Much of Pakistan’s high fertility rate is largely due to low use of contraceptives.
Recent research points to the importance of access to family planning in reducing fertility rates, particularly in countries with a young age distribution. While Pakistan’s CPR has improved slowly since 1990 (see Figure 1.15), it remains far behind its South Asian neighbors’. Bangladesh, for example has nearly twice as high a CPR as Pakistan does (see Figure 1.16) and consequently a low TFR.
Figure 1.12. Contraceptive Prevalence Rate (all methods, percent) Over Time in Pakistan
Source: PDHS 1990-91, 2006-07; PFFPS 1996-97; PRHFPS 2000-01; SWRHSPS 2003.
0 1 2 3 4 5 6
1990 1995 2000 2005
Bangladesh China India Nepal Pakistan Sri Lanka
11.8
24
28
32
30
0 5 10 15 20 25 30 35
1990-91 (PDHS) 1996-97 (PFFPS)
2000-01 (PRHFPS)
2003 (SWRHFPS)
2006-07 (PDHS)
Chapter 1: Health Status in Pakistan
Page 30Figure 1.13. CPR (all methods, percent) in South Asia
Sources: Bangladesh DHS 2007; Nepal DHS 2006; India National Family Health Survey 2005-06; Pakistan DHS 2006-07; WDI 2007 and WHO statistical system 2007
There is a large unmet demand for family planning. Assessing the true unmet demand for contraception is challenging but a number of surveys in Pakistan consistently show that couples do indeed want to use family planning. The results of various studies show that the unmet demand for family planning has unfailingly been above 30 percent, the highest rate outside sub-Saharan Africa. The unmet need in rural areas of Pakistan is substantial, and the very high rates of abortion suggest that it is indeed high (see Figure 1.17). It also implies that women’s lives are at risk from unsafe abortions.
Figure 1.14. Abortion Rate (per 1,000 women) and Unmet Need for Contraception (percent)
Source: Population Council 2004
Condoms and female sterilization are the main modern methods of contraception used. Data from 2006-07 PDHS indicate that condoms and female sterilization are the most popular forms of modern contraception and that female sterilization is particularly important in rural areas. The relatively low overall CPR and low use of pills and injectables, especially in rural areas, is disappointing given the dramatic increase in the number of LHWs over the last 5 years.
0 10 20 30 40
abortion rate unmet need
NWFP Punjab Sindh
Balochistan 0
10 20 30 40 50 60 70
Bangladesh - 2007
India – 2005/06 Nepal - 2006 Sri Lanka - 2000
Pakistan - 2006/07