Policy Research Working Paper 6899
Private Non-State Sector Engagement in the Provision of Educational Services
at the Primary and Secondary Levels in South Asia
An Analytical Review of Its Role in School Enrollment and Student Achievement
Mahesh Dahal Quynh Nguyen
The World Bank South Asia Region Education Unit June 2014
WPS6899
Public Disclosure AuthorizedPublic Disclosure AuthorizedPublic Disclosure AuthorizedPublic Disclosure Authorized
Produced by the Research Support Team
Abstract
The Policy Research Working Paper Series disseminates the findings of work in progress to encourage the exchange of ideas about development issues. An objective of the series is to get the findings out quickly, even if the presentations are less than fully polished. The papers carry the names of the authors and should be cited accordingly. The findings, interpretations, and conclusions expressed in this paper are entirely those of the authors. They do not necessarily represent the views of the International Bank for Reconstruction and Development/World Bank and its affiliated organizations, or those of the Executive Directors of the World Bank or the governments they represent.
Policy Research Working Paper 6899
Private (non-state) sector engagement in the provision of educational services at the primary and secondary levels in South Asia has recently undergone remarkable growth.
This type of education comes in various forms, such as schools financed and managed by the private sector, schools financed by the government and managed by the private sector, private school vouchers, and tutoring outside the classroom. According to recent household survey data, almost one-third of school-goers aged 6 to 18 years in South Asia go to private schools, with a high concentration in Bangladesh, India, Nepal, and Pakistan.
Data for India, Nepal, and Pakistan show that on average, private schools perform at least as well as government schools on student test scores, after controlling for socioeconomic factors, and they do so at significantly lower costs to society. However, student achievement
This paper is a product of the Education Unit, South Asia Region. It is part of a larger effort by the World Bank to provide open access to its research and make a contribution to development policy discussions around the world. Policy Research Working Papers are also posted on the Web at http://econ.worldbank.org. The authors may be contacted at qnguyen4@
worldbank.org.
varies greatly across schools of each type, with many weak private schools as well as strong government schools.
Substantial, albeit indirect, evidence points to teacher behavior and accountability as an important driver of the effectiveness of private schools. In the long run, however, many factors may play important roles in sustaining the private sector’s advantage. Another risk is that overall poor quality in a large government sector may set a low benchmark for the private sector. The findings cast doubt on the effectiveness of government regulations for private schools, given weak institutional capacity. Public-private partnerships with effective accountability mechanisms could leverage both equity and efficiency. Finally, it appears important to understand and customize teaching to the child’s individual level.
Private Non-State Sector Engagement in the Provision of Educational Services at the Primary and Secondary Levels in South Asia: An Analytical Review of Its Role
in School Enrollment and Student Achievement
Mahesh Dahal, World Bank Quynh Nguyen, World Bank
*Key words: Private sector, private school, South Asia, learning, achievement JEL: I210
Sector Board: Education
We thank Tara Beteille, Sangeeta Goyal, Toby Linden, Karthik Muralidharan, Dhushyanth Raju and Michelle Riboud for helpful comments. The findings, interpretations and conclusions expressed herein are our own and do not necessarily represent the views of the World Bank, its Board of Directors, or any of its member countries. All remaining errors are our own.
* Dahal: mdahal@worldbank.org. Nguyen: qnguyen4@worldbank.org.
I. Introduction
1. The role of the private sector has become increasingly prominent in the educational landscape of South Asia in recent years, taking the spotlight in academic research as well as the popular media. The private sector is defined here in its broadest sense, including communities, non-governmental organizations (NGOs), faith-based organizations, trade unions, private companies, small-scale informal and individuals (Lewis and Patrinos, 2011). In other words, the private sector here refers to non-state entities. Private schools have accounted for a considerably increasing share of student enrollment at all grade levels. Various types of public-private partnership have emerged. Much attention has also been drawn to the widespread phenomenon of outside-classroom tutoring. A central question in today’s discussion is with regards to the absolute and relative quality of education associated with engagement by the private sector.
2. This paper contributes to the literature and discussion by putting together, for the first time, a regional picture of the role of the private sector in educational service delivery at the primary and secondary levels across the countries in South Asia, and examining the learning quality associated with this engagement, as measured by student test scores. The paper involves an extensive literature review, basic data analyses (using household surveys, learning assessment surveys, and school censuses), and policy implications proposed by the authors. It does not entail any original impact evaluation. Due to varying degrees of availability of data and information as well as varying histories and government policies across the countries, Bangladesh, India, Nepal and Pakistan get extensive analysis, while analysis for the other countries is limited. Similarly, some types of private sector engagement can be discussed in more detail than some other types.
Moreover, the paper focuses on country-level analysis, and abstracts from analysis of variation across within-country administrative units, such as states, provinces and districts, which could be substantial (see, for example, Nguyen and Raju, 2013).
3. Private sector engagement in the provision of educational services at the primary and secondary levels in South Asia takes various types. Schools fully financed and managed by the private sector (unaided schools) account for virtually all of private sector engagement in primary and secondary education in Nepal and Pakistan. Government financed and privately managed schools (aided schools) are highly prevalent in Bangladesh and have considerable presence in India. According to the latest household survey data available for seven of the eight regional countries, almost one-third of school children are enrolled in schools identified as private schools (aided or unaided schools), with a high concentration in Bangladesh, India, Nepal and Pakistan.
Available school census data for these four countries indicate that the expansion of privately managed schools is fairly recent, starting around the mid-1970s to early 1980s. Predominant among the urban and high-income, it has increasingly reached rural areas and poorer households.
Importantly, in India, the parliament has recently passed the Right to Education Act that includes a provision mandating private schools to reserve up to 25% of their seats for students from disadvantaged backgrounds, with a reimbursement of fees by the government. With this provision, India may soon lead the world in the number of children attending private schools with government funding, and also in the inclusiveness of private schooling. Besides engagement in aided and unaided schools, the private sector may also provide school-level services without assuming management responsibilities, or set up schools of a specific model, finance and run them while gradually transferring financing and management responsibilities to the government.
Outside-classroom paid tutoring is reported to be common in most countries, whether private schooling is minimal or significant (except in Bhutan where tutoring is banned by law).
2
4. Disaggregated test score data available for India, Pakistan, and Nepal show that on average, privately managed schools perform at least as well as government managed schools in terms of student test scores, at significantly lower costs to society. At the same time, it is important to acknowledge the average poor performance in private schools. Moreover, there is significant variability in student achievement among schools of both types, with a large overlap between test score distributions of two types of schools, indicating the existence of many bad private schools as well as good government schools. We point out several advantageous characteristics of private schools; in particular, we find substantial, albeit indirect, support for teacher behavior and accountability as a driver of private schools’ effectiveness. Nevertheless, these advantages would not suffice to induce student achievement over the long run, if, for example, there is little improvement in the professional knowledge and skills of available teachers, particularly in economically disadvantaged areas. It is also important to realize that in an education market, the quality of government schools serves as the benchmark against which private schools differentiate themselves. The lower the quality of government schools, the lower the quality of private schools, unless the market is competitive among private schools, which is unlikely in many rural areas. Higher wages of government teachers do not seem associated with higher student achievement outcomes; hence a focus on student achievement in policy dialogue and policymaking, coupled with strengthened governance and accountability systems, would be important. This requires a system of reliable and regular measurement of student achievement to begin with. On the other hand, many private schools may imitate elite ones in visible aspects of infrastructure, facilities, methodologies, and curriculum.
5. Many unaided private schools, whose students perform, on average, at least as well as government school students, are unregistered and free of government regulations. This casts doubt on the effectiveness of regulations on school registration, fees and teacher credentials that the government may set for private schools, especially given the weak institutional capacity. On the other hand, there is potential for contractual partnerships between the government and private sector to leverage both “equity” and “efficiency,” and the design of an accountability mechanism for such partnerships would be crucial. Moreover, regional and international evidence suggests that understanding and customizing teaching to the child’s individual level and way of learning is important to improving academic achievement – there is potential to cater to this need through a student-focused approach in classroom teaching and classroom and school management, or through well-designed outside-classroom tutoring services, among other potential reforms.
6. In the remainder of the paper, we first discuss the types and general extent of private sector engagement in education in South Asia. We then discuss in more detail the prevalence, socio-economic patterns, and over-time evolution of private schooling in aided and unaided schools, as well as of outside-classroom tutoring, in countries for which data and information allow such analyses. We next present evidence on student achievement associated with the different types of private sector engagement, discussing underlying factors and mechanisms, with references to the socio-economic patterns identified in the previous section. The last section draws conclusions and policy implications.
II. Types, extent, socio-economic patterns, and over-time evolution of private sector engagement
3
a. Types and general extent of private sector engagement
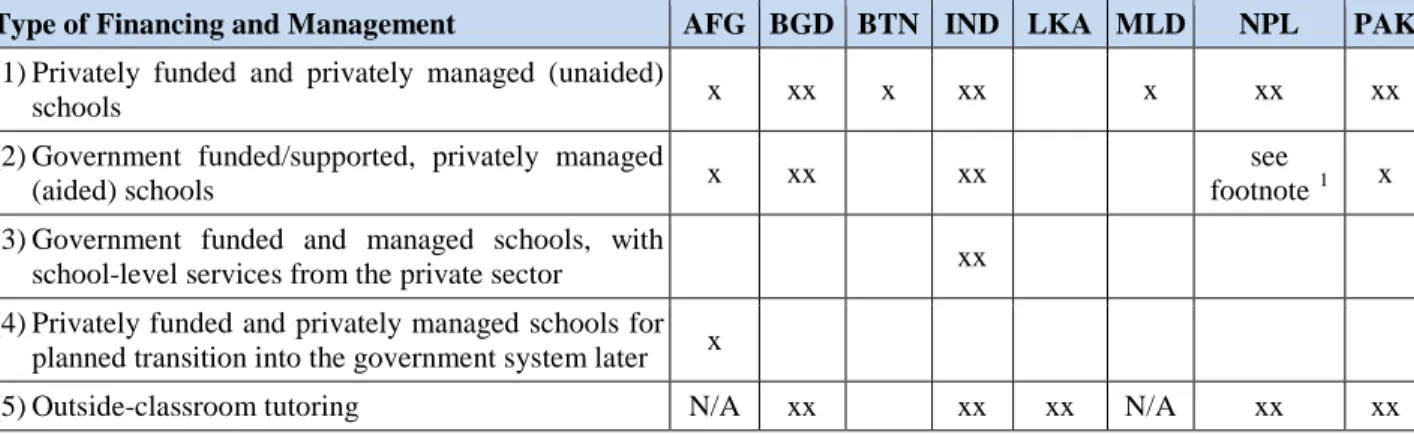
Table 1.
Types of private sector engagement in the provision of educational services at the primary and secondary levels in South Asia
Type of Financing and Management AFG BGD BTN IND LKA MLD NPL PAK (1) Privately funded and privately managed (unaided)
schools x xx x xx x xx xx
(2) Government funded/supported, privately managed
(aided) schools x xx xx see
footnote 1 x (3) Government funded and managed schools, with
school-level services from the private sector xx
(4) Privately funded and privately managed schools for planned transition into the government system later x
(5) Outside-classroom tutoring N/A xx xx xx N/A xx xx
Notes: 1. “xx” indicates considerable prevalence, i.e. the type is listed in household or school census questionnaires, with at least a 10% share of total enrollment in the country, or is reported for roughly 10% or more of schools, or is reported for roughly 10% of children, according to government or institutional documents or peer-reviewed research papers. “x” indicates modest prevalence, i.e. the type is listed in household or school census questionnaires but accounts for less than 10% of total enrollment, or is reported for at least 100 schools or 3% of schools but less than 10% of schools, or is reported for at least 10,000 children or 3% of children, according to government or institutional documents or peer-reviewed research papers. The blanks denote that the type is not prevalent enough to qualify for an x or xx rating. “N/A” denotes that no information can be obtained from any source.
2. AFG: Afghanistan; BGD: Bangladesh; BTN: Bhutan; IND: India; LKA: Sri Lanka; MLD: Maldives; NPL: Nepal;
PAK: Pakistan.
3. Religious schools are managed by the private sector but not considered here. Their reported share in household survey data is about 0.1% in Afghanistan, 1.5% in Nepal, 2% in Pakistan, and 3%–7% in Bangladesh in the three age groups. Their curriculum often differs greatly from the secular curriculum, making it difficult to assess religious education along with non-religious education.
7. According to the latest household survey data
2,3, almost one-third of school children in
1 At most government schools in Nepal, the local community has been handed some management powers since 2001, due to an amendment to the Education Act. However, we consider them government schools as teacher management and recruitment, a key management activity, is still practically largely controlled by the government.
2 Afghanistan: 2007/08 National Risk and Vulnerability Assessment Survey Bangladesh: 2010 Household Income and Expenditure Survey
Bhutan: 2007 Living Standards Survey
India: 2009/10 (66th round) National Sample Survey (Schedule 10: Employment and Unemployment) Nepal: 2009/10 Living Standards Survey
Pakistan: 2010/11 Social and Living Standards Measurement Survey
3 As this paper considers both household-level and school-level data, it is worth noting using household survey data tends to show better the true size of private schooling than school-level data, due to the prevalence of unrecognized schools. For example, in India, Kingdon (2007) examines statistics from multiple household- and school-level surveys and estimates the true number of private schools to be up to three times that in official school-level statistics. This is corroborated by Muralidharan and Kremer (2008)’s finding through a large-scale independent survey that 51% of private primary schools in rural areas in 20 Indian states are unrecognized. On the one hand, teachers in government and government-financed schools may want to over-report enrollment to receive more funding. On the other hand, households are more likely to report enrollment of children in unrecognized schools
4
South Asia are enrolled in schools identified as private schools: 27% for 6–10 year-olds, 31% for 11–15 year-olds, and 39% for 16–18 year-olds. Schools identified as private schools in household surveys may involve different types of private sector engagement, mostly, but not exclusively, in categories (1) and (2) in Table 1. Type (1) schools are managed by the private sector and financed by the private sector itself (unaided), while type (2) schools are managed by the private sector but fully or partly funded by the government (aided). The distinction between the aided and unaided types is made only in the Bangladesh and India household surveys, where there are considerable shares of both types. In Pakistan, there are a considerable number of aided schools, although these schools are relatively new. For example, under the Foundation Assisted Schools (FAS) initiative started in 2005 in Punjab province, 1,779 low-cost private schools in 29 districts were receiving support from the government as of 2010, conditional on satisfactory student achievement (Barrera-Osorio and Raju, 2010), and under the Promoting Low-Cost Private Schooling in Rural Sindh (PPRS) initiative started in 2009, 481 schools had been established and run by entrepreneurs as of 2011, with support from the government subject to operational and management requirements (Barrera-Osorio et al., 2011). Household survey information on private schooling is not available for the Maldives and Sri Lanka. Private schooling has been banned in Sri Lanka since 1961. As for the Maldives, school statistics of 2012 show that more than 3% of primary and secondary students in the country go to schools managed by private sector providers.
8. Besides engagement in aided and unaided schools, the private sector may provide school- level services to the government without assuming management responsibilities. This is type (3) in Table 1, and, in our definition, it does not include numerous contractual engagements between the government and private providers that do not involve school-level services. In India, NGOs such as Pratham and the Akshara Foundation, as well as universities and IT firms engage in a large number of classroom support activities with government schools. We do not find substantive evidence of this type of partnership in the other countries. We find type (4) in Afghanistan, where, under Partnership for Advancing Community-Based Education (PACE-A, funded by USAID) in 2006-11, a consortium of NGOs built and managed village-based schools, providing primary education to about 100,000 children in rural underserved localities in 19 provinces, with a goal of transferring ownership, including funding and management, to the government (see, for example, Burde and Linden, forthcoming). Outside-classroom tutoring - type (5) - is reported in household surveys for Bangladesh and Nepal, where it is prevalent, and interestingly reported also for Bhutan, where it is almost non-existent (less than 1% among Bhutanese students) and prohibited by law. Other sources indicate that tutoring is common in India, Pakistan and Sri Lanka as well (see, for example, Aslam and Atherton, 2012, and Jayachandran, 2012), although the information is not reported in household surveys for these countries. We are not aware of any dataset or written document on tutoring in the Maldives;
however, informal interviews conducted by World Bank staff indicate that at least 80% of primary and secondary school students take private tutoring. No substantive information is available on the prevalence of tutoring in Afghanistan.
whereas school-level surveys tend to collect data only from identifiable schools either as registered in the government’s database or as spotted by survey administrators.Some schools can be of such small sizes, such as one- teacher schools that are quite common in rural areas, and/or located in such remote or crowded areas with small or no sign boards that survey administrators are likely to miss them. Therefore household surveys may be particularly helpful in depicting private schooling in remote and rural areas.
5
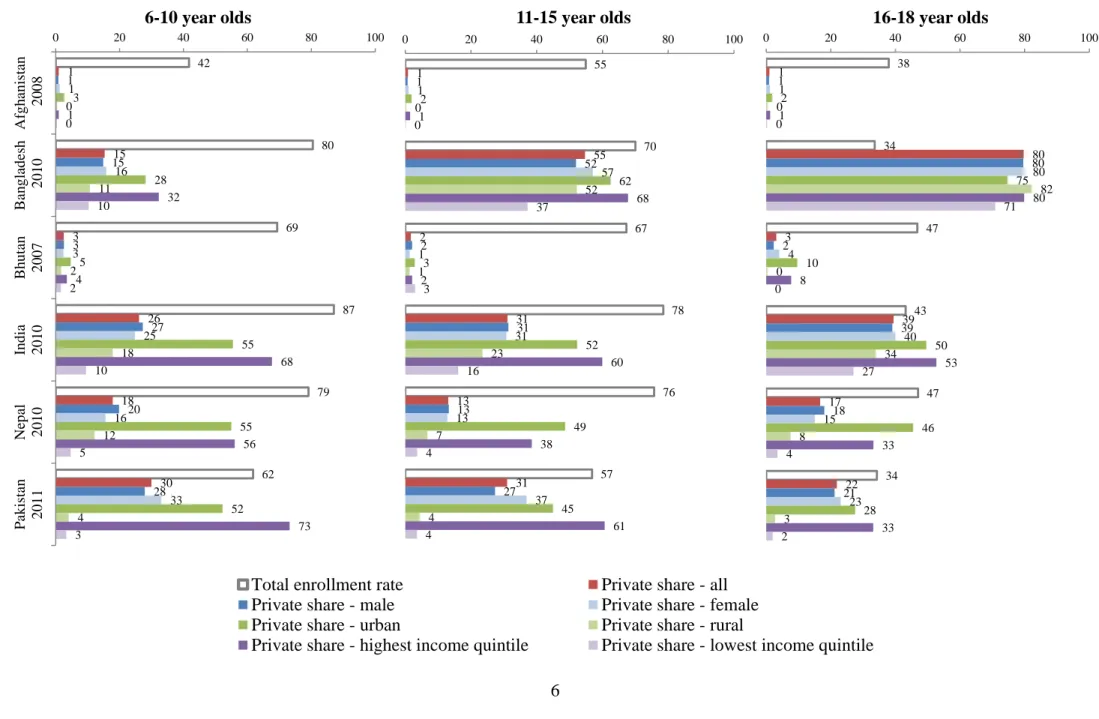
Figure 1. Enrollment in private schools as a share of total enrollment, overall and by socio-economic groups
42
80
69
87
79
62 1
15
3
26
18
30 1
15
3
27
20
28 1
16
3
25
16
33 3
28
5
55
55
52 0
11
2
18
12
4 1
32
4
68
56
73 0
10
2
10
5
3
0 20 40 60 80 100
Afghanistan 2008Bangladesh 2010Bhutan 2007India 2010Nepal 2010Pakistan 2011
6-10 year olds
55
70
67
78
76
57 1
55
2
31
13
31 1
52
2
31
13
27 1
57
1
31
13
37 2
62
3
52
49
45 0
52
1
23
7
4 1
68
2
60
38
61 0
37
3
16
4
4
0 20 40 60 80 100
11-15 year olds
38
34
47
43
47
34 1
80
3
39
17
22 1
80
2
39
18
21 1
80
4
40
15
23 2
75
10
50
46
28 0
82
0
34
8
3 1
80
8
53
33
33 0
71
0
27
4
2
0 20 40 60 80 100
16-18 year olds
Total enrollment rate Private share - all
Private share - male Private share - female
Private share - urban Private share - rural
Private share - highest income quintile Private share - lowest income quintile
6
b. Prevalence and socio-economic patterns of private schooling in Afghanistan, Bangladesh, Bhutan, India, Nepal and Pakistan, and over-time evolution of private schooling in Bangladesh, Bhutan, India, Nepal and Pakistan, as reported in household surveys and school censuses
9. Private schooling (in aided and unaided schools) appears concentrated in four countries, Bangladesh, India, Nepal, and Pakistan, as demonstrated in Figure 1, using household survey data. Private school enrollment accounts from 15% to 80% of total enrollment across the age groups in these countries. Private sector engagement in education is incipient in Afghanistan, and is traditionally minimal in Bhutan.
10. The shares of aided and unaided private schools vary significantly across the four high- concentration countries. Aided schools’ presence is extensive in Bangladesh, considerable in India, and minimal in Nepal and Pakistan. Aided schools in India take origin from a policy in the colonial past, with teacher salary subsidies proportionate to enrollment
4. In 2009/10, they account for 30% of private school enrollment among 6-10 year-olds, 41% among 11-15 year- olds, and 55% among 16-18 year-olds. The colonial tradition was interrupted in Pakistan in 1972 and Bangladesh in 1973, when private schools underwent mandated nationalization. The 1973 nationalization mandate in Bangladesh applied only one time to existing primary schools; after that, private schools could be established and government financing resumed. As of the latest household survey in 2010, aided schools account for 31% of private school enrollment among 6- 10 year-olds, 86% among 1
1–15 year-olds, and 95% among 16
–18 year-olds. The remarkably high shares of aided schools in the older age groups may be attributed to a salary subvention system that was introduced by the Bangladeshi government in 1981 to support private secondary institutions (Rahman et al., 2010). However, in Pakistan, since the reversal of nationalization in 1979, the colonial tradition has not resumed. The distinction between “aided” and “unaided” is not made in the Pakistan and Nepal household surveys. In fact, most government schools in Nepal may be considered as partially aided as the local community has been handed some management powers since 2001, due to an amendment to the Education Act. However, we consider them in the government category in this paper given that teacher management and recruitment, a key management activity, is still practically controlled by the government
5. 11. Although overall school enrollment is biased towards boys in all the countries presented in Figure 1, except in Bangladesh where the reverse applies (perhaps largely due to reduced schooling costs through the Female Secondary School Assistance Project (FSSAP) that started in 1993), this pattern does not hold in terms of the private school share of enrollment. Gender gaps in the private schooling share are small and do not follow a consistent pattern across the countries. The only cases where the gender gap is 3 percentage points or more are the 11-15 age group in Bangladesh with a 5 percentage-point female advantage, the 6-10 and 16-18 age groups in Nepal with male advantages of 4 and 3 percentage points, respectively, and the 6-10 and 11-15
4 A president of the Board of Control of the East Asia Company in 1854 recommended that (pre-partition) India provide grants-in-aid in support of private schools.
5 It may be useful to note that in the case of Nepal, government schools have become partially managed by the community, whereas in the case of Bangladesh, schools established by the private sector receive government funding. As a result, the partnership in Nepal maintains a government identity, whereas the partnership in Bangladesh maintains a private identity.
7
age groups in Pakistan with female advantages of 5 and 10 percentage points, respectively. It is interesting to note that Muslim countries such as Bangladesh and Pakistan have female advantage in private enrollment. Perhaps in these countries there is a relatively strong positive correlation between a less patriarchal culture (i.e. less of a bias against females) in the household and the likelihood of sending children to private school.
12. Private school enrollment is concentrated in urban areas and among the wealthiest households. Figure 1 shows stark contrasts between rural and urban areas, and between the lowest and highest income quintiles in India, Nepal and Pakistan, where the majority of private schooling is unsubsidized by the government, and therefore subject more directly to household income. Even in rural areas, such as rural Punjab, Pakistan, Andrabi et al. (2007) find disproportionately more private schools in larger and richer villages, and in richer and more literate settlements within villages. Similarly, Cameron (2011) reports that in Dhaka, Bangladesh, even among urban slum households, children of wealthier and better-educated parents are more likely to go to a private primary school. These patterns are consistent with the unsubsidized nature of the majority of private schooling, which calls for the ability to afford the costs, as well as greater availability of supply-side factors such as teachers and infrastructure in more affluent and urban areas. An exception is the rural advantage in the 16-18 age group in Bangladesh, perhaps to an important extent due to the FSSAP initiative that subsidizes secondary schooling for girls in rural areas, and most secondary schools are private aided.
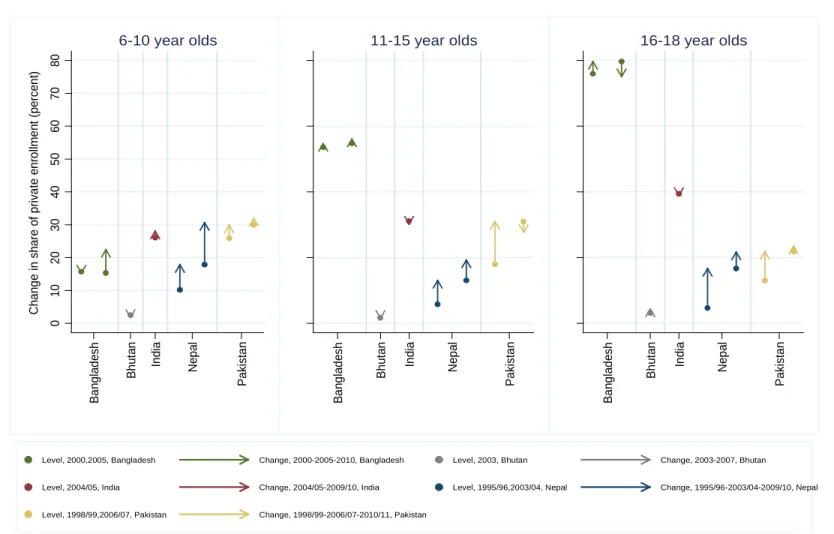
13. Figure 2 shows a snapshot of how private schooling has grown in recent years, according to household survey data. Over a recent period of approximately five years, private school enrollment has increased at a faster rate than total enrollment for all the three age groups in Nepal, and for the 6-10 age group in Bangladesh, while decreasing slightly for the 11-15 age group in Pakistan and the 16-18 age group in Bangladesh and barely changing for the other country- and age-groups. (There is only one year of household survey data for Afghanistan.) Older household survey data reveal that, over a prior period of approximately eight years, the increasing trend in the share of private schooling in Nepal was already present. An increasing trend can also be seen for all the three age groups in Pakistan, and for the 16-18 age group in Bangladesh over this earlier period. Overall, what stands out in the picture is stronger growth in private school enrollment than in total enrollment in some parts of the region in the last decade or so.
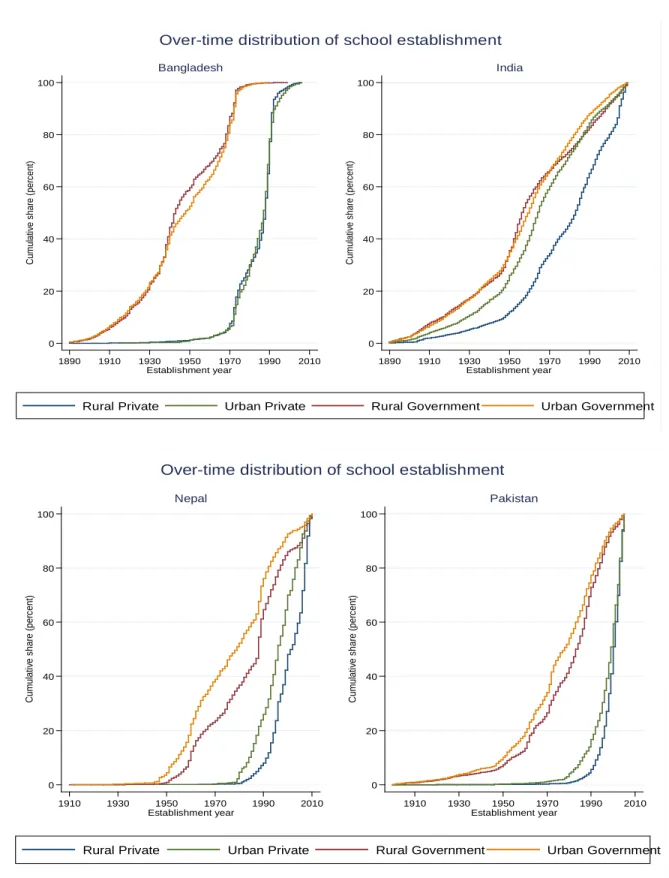
14. To provide further evidence on over-time trends, information on the school establishment date available in school census data for Bangladesh (2006), India (2009/10), Nepal (2009/10) and Pakistan (2005) allows a look at a longer history. Figure 3 shows that most private (aided and unaided) schools are significantly younger than government schools. There could be two reasons for this: (1) private schools have been founded more recently, and (2) private schools have shorter lifetimes. The large age difference between the two school types, combined with the increasing trend in the share of private school enrollment seen in Figure 2, indicates that the expansion of private schooling is a recent phenomenon. The stark increases in private school foundation in Bangladesh in the 1970s and in Pakistan in the 1980s coincide with the reversals of a period of school nationalization in these countries in 1973 and 1979, respectively. The differential in foundation dates is considerably more gradual for India, perhaps because in India privately managed schools date back to the colonial times, and there has been no interrupting school nationalization period as in Bangladesh and Pakistan. Moreover, except in Bangladesh, private schools in rural areas tend to be younger than in urban areas, suggesting stronger recent
8
growth of private schooling in rural areas.
9
Figure 2. Change in enrollment in private schools as a share of total enrollment
Source: Authors, based on household survey data.
01020304050607080
Change in share of private enrollment (percent) Bangladesh Bhutan India Nepal Pakistan
6-10 year olds
Bangladesh Bhutan India Nepal Pakistan
11-15 year olds
Bangladesh Bhutan India Nepal Pakistan
16-18 year olds
Note: Data available for two periods for Bangladesh, Nepal and Pakistan only
Level, 2000,2005, Bangladesh Change, 2000-2005-2010, Bangladesh Level, 2003, Bhutan Change, 2003-2007, Bhutan
Level, 2004/05, India Change, 2004/05-2009/10, India Level, 1995/96,2003/04, Nepal Change, 1995/96-2003/04-2009/10, Nepal
Level, 1998/99,2006/07, Pakistan Change, 1998/99-2006/07-2010/11, Pakistan
10
Figure 3. Establishment of private schools over time
Source: Authors, based on data from the Primary School Census 2006 for Bangladesh, District Information System for Education 2009/10 for India (not including Uttar Pradesh and Madhya Pradesh), Flash Data 2009/10 for Nepal, and Primary and Secondary School Census 2005 for Pakistan.
0 20 40 60 80 100
Cumulative share (percent)
1890 1910 1930 1950 1970 1990 2010
Establishment year Bangladesh
0 20 40 60 80 100
Cumulative share (percent)
1890 1910 1930 1950 1970 1990 2010
Establishment year India
Over-time distribution of school establishment
Rural Private Urban Private Rural Government Urban Government
0 20 40 60 80 100
Cumulative share (percent)
1910 1930 1950 1970 1990 2010
Establishment year
Nepal
0 20 40 60 80 100
Cumulative share (percent)
1910 1930 1950 1970 1990 2010
Establishment year
Pakistan
Over-time distribution of school establishment
Rural Private Urban Private Rural Government Urban Government
11
Figure 4. Change in distribution of private school enrollment across income quintiles
Source: Authors, based on household survey data.
Notes: For each country, the five arrow origin points add up to 100% of private school enrollment in the earlier period, and the five arrow head points add up to 100% of private sector enrollment in the later period.
010203040506070
Change in distribution of private enrollment by income quintile (percent) Bangladesh India Nepal Pakistan
Income quintiles (poorest to richest) for each country
6-10 year olds
Bangladesh India Nepal Pakistan
Income quintiles (poorest to richest) for each country
11-15 year olds
Bangladesh India Nepal Pakistan
Income quintiles (poorest to richest) for each country
16-18 year olds
Level, 2005, Bangladesh Change, 2005-2010, Bangladesh Level, 2004/05, India Change, 2004/05-2009/10, India
Level, 2003/04, Nepal Change, 2003/04-2009/10, Nepal Level, 2006/07, Pakistan Change, 2006/07-2010/11, Pakistan
12
15. Consistent with the stronger recent growth of private schooling in rural areas indicated by school census data, Figure 4 shows an equalizing trend in the growth of private schooling in a recent period of approximately five years in each country, based on household survey data. The lower income quintiles account for increasing shares of private schooling while the richest quintile sees a decreasing share, although the lowest quintile still seems at the margin of the phenomenon. (Data is available for Bhutan but the private schooling rate is too low for decompositional analysis). Relatively poorer households have been able and willing to afford more private schooling perhaps because their absolute levels of income and aspirations for their children have increased. Improvements in overall economic and social conditions could also improve the supply of teachers and infrastructures, as well as the ability and drive to organize these supply-side factors into functioning schools. Recent education reform initiatives in the region that have targeted educationally disadvantaged populations may have also contributed to this trend. The FSSAP in Bangladesh and the FAS and PPRS initiatives in Pakistan mentioned above are some examples of such initiatives. Interestingly, Nepal and Pakistan, the two countries with the largest shares of unaided private schools, saw the starkest equalization in the demonstrated period, suggesting that increased affordability and desperation for quality in the face of poor government services may be important underlying factors.
c. Prevalence and socio-economic patterns of outside-classroom tutoring in Bangladesh, India, Nepal, Pakistan and Sri Lanka, as reported in household and school surveys, and over-time evolution of outside-classroom tutoring in Bangladesh, as reported in household surveys
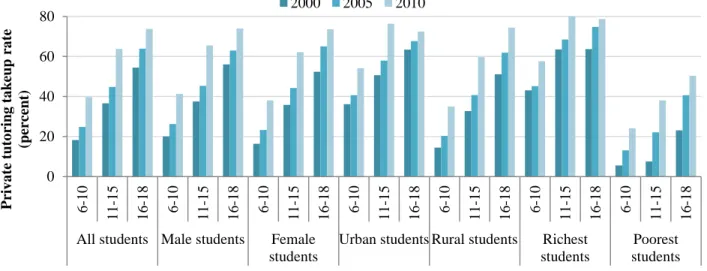
Figure 5. Growth in outside-classroom tutoring in Bangladesh
Source: Authors, based on data from the Household and Income Expenditure Survey (HIES).
16. Outside-classroom tutoring is a common phenomenon in most countries in the region, as reported in available household survey data and the existing literature. Information on tutoring is reported in household surveys for Bangladesh and Nepal. (It is also reported for Bhutan but not discussed here as tutoring in Bhutan is prohibited by law and the rate is less than 1%.) Figure 5 shows that, in Bangladesh, over a period of 10 years, the tutoring take-up rate among students
0 20 40 60 80
6-10 11-15 16-18 6-10 11-15 16-18 6-10 11-15 16-18 6-10 11-15 16-18 6-10 11-15 16-18 6-10 11-15 16-18 6-10 11-15 16-18
All students Male students Female students
Urban students Rural students Richest students
Poorest students Private tutoring takeup rate (percent)
2000 2005 2010
13
enrolled in all school types increased by 117% (from 18% to 40%) for the 6
–10 age group, 74%
(from 37% to 64%) for the 11-15 age group, and 36% (from 54% to 74%) for the 16-18 age group. This upward trend has happened in all sections of the population, with higher rates and greater magnitudes of increase among the rural and poor than the urban and wealthy, respectively. The equalizing trend coincides with that in private schooling discussed in the previous section, except that the poorest seem less at the margin here, perhaps because tutoring is less costly than private schooling and because the poorest households that choose to send their children to school are also willing to invest in other ways. This is also consistent with the finding by Cameron (2011) that even in slum areas in Dhaka, Bangladesh, almost half of school-going children take tutoring. Similarly, in Table 2, Nepal household survey data shows that students from urban and wealthier households take more tutoring, but the rates are relatively considerable for students from rural and poor households as well. (In both Bangladesh and Nepal, tutoring is virtually non-existent (0.3% or less) among out-of-school children.) Similar patterns are found for rural areas in India and Pakistan by Aslam and Atherton (2012) based on data from the 2007/08 SchoolTells survey for India and the 2010 Annual Status of Education Report (ASER) for Pakistan, and also for Sri Lanka by Glewwe and Jayachandran (2006), using data from the 2003 National Education Survey. Aslam and Atherton (2012) find that 22.6% of children of ages 3-16 in India take tutoring, and the rate is 15.7% in Pakistan. As for Sri Lanka, Glewwe and Jayachandran (2006) report that 78% of fifth-graders receive tutoring.
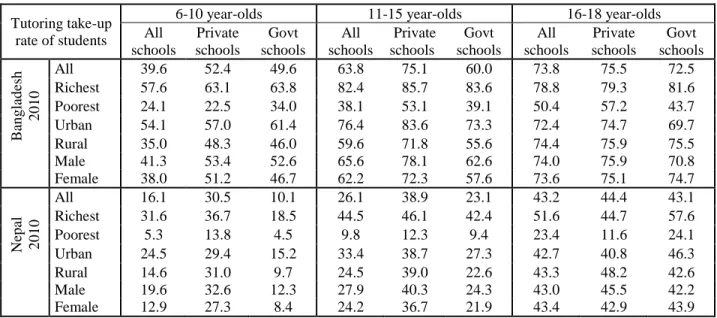
Table 2. Socio-economic patterns of outside-classroom tutoring among students in Bangladesh and Nepal Tutoring take-up
rate of students
6-10 year-olds 11-15 year-olds 16-18 year-olds
All schools
Private schools
Govt schools
All schools
Private schools
Govt schools
All schools
Private schools
Govt schools
Bangladesh 2010
All 39.6 52.4 49.6 63.8 75.1 60.0 73.8 75.5 72.5
Richest 57.6 63.1 63.8 82.4 85.7 83.6 78.8 79.3 81.6
Poorest 24.1 22.5 34.0 38.1 53.1 39.1 50.4 57.2 43.7
Urban 54.1 57.0 61.4 76.4 83.6 73.3 72.4 74.7 69.7
Rural 35.0 48.3 46.0 59.6 71.8 55.6 74.4 75.9 75.5
Male 41.3 53.4 52.6 65.6 78.1 62.6 74.0 75.9 70.8
Female 38.0 51.2 46.7 62.2 72.3 57.6 73.6 75.1 74.7
Nepal 2010
All 16.1 30.5 10.1 26.1 38.9 23.1 43.2 44.4 43.1
Richest 31.6 36.7 18.5 44.5 46.1 42.4 51.6 44.7 57.6
Poorest 5.3 13.8 4.5 9.8 12.3 9.4 23.4 11.6 24.1
Urban 24.5 29.4 15.2 33.4 38.7 27.3 42.7 40.8 46.3
Rural 14.6 31.0 9.7 24.5 39.0 22.6 43.3 48.2 42.6
Male 19.6 32.6 12.3 27.9 40.3 24.3 43.0 45.5 42.2
Female 12.9 27.3 8.4 24.2 36.7 21.9 43.4 42.9 43.9
Source: Authors, based on latest household survey data.
Notes: “All schools” refers to schools of all types - private, government and others.
17. Students in both government and private schools get tutored, with generally higher rates for older students (most probably due to high-stakes examinations), for boys, and for private school students. Aslam and Atherton (2012) find similar patterns for India and Pakistan. The gender divide here differs from that for the private share of total enrollment that we observed above. Given that boys get more tutoring even among those enrolled in private school, it is unclear this is due to a bias that favors boys, or due to weaker learning among boys, or both.
Similarly, it is unclear if the high prevalence of tutoring among private school students is
14
because the income and aspirations that drive households to choose private schooling also drive them to get tutoring for their children, or because private schooling, though often preferred to government schools, also suffers from important deficiencies, or both.
III. Private sector engagement and student achievement in South Asia
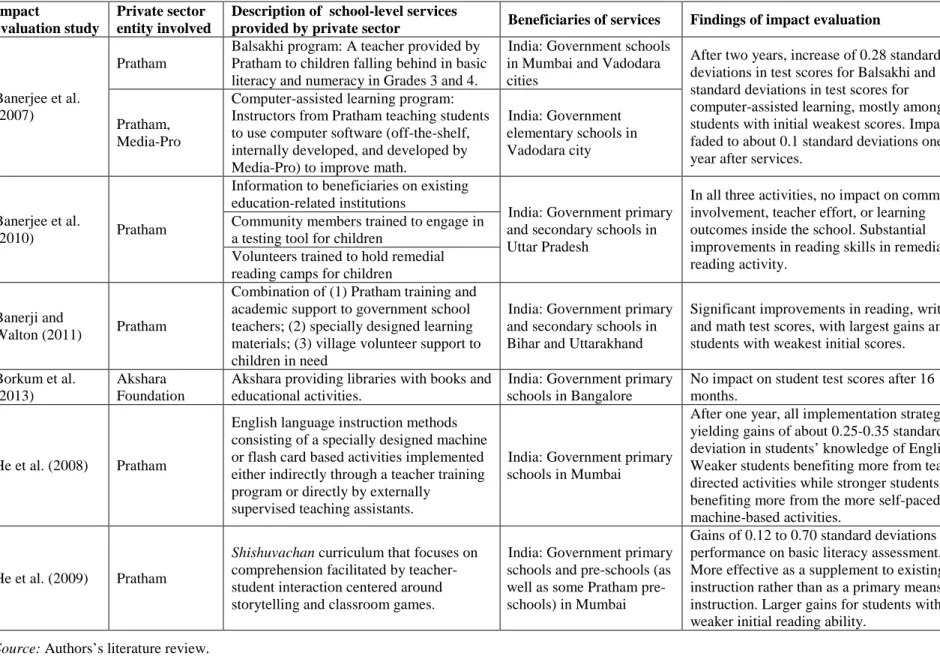
18. In this section, we present evidence of student achievement, as measured in terms of test scores, associated with the different types of private sector engagement. The order of the subsections follows roughly the order of the types listed in Table 1, with some adjustments to facilitate discussion of underlying factors and policy implications. The subsection titles mention the countries for which evidence is available. For each type of private sector engagement, there may be countries that are discussed in the previous section with regards to the type’s extent, socio-economic patterns and over-time evolution, but not discussed in this section due to lack of evidence with regards to student achievement. For a richer and more complete discussion, we refer to examples and evidence from outside of South Asia where possible and relevant.
Muralidharan and Sundararaman (2013) point out the importance of the choice of subjects for measuring and comparing test scores due to potentially higher-than-average performance in high-stakes subjects, or due to different schools focusing on different subjects. We are not able to address this issue in our paper, and acknowledge the limitation.
III.a. Unaided private schools in India, Nepal and Pakistan (Type (1) in Table 1)
19. A number of studies, mostly on India (see, for example, Kingdon, 2007; Muralidharan and Kremer, 2007; Tooley and Dixon, 2007; Goyal, 2009; Desai et al., 2009; Tooley, 2009;
French and Kingdon, 2010; Goyal and Pandey, 2011) and some on Pakistan and Nepal (for example, Andrabi et. al., 2007; Aslam, 2009; Thapa, 2011), find that unaided schools perform poorly but on average at least as well as government schools. Figure 6 presents the distributions of several test score datasets for the three countries. For India, the first dataset is criterion- referenced scores from the 2009 internationally standardized test
6PISA administered to a sample of 15-year-olds at their schools in the states of Himachal Pradesh and Tamil Nadu. The second dataset is criterion-referenced scores from a short standardized test administered to 8–11 year- olds from a nationally representative sample of households in 2004/05. For Nepal, the scores are of a nationally representative sample of students who appeared for the 2004 nationwide SLC test at the end of grade 10. And the dataset for Pakistan is percentages of correct answers on standardized tests conducted at the school of Grade 4 students in rural areas in three Punjab districts in 2006 (Andrabi et al., 2007). The “aided” and “unaided” categories are defined for India only; the vast majority of private schools in Nepal and Pakistan are unaided, as mentioned in the previous section. Across the graphs, the score distribution is more to the right for students in unaided schools than for students in government schools, although both school types have academically strong and weak students.
6 For standardized tests, the questions, conditions for administering, scoring procedures and interpretations are consistent with a predetermined standard framework. There are two types of standardized test score interpretations:
the norm-referenced interpretation compares a student’s test score to the scores of other students who have taken the test while the criterion-referenced interpretation compares a student’s test score to a pre-defined set of criteria.
15
Figure 6. Distribution of test scores of students in government and private schools a) 15-year-olds, 2009, Himachal Pradesh and Tamil Nadu, India: PISA Test
b) 8–11 year-olds, 2004–05, India: India Human Development Survey
0.002.004.006.008Frequency distribution
100 200 300 400 500 600
Standardized score Reading
100 200 300 400 500 600
Standardized score Math
100 200 300 400 500 600
Standardized score Science
Government Private aided Private unaided
0 20 40 60 80
Not read Read letterRead word Read
paragraphRead story
Reading
0 20 40 60 80
Not recognize
number Recognize
number Do subtraction Do division
Arithmetics
Government Private aided Private unaided
0 20 40 60 80
Write with 3 or more
mitakes Writes with 2 or less mistakes
Writing
16
c) Grade 10 Students, 2004, Nepal: School Leaving Certificate (SLC) examination
d) Grade 4 Students, 2006, Rural Punjab, Pakistan: Learning and Educational Achievement in Pakistan Schools (LEAPS) survey
Source: Authors, based on data from student assessments.
0.01.02.03.04Frequency distribution
0 20 40 60 80 100
Total SLC Score out of 100 Nepali
0 20 40 60 80 100
Total SLC Score out of 100 English
0 20 40 60 80 100
Total SLC Score out of 100 Mathematics
0 20 40 60 80 100
Total SLC Score out of 100 Science
Government Private
0.01.02.03
Frequency distribution
0 20 40 60 80 100
English score English
0 20 40 60 80 100
Urdu score Urdu
0 20 40 60 80 100
Math score Mathematics
Government Private
17
20. It is important to note that even among unaided school students, in India, only about 30%
of 8–11 year-olds can perform a division, and around 50% can read a story. At the end of grade 10, Nepalese private school students score more than 50% on some SLC tests and more than 60% on some other SLC tests on average, with a considerable share scoring lower than 50%;
weaker students are left out of this picture as they did not even make it to grade 10. In rural Punjab, Pakistan, on average Grade 4 students in private schools answer only about 45% of the test questions correctly. These patterns remain when we average test scores at the school level, indicating that they are not driven by a correlation between student achievement and school size.
Table 3. Gender and locational patterns of test scores of students in government and private schools India, 8–11 year-olds: India HD Survey, 2004/05
Math Writing Reading
Private Diff (Pvt-Govt) Private Diff (Pvt-Govt) Private Diff (Pvt-Govt)
All 68.8 24.5*** 81.5 16.5*** 72.5 20.1***
(0.82) (0.99) (0.68) (0.87) (0.78) (0.96)
Male 68.8 22.2*** 82.0 16.2*** 71.4 17.6***
(1.07) (1.33) (0.89) (1.16) (1.04) (1.30)
Female 68.7 26.9*** 80.7 16.5*** 74.1 23.1***
(1.26) (1.49) (1.07) (1.32) (1.18) (1.43)
Urban 72.9 17.8*** 83.7 10.6*** 76.3 14.0***
(1.07) (1.67) (0.89) (1.45) (1.02) (1.61)
Rural 64.1 22.3*** 79.0 15.9*** 68.3 18.2***
(1.23) (1.38) (1.05) (1.21) (1.19) (1.34) Nepal, Grade 10: SLC Exam, 2004
Math Nepali English Science
Private Diff (Pvt-Govt) Private Diff (Pvt-Govt) Private Diff (Pvt-Govt) Private Diff (Pvt-Govt)
All 56.5 24.7*** 52.4 10.0*** 67.0 27.8*** 64.3 18.8***
(0.35) (0.38) (0.19) (0.21) (0.23) (0.25) (0.22) (0.24)
Male 59.3 25.0*** 52.2 9.3*** 67.7 27.7*** 65.8 19.0***
(0.44) (0.49) (0.24) (0.27) (0.28) (0.32) (0.28) (0.31)
Female 52.5 23.6*** 52.7 10.9*** 65.9 27.8*** 62.2 18.2***
(0.55) (0.59) (0.29) (0.32) (0.38) (0.41) (0.35) (0.38)
Urban 59.4 24.2*** 53.1 8.6*** 69.6 27.4*** 66.1 18.8***
(0.43) (0.52) (0.23) (0.29) (0.26) (0.34) (0.27) (0.34)
Rural 51.6 21.0*** 51.2 9.6*** 62.4 24.3*** 61.3 16.4***
(0.57) (0.59) (0.30) (0.32) (0.40) (0.42) (0.37) (0.39) Rural Punjab, Pakistan, Grade 4: LEAPS Survey, 2006
Math Urdu English
Private Diff (Pvt-Govt) Private Diff (Pvt-Govt) Private Diff (Pvt-Govt)
All 44.0 9.4*** 46.0 12.0*** 45.7 13.0***
(0.31) (0.38) (0.33) (0.40) (0.27) (0.33) Male 44.6 8.3*** 44.3*** 11.4*** 44.9 13.7***
(0.42) (0.52) (0.44) (0.54) (0.36) (0.44) Female 43.3 10.8*** 48.2*** 12.7*** 46.8 12.1***
(0.45) (0.54) (0.50) (0.59) (0.40) (0.48) Source: Authors, based on data from student assessments.
Notes: In India, figures refer to the share of students who can do at least one subtraction (math); write with three or fewer mistakes (writing); and read a paragraph or story (reading). In Nepal, figures refer to mean scores out of a maximum of 100 in each subject. In Pakistan, figures are the percentages of questions correctly answered.