https://doi.org/10.5194/acp-17-12743-2017-supplement
© Author(s) 2017. This work is distributed under the Creative Commons Attribution 3.0 License.
Supplement of
Assessment of upper tropospheric and stratospheric water vapor and ozone in reanalyses as part of S-RIP
S. M. Davis et al.
Correspondence to:Sean M. Davis (sean.m.davis@noaa.gov)
The copyright of individual parts of the supplement might differ from the CC BY 3.0 License.
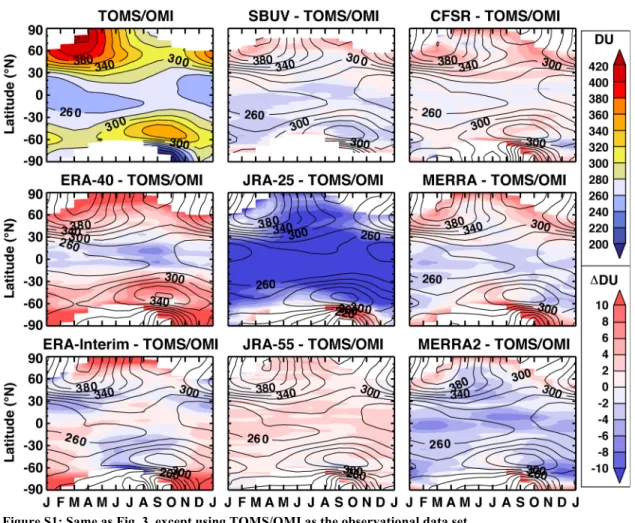
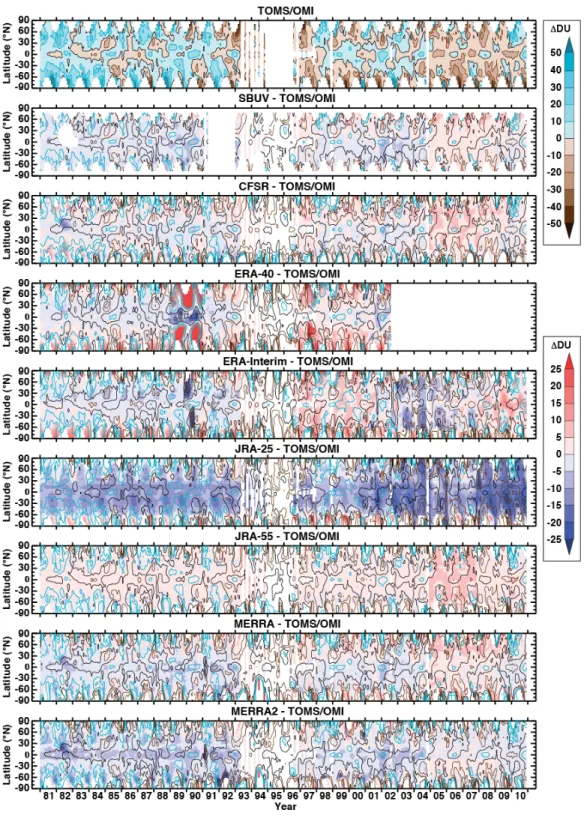
Figure S1: Same as Fig. 3, except using TOMS/OMI as the observational data set.
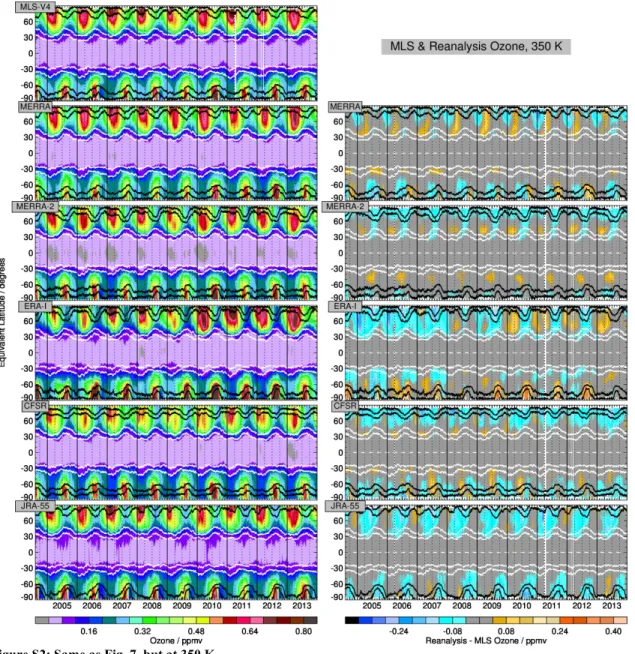
Figure S2: Same as Fig. 7, but at 350 K.
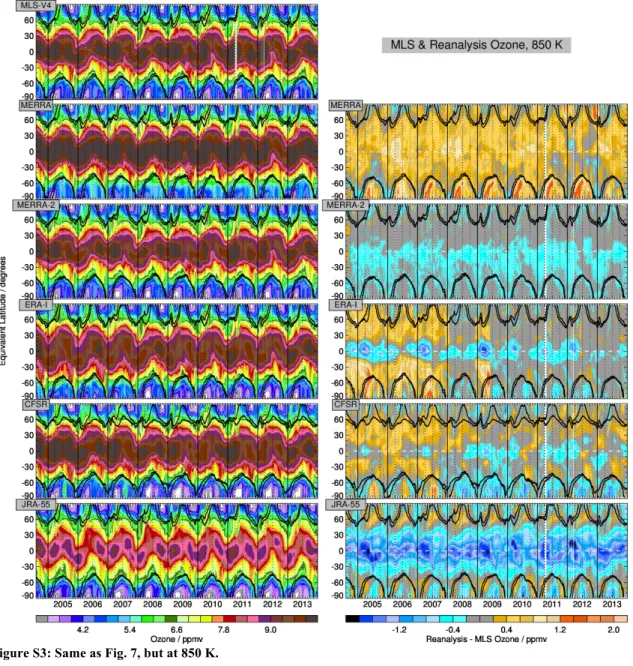
Figure S3: Same as Fig. 7, but at 850 K.
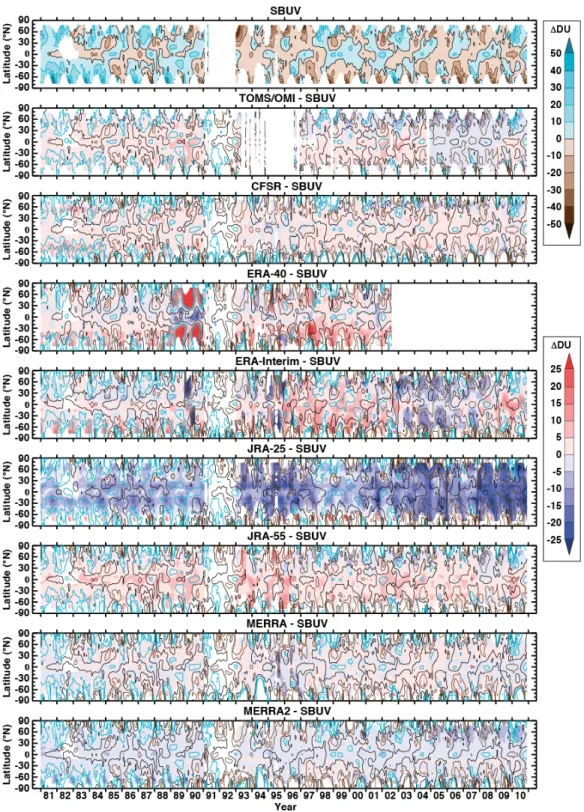
Figure S4: TCO latitude vs. time anomalies for SBUV (top row), differences between TOMS/OMI and SBUV (second from top), and differences between SBUV and the reanalyses (other rows).
Figure S5: TCO latitude vs. time anomalies for TOMS/OMI (top row), differences between SBUV and TOMS/OMI (second from top), and differences between TOMS/OMI and the reanalyses (other rows).