This content has been downloaded from IOPscience. Please scroll down to see the full text.
Download details:
IP Address: 98.206.160.128
This content was downloaded on 14/02/2017 at 14:05 Please note that terms and conditions apply.
Impact of Madden-Julian Oscillation (MJO) on global distribution of total water vapor and column ozone
View the table of contents for this issue, or go to the journal homepage for more 2017 IOP Conf. Ser.: Earth Environ. Sci. 54 012034
(http://iopscience.iop.org/1755-1315/54/1/012034)
Home Search Collections Journals About Contact us My IOPscience
You may also be interested in:
The relative impacts of El Niño Modoki, canonical El Niño, and QBO on tropical ozone changes since the 1980s
Fei Xie, Jianping Li, Wenshou Tian et al.
Diverse policy implications for future ozone and surface UV in a changing climate A H Butler, J S Daniel, R W Portmann et al.
Monitoring of atmospheric trace gases, clouds, aerosols and surface properties fromUV/vis/NIR satellite instruments
T Wagner, S Beirle, T Deutschmann et al.
Impact of future nitrous oxide and carbon dioxide emissions on the stratospheric ozone layer Richard S Stolarski, Anne R Douglass, Luke D Oman et al.
The recycling rate of atmospheric moisture over the past two decades (1988–2009) Liming Li, Xun Jiang, Moustafa T Chahine et al.
Etching of Germanium with Water Vapor Morio Inoue
Climate and Habitability of Kepler 452b Simulated with a Fully Coupled Atmosphere–Ocean General Circulation Model
Yongyun Hu, Yuwei Wang, Yonggang Liu et al.
Differential absorption lidar probing of atmospheric ozone P C S Devara, P Ernest Raj, G Pandithurai et al.
Impact of Madden-Julian Oscillation (MJO) on global distribution of total water vapor and column ozone
Irvan Fathurochman1*, Sandro W Lubis2 and Sonni Setiawan1
1 Department of Geophysics and Meteorology, Bogor Agricultural University (IPB), Indonesia
2 Physics of the Atmoshpere, GEOMAR Helmholtz Centre for Ocean Research Kiel, Germany
E-mail: irvan.fathur@gmail.com
Abstract. The Madden-Julian Oscillation (MJO) is the leading mode of intra-seasonal variability in the tropical troposphere, characterized by an eastward moving 'pulse' of cloud and rainfall near the equator. In this study, total precipitable water (TPW) and total column ozone (TCO) datasets from ECMWF ERA-Interim reanalysis were used to analyse the impact of the MJO on the distribution of water vapor and column ozone in the tropics from 1979 to 2013.
The results show that seasonal variations of TPW modulated by the MJO are maximized in the tropics of about 10°S-10°N during boreal winter, while the variation in TCO is maximized in the mid-latitudes of about 30°S - 40°N in the same season. The composite analysis shows that MJO modulates TPW and TCO anomalies eastward across the globe. The underlying mechanism of the MJO’s impact on TPW is mainly associated with variation of tropical convection modulated by the MJO, while the underlying mechanism of the MJO’s impact on TCO is mainly associated with an intra-seasonal variability of tropopause height modulated by the MJO activity. This knowledge helps to improve the prediction skill of the intra-seasonal variation of water vapor and column ozone in the tropics during boreal winter.
1. Introduction
Tropical atmospheric circulations are controlled by the large-scale convective system varying in space and time, which includes the equatorial planetary waves [1][2][3], intra-seasonal oscillation (MJO) [4], inter-annual oscillation ENSO [5], and decadal to multidecadal oscillation. On sub-monthly to intra-seasonal time scales, interaction between tropical waves and convection may result in unique spatial distributions and frequency characteristics of tropical precipitation [2].
The Madden-Julian Oscillation (MJO) is the leading mode of tropical climate variability on intra- seasonal timescale. MJO is characterized by an eastward moving 'pulse' of large-scale convection system elongated from the Indian Ocean to the Pacific Ocean [6]. This oscillation has an average phase speed of about 5 m s-1 and a period of about 30-90 days [7]. Previous research showed that the MJO can be identified by parameters of convection and other variables in the atmosphere, such as outgoing longwave radiation (OLR), precipitation, sea surface temperature, variations in wind, water vapor, and ozone [8][9][10].
This study examined the impact of the MJO on the distribution of total precipitable water (TPW) and total column ozone (TCO) in tropics, comprehensively. TPW is defined as the amount of water vapor contained in a vertical column of the atmosphere as measured from the surface to the top of the atmosphere [11]. Zhang [7] further explained that the intra-seasonal variation of water vapor in the LISAT IOP Publishing IOP Conf. Series: Earth and Environmental Science 54(2017) 012034 doi:10.1088/1755-1315/54/1/012034
International Conference on Recent Trends in Physics 2016 (ICRTP2016) IOP Publishing
Journal of Physics: Conference Series 755 (2016) 011001 doi:10.1088/1742-6596/755/1/011001
troposphere modulated by the MJO could influence the impact of MJO on rainfall variability. In addition, TCO is defined as the total amount of ozone contained in a vertical column in the atmosphere from the surface to the top of the atmosphere [12]. More than 90% of the ozone in the atmosphere is in the stratosphere and the remaining of about 10% is in the troposphere. The ozone concentrations in the stratosphere are varying in latitude and height. Ozone is produced predominantly in tropical latitudes through a photochemical process [13].
To date, studies related to the influence of MJO on the distribution of water vapor and column ozone in the tropics has been very limited. Therefore, this study aims to investigate a possible impact of MJO on intra-seasonal variation of TPW and TCO in the tropics, and the associated underlying mechanisms.
2. Methods
The datasets used in this study are total precipitable water (TPW), total column ozone (TCO), zonal wind and meridional wind at 850 mb, and geopotential height at 150 mb obtained from ECMWF Reanalysis (ERA-Interim) [14]. Outgoing longwave radiation (OLR) dataset from NOAA [15] was used as the main proxy of convection. MJO events was identified using Real Time Multivariate (RMM) indices derived from the BOM Australia [16]. The data is the daily data with a 35-year period (January 1979 to December 2013) at 30°N - 30°S and at 40°N - 40°S (for TCO and geopotential height) in a band of tropics with spatial resolution of 2.5° x 2.5°.
2.1. Bandpass Filter
Intra-seasonal signal of MJO was isolated from daily data by applying a Butterworth bandpass-filter technique with period of (20-90) days. Filtering procedure is performed on a daily anomaly data over the period of 1979-2013.The anomalies were detrended by removing a linear trend in the data.
2.2. Seasonal Variance Analysis
Seasonal variance analysis is used to examine the spatial distribution intra-seasonal MJO oscillation.
This analysis was performed by calculating the variance of each season of filtered anomaly data (20- 90 days). The filtered anomalies were grouped into different season i.e., summer (NDJFMA) and winter (MJJASO).
2.3. Space-Time Spectral Analysis
Space-time spectral analysis (STSA) is used to analyze the wavy-like disturbances in the tropics that either propagates eastward or westward. This method decomposes the anomalous field in space and time as a function of wavenumber (k) and frequency () [17][18]. The decomposition is conducted based on 2D Fourier transformation (in space and time domains).
2.4. Composite Analysis
Composite analysis is used to see the distribution of the data (TPW, OLR, and TCO) filtered anomaly (20-90 days) in each MJO events (8 phases). This composite technique is an ensemble average, the arithmetic average value of a set of data but in the same conditions.
3. Results
3.1. Intraseasonal Variance Related to MJO
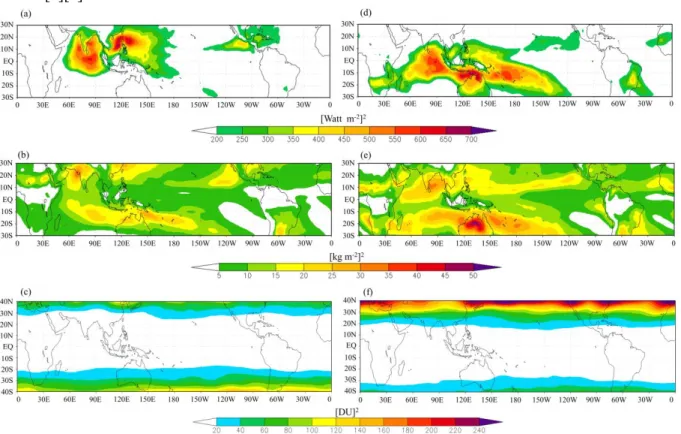
Figure1 shows seasonal variance of MJO in (a,d) OLR, (b,e) TPW, and (c,f) TCO for both boreal summer and winter. Consistent with previous studies, MJO signals are generally stronger in the equator, from the Indian Ocean to the Western Pacific Ocean [8]. In particular, during the boreal summer (figure 1a), the MJO signal in OLR is strongly observed from the northern Indian Ocean to the western Pacific Ocean, while during boreal winter (figure 1b) the higher variance of OLR is dominant in the Southern Hemisphere and covering wide area, from the Indian Ocean (50°E) to the
2
LISAT IOP Publishing IOP Conf. Series: Earth and Environmental Science 54(2017) 012034 doi:10.1088/1755-1315/54/1/012034
eastern Pacific Ocean (about 120°E). The differences in MJO signal between boreal winter and summer is mainly due to the seasonal movement of the sun and the associated convective systems.
Nevertheless, the stronger MJO activity is observed during boreal winter, consistent with previous studies [6][7].
Figure 1. Intraseasonal variance associated with MJO (filtered (20-90 days)) for OLR, TPW, and TCO during (a-c) boreal summer and (d-f) boreal winter.
3.1.1. Intraseasonal Variance of TPW. The intra-seasonal variance of TPW exhibits different patterns compared to OLR variance. Figure 1(b,e) can be seen as the regions where the TPW are strongly affected by MJO activity. This result indicates that the effect of intraseasonal oscillation on TPW is stronger over the off equatorial region. According to Schreck et al [9], the intra-seasonal of water vapor is more sensitive to air mass subsidence of latitudes around the equator, but the higher variance can be seen over the Indian Ocean to the Western Pacific. During summer (figure 1b), a higher variance of TPW exist near the Northern Indian Ocean (10°N) and covering wide area in 15°S. During winter (figure 1e), the intraseasonal variance of TPW becomes stronger and maximizes between 10°N and 15°S over 50°E-120°W.
3.1.2. Intraseasonal Variance of TCO. Figure 1(c,f) shows the intraseasonal variance of TCO anomaly. In general, higher variance of TCO exist in mid-latitudes about 30°-40° both the Northern and the Southern Hemisphere. This is associated with the mean condition of TCO that is higher in mid-latitudes than in the tropics [10]. The seasonal distribution of ozone tends to be increased during the winter, and on the contrary, it is relatively decreased during summer in the mid-latitudes [13].
During summer (figure 1c), higher variance of TCO exists in the subtropical Southern Hemisphere. On the other hand, during winter (figure 1f) the higher variance of TCO maximizes in the subtropical Northern Hemisphere. In general, it suggests that the effect of intraseasonal oscillations on TCO is stronger in the mid-latitudes and during the winter, while the effect over the tropics is relatively weaker.
LISAT IOP Publishing IOP Conf. Series: Earth and Environmental Science 54(2017) 012034 doi:10.1088/1755-1315/54/1/012034
3.2. Wavenumber-Frequency Spectraof Seasonal MJO
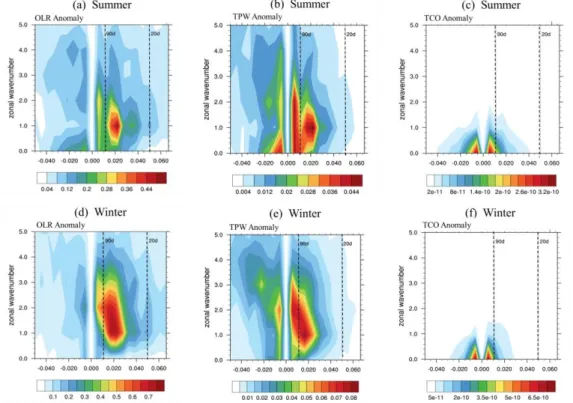
Figure 2 shows the power spectrum of OLR, TPW and TCO anomalies for both winter and summer.
The positive (negative) frequency indicates an eastward (westward) propagation. MJO signals in OLR anomalies (figure 2a,d) are dominant on intraseasonal period (frequency). In particular, the power spectra pattern of OLR anomalies tends to be stronger in boreal winter (figure 2d) than boreal summer (figure 2a). This pattern consistent with previous studies showing that the MJO signal on OLR anomalies was detected in intraseasonal period and with a zonal wavenumber 1-3 [8][18].
3.2.1. Wavenumber-Frequency Spectra of TPW. MJO signal on TPW anomalies shows a similar pattern with OLR anomalies (figure 2b,e). As in OLR, the power spectra of TPW anomalies associated with MJO seems to be stronger in boreal winter than boreal summer. The power spectra of TPW anomalies are stronger on intraseasonal scale (20-90 days), with zonal wavenumber (k) about +1 to +4, indicating an eastward propagation [9]. In boreal summer (figure 2b), power spectra of TPW anomalies peak on a frequency of 0.025-0.0125 day-1 or about 40-80 days. On the other hand, during winter, the power spectra are stronger and maximize in a frequency of about 0.025 – 0.011days-1 or 40- 90 days.
3.2.2. Wavenumber-Frequency Spectra of TCO. Figure 2 (c,f) shows the space-time spectra analysis result for TCO anomalies. In general, MJO signal in TCO is relatively weaker on intraseasonal timescale (20-90 days). The prominent power spectra of TCO are detected in the period of about larger than 30 days. This indicates that the TCO anomalies in the tropical regions are relatively unaffected or weakly affected by intraseasonal phenomenon such as the MJO. Nevertheless, consistent with the finding of Tian et al [10], MJO activity has a higher relation with the variation of TCO in the subtropics.
Figure 2. Space-time spectral analysis of OLR, TPW, and TCO during (a-c) boreal summer and (d-f) boreal winter.
3.3 Impact of MJO on TPW Distribution
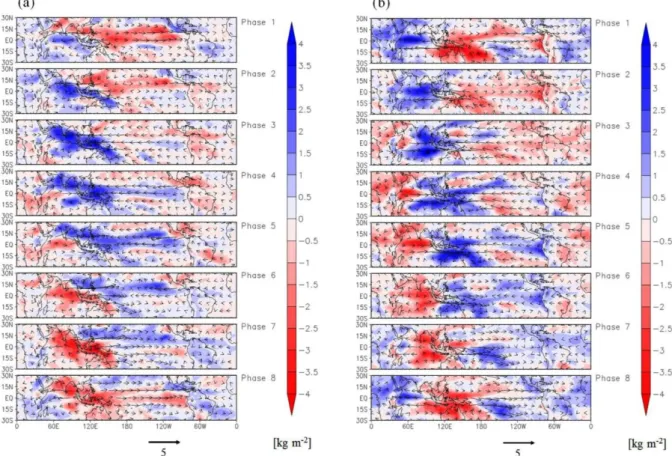
The impact of MJO on TPW anomalies is shown in figure 3 for (a) boreal summer and (b) boreal winter. The positive (negative) TPW anomalies are shown in blue (red) shading, while the 850 mb
4
LISAT IOP Publishing IOP Conf. Series: Earth and Environmental Science 54(2017) 012034 doi:10.1088/1755-1315/54/1/012034
wind anomalies is indicated by arrows. It is shown MJO lead to eastward propagation of TPW anomalies in the tropics. The impact of the MJO on TPW reaches maximum during phases 4 and 5, when the convection is stronger over the maritime continent due to the strengthening of westerlies and easterlies wind from the Indian Ocean and the Western Pacific ocean. The stronger MJO convection causes the stronger TPW distribution, and vice versa. The maximum impact of MJO on TWP is stronger during boreal winter, consistent with previous STSA analysis (figure 2e).
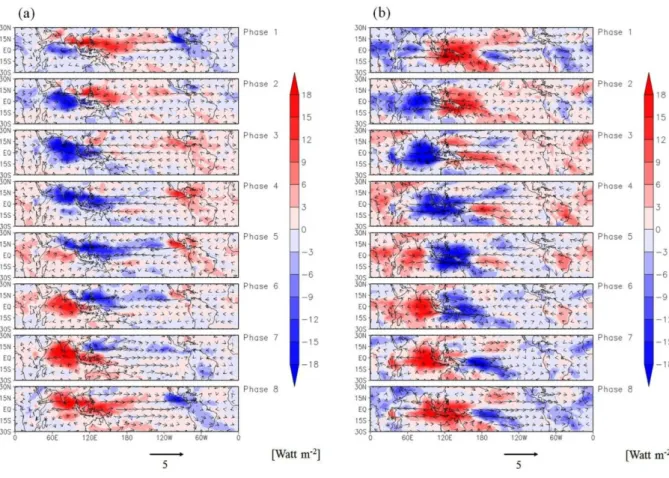
It is well acknowledged that MJO modulates the tropical convection, as shown in OLR anomalies (figure 4). Comparing figure 3 and figure 4, it can be seen that the TPW-MJO pattern is anti-correlated with OLR-MJO pattern. In particular, positive TPW anomalies coincide with area of enhanced MJO convection, while negative anomalies coincide with suppressed MJO convection (figure 5). This indicates that MJO convection significantly affects the distribution of TPW anomalies (figure 5).
Based on this composite results, we conclude that the underlying mechanism of MJO’s impact on TPW is mainly associated with tropical convection modulated by the MJO.
Figure 3. Composite of filtered TPW anomalies (shading) and 850 mb wind anomalies (vector) in (a) Boreal summer (b) Boreal winter.
LISAT IOP Publishing IOP Conf. Series: Earth and Environmental Science 54(2017) 012034 doi:10.1088/1755-1315/54/1/012034
Figure 4. As in Fig. 3, but shading indicates filtered OLR anomalies.
Figure 5. Composite of OLR and TPW anomalies for areal average of (a) Indian Ocean (2°S- 1°S and 94°E-97°E), (b) West Borneo (1°S-1°N and 109.5°E-112°E), (c) Java Sea (6°LS-4.5°S and 113°E-118°E), (d) North Java Island (7.5°S-6.5°S and 107°E-108.5 E).
6
LISAT IOP Publishing IOP Conf. Series: Earth and Environmental Science 54(2017) 012034 doi:10.1088/1755-1315/54/1/012034
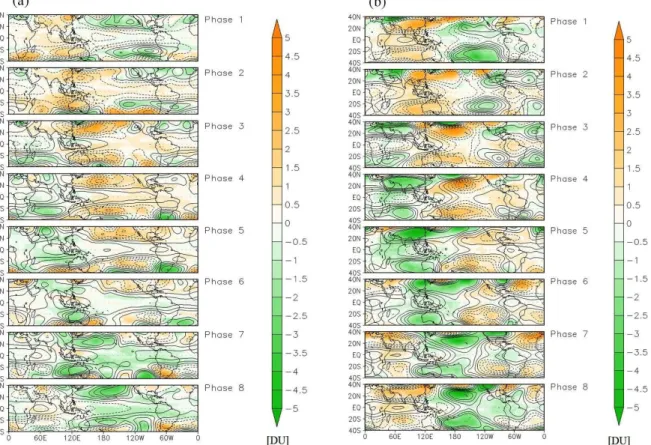
3.3. Impact of MJO on TCO Distribution
Variation of TCO in the atmosphere is controlled by processes that happen in the lower-stratosphere [19]. In this study, the geopotential height anomalies at 150 mb were used to examine the relationship between the fluctuations in the tropopause height and transport of ozone modulated by the MJO activity. Figure 6 shows the composite of TCO and geopotential height anomalies following the MJO phases. It can be seen that MJO lead to eastward movement of TCO and geopotential height in the tropics. The MJO impact on TCO is stronger and maximize during boreal winter (figure 6b) consistent with previous STSA results. In addition, there is a significant anti-correlation relationship between TCO and geopotential height anomalies during MJO phases (figure 7). In particular, positive (negative) TCO anomalies coincide with negative (positive) geopotential height anomalies. This suggests that fluctuations of tropopause height may potentially affect the distribution of ozone in the lower-stratosphere. Our results are in agreement with previous satellite measurement analysis from Tian et al [10], showing a strong relationship between the MJO, TCO and tropopause heights.
A possible mechanism to explain the impact of MJO impact on TCO is as follow: (1) reduction in height of the tropopause layer (characterized by negative anomaly of geopotential height) tends to increase the TCO by replacing the air masses of less ozone in the upper-troposphere with the air of rich ozone in the stratosphere. (2) Conversely, an increasing in height of the tropopause layer (characterized by positive anomalies of geopotential altitude) resulting in decreased of ozone transport from stratosphere to troposphere. This effect is really visible in off equatorial region, between 20°N- 40°N. Moreover, the impact of MJO on TCO in tropical regions is relatively small with the magnitude is only about ± 1 DU, consistent with previous study of Tian et al [10].
Figure 6. Composite of filtered TCO (shading) and 150 mb geopotential height (contour: positive (solid line), negative (dash line)) in (a) Boreal summer (b) Boreal winter.
LISAT IOP Publishing IOP Conf. Series: Earth and Environmental Science 54(2017) 012034 doi:10.1088/1755-1315/54/1/012034
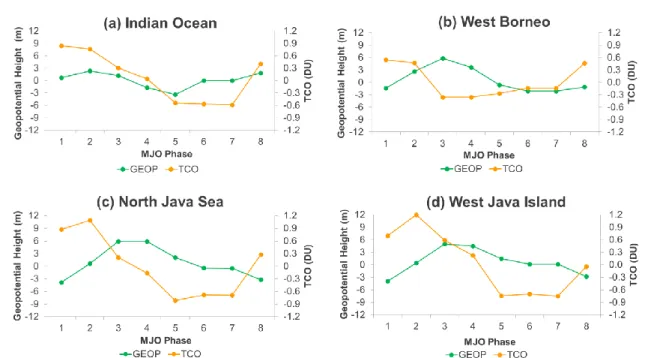
Figure 7. Composite of TCO and 150 mb geopotential height anomalies for areal average of (a) Indian Ocean (2°S-1°S and 94°E-97°E), (b) West Borneo (1°S-1°N and 109.5°E-112°E), (c) Java Sea (6°LS-4.5°S and 113°E-118°E), (d) North Java Island (7.5°S-6.5°S and 107°E).
4. Conclusion
We have examined the impact of MJO on TPW and TCO in the tropics using the ERA-Interim reanalysis dataset from 1979-2013. The MJO signal was isolated by using space-time spectral analysis (STSA) and composite analysis. The key results are summarized as follow:
(1) MJO influences zonal distribution of TPW and TCO anomalies.
(2) The seasonal variations of TPW modulated by the MJO are maximized in the tropics of about 10°-20° in latitude during boreal winter, while the variation in TCO is maximized in the mid-latitudes of about 30°-40° at the same season.
(3) The underlying mechanism of the MJO’s impact on TPW is associated with tropical convection modulated by the MJO, as indicated by anti-correlation relationship between TPW and OLR.
(4) The underlying mechanism of the MJO’s impact on TCO is mainly associated with an intra- seasonal variability of tropopause height modulated by the MJO activity. The positive (negative) anomalies of geopotential height modulated by the MJO are associated with low (high) ozone transport from the stratosphere to the troposphere. In addition, the MJO impact on TCO is more noticeable in subtropical (consistent with the results of STSA).
The results of this research generally indicate that the MJO may affect intra-seasonal variability of TPW and TCO in the tropical region, both in global and regional scales. The results of this study are expected to improve our understanding on the impact of MJO on water vapor and column ozone in both the global and regional scales. This study will hopefully helps to improve the prediction skill of the intra-seasonal variation of water vapor and column ozone in the tropics during boreal winter.
Acknowledgment
We thank ECMWF for providing the ERA-Interim reanalysis dataset. The authors are grateful to Givo Alsepan from the Laboratory of Physical Oceanography and Climate at Hokkaido University, Japan, for his helpful comments and discussion.
8
LISAT IOP Publishing IOP Conf. Series: Earth and Environmental Science 54(2017) 012034 doi:10.1088/1755-1315/54/1/012034
References
[1] Matsuno T 1966 Quasi-geostrophic motions in equatorial area J. Meteor. Soc. Japan 44 25–43 [2] Lubis S W and Jacobi C 2015 The modulating influence of convectively coupled equatorial
waves (CCEWs) on the variability of tropical precipitation Int. J. Climatol. 35 1465–1483 [3] Lubis S W and Setiawan S 2010 Identifikasi Gelombang Kelvin Atmosfer Ekuatorial di
Indonesia Berbasis Data NCEP/NCAR Reanalysis I J. Fisika 10 71–82
[4] Madden R A and Julian P R 1971 Detection of a 40 –50 day oscillation in the zonal wind in the tropical pacific J. Atmos. Sci. 28 702–708
[5] Shienbaum J 2003 Current theories on el nino-southern oscillation: a review Geof. Int. 42 291–
305
[6] Madden R A and Jullian P R 1994 Obsevations of the 40-50-day tropical oscillation-a review Mon. Wea. Rev. 122 814–837
[7] Zhang C 2005 Madden-Julian Oscillation Reviews of Geophysics 43 RG2003 [8] Waliser D et al 2009 MJO simulation diagnostics J. Clim. 22 3006–3030
[9] Schreck C J, Shi L, Kossin J P and Bates J J 2013 Identifying the MJO, equatorial waves, and their impacts using 32 years of HIRS upper tropospheric water vapor J. Clim. 26 1418–1431 [10] Tian B, Yung Y L, Waliser D E, Tyranowski T, Kuai L, Fetzer E J and Irion F W 2007
Intraseasonal variations of the tropical total ozone and their connection to the Madden-Julian Oscillation J. Geophys. Res. 34 1–7
[11] Stull R B 2000 Meteorology for Scientist and Engineer 2nd ed (California: Brooks/Cole)
[12] WMO 2008 Guide to Meteorological Instruments and Methods of Observation 7th ed (Geneva:
World Meteorological Organization)
[13] Mohanakumar K 2008 Stratosphere Troposhpere Interaction: An Introduction (Netherlands:
Springer)
[14] Liebmann B and Smith C A 1996 Description of a complete (interpolated) outgoing longwave radiation dataset Bull. Amer. Meteor. Soc. 77 1275–1277
[15] Dee D P et al 2011 The ERA-Interim Reanalysis: Configuration and Performance of the Data Assimilation System Q. J. R. Meteorol. Soc. 137 553-597
[16] Wheeler M C and Hendon H H 2004 An all-season real-time multivariate MJO index:
Development of an index for monitoring and prediction Mon. Wea. Rev. 132 1917–1932 [17] Hayashi Y 1982 Space-time spectral analysis and its applications to atmospheric waves. J.
Meteor. Soc. Japan 60 156–171
[18] Wheeler M and Kiladis GN 1999 Convectively coupled equatoril waves: analysis of clouds and temperature in the wavenumber-frequency domain J. Atmos. Sci. 56 374–399
[19] NASA 2000 Studying Earth's Environment From Space [cited 2016 May 23]; Available from:
http://www.ccpo.odu.edu/SEES/index.html
LISAT IOP Publishing IOP Conf. Series: Earth and Environmental Science 54(2017) 012034 doi:10.1088/1755-1315/54/1/012034