https://doi.org/10.1007/s00382-018-4328-7
Impact of the MJO on the interannual variation of the Pacific–Japan mode of the East Asian summer monsoon
Xinyu Li1,2,3 · Gereon Gollan3 · Richard J. Greatbatch3,4 · Riyu Lu1,2
Received: 12 January 2018 / Accepted: 26 June 2018 / Published online: 28 June 2018
© The Author(s) 2018
Abstract
The spatial pattern of the first mode of interannual variability associated with the East Asian summer monsoon (EASM), obtained from a multivariate Empirical Orthogonal Functions (MV-EOF) analysis, corresponds to the Pacific–Japan (PJ) pattern and is referred to as the PJ-mode. The present study investigates the interannual variation of the PJ-mode from the perspective of the intraseasonal timescale. In particular, the impact of the Madden–Julian oscillation (MJO) on the interan- nual variation of the PJ-mode is investigated. The results show that the MJO has a significant influence on the interannual variation of the PJ-mode mainly in the lower troposphere (850 hPa) and that the former accounts for approximately 11% of the amplitude of the latter. The major part of the contribution comes from a change in frequency of the different phases of the MJO, especially that of MJO phase 6. This suggests that intraseasonal variation of the convection anomalies over the tropical eastern Indian and western Pacific Oceans plays an important role in the interannual variation of the PJ-mode. In addition, MJO phase 7 also contributes to the interannual variability of the PJ-mode, in this case induced by both the change in frequency and the change in circulation anomalies associated with MJO phase 7.
Keywords East Asian summer monsoon (EASM) · Pacific–Japan pattern · Madden–Julian oscillation (MJO) · Intraseasonal variability, interannual variability
1 Introduction
The East Asian summer monsoon (EASM) is an energetic component of the global climate system, bringing rainfall to East Asia, one of the most densely populated regions in the world. The variability of the EASM on different timescales brings both floods and droughts to East Asia. Investigating
the variability of the EASM is, therefore, of great socio- economic interest.
Multivariate Empirical Orthogonal Functions (MV-EOF) analysis has been used to investigate the interannual and dec- adal variability of the EASM (Wang et al. 2008; Sun et al.
2010; Ding et al. 2014, 2015; Wu et al. 2016). The first EOF corresponds to the Pacific–Japan (PJ) pattern (Nitta 1987) or the East Asian–Pacific pattern (Huang and Sun 1992), a meridional teleconnection pattern over the western North Pacific (WNP) and East Asia that greatly affects summer rainfall in the East Asian (Meiyu/Changma/Baiu) rain band that extends from the Yangtze River valley across Korea and Japan. In the lower troposphere, the positive phase of the first EOF is characterized by an anticyclonic anomaly over the subtropical WNP and a cyclonic anomaly over East Asia, and in the upper troposphere, the first EOF is closely asso- ciated with the meridional displacement of the East Asian westerly jet. The first EOF is referred to as the PJ-mode in this study, following Li et al. (2018).
The interannual variability of the PJ-mode has been extensively studied. It has been reported that the interan- nual variation of the PJ-mode is closely associated with
* Gereon Gollan ggollan@geomar.de
1 State Key Laboratory of Numerical Modeling
for Atmospheric Sciences and Geophysical Fluid Dynamics, Institute of Atmospheric Physics, Chinese Academy of Sciences, Beijing, China
2 University of the Chinese Academy of Sciences, Beijing, China
3 Ocean Circulation and Climate Dynamics, GEOMAR Helmholtz Centre for Ocean Research Kiel, Düsternbrooker Weg 20, 24105 Kiel, Germany
4 Faculty of Mathematics and Natural Sciences, University of Kiel, Kiel, Germany
convection anomalies over the tropical WNP (e.g., Huang and Wu 1989; Lau et al. 2000; Lu 2001a, b; Lin and Lu 2009; Kosaka et al. 2011, 2013; Li and Lu 2017) and the subtropical WNP circulation anomaly in the lower tropo- sphere can be considered as part of a Gill response to the tropical WNP convection anomalies (Lu 2001a; Sun et al.
2010). Sun et al. (2010) noted that the PJ-mode is influenced by tropical diabatic heating anomalies by using a linear, dry dynamical model. In particular, enhanced/reduced heat- ing over the tropical eastern Indian Ocean favors the posi- tive/negative phase of the PJ-mode. On the other hand, El Niño–Southern Oscillation (ENSO) exerts an influence on the subtropical WNP anticyclonic (during decaying El Nino) or cyclonic (during decaying La Nina) anomaly through its effect on convection anomalies over the tropical Indian and Pacific Oceans (e.g., Wang et al. 2000, 2003; Yang et al.
2007; Xie et al. 2009, 2016). While the connection between the PJ-mode and ENSO is only significant during the period after 1979 (Sun et al. 2010; Xie et al. 2010; see; Ding et al.
2014, 2015, for a detailed discussion), even during this period, ENSO only explains 10–20% of the variance of the interannual variability of the PJ-mode, with the highest cor- relation coefficient around 0.40 (see Figs. 10 and 11 in Sun et al. 2010). These findings suggest the interannual variation of the PJ-mode is complex and that tropical variability other than ENSO could play a role.
Most of the aforementioned studies focus on the interan- nual timescales. In addition, the EASM also exhibits pro- found intraseasonal variability (e.g., Chen et al. 2004; Ding 2004, 2005, 2007, Su and Xue 2010). On the intraseasonal timescale, tropical diabatic heating anomalies are mostly provided by the Madden–Julian Oscillation (MJO) (Madden and Julian 1971, 1972) or the closely related Boreal Sum- mer Intraseasonal Oscillation (BSISO), the major modes of intraseasonal variability in the atmosphere over the tropical Indian and western Pacific Oceans. The MJO is character- ized by eastward-propagating convection anomalies in the tropics. During boreal summer, the MJO tends to propagate northeastward in the Asian sector with a period of 25–90 days and strongly influences the climate in East Asia (e.g., Yasunari 1979; Wang et al. 2006, 2017; Zhang et al. 2009;
Zhang 2013; Chen et al. 2015; Lee et al. 2017). Recently, Li et al. (2018) documented that the intraseasonal variation of the PJ-mode is closely associated with the evolution of the MJO. Early MJO phases, when the enhanced convection anomalies are located over the Indian Ocean, favor the posi- tive phase of the PJ-mode and late MJO phases, when the enhanced convection anomalies are located over the western Pacific, favor the negative phase of the PJ-mode. However, Li et al. (2018) show that the positive phase of the PJ-mode cannot totally offset the negative phase of the PJ-mode dur- ing a specific summer (see Fig. 3a in Li et al. 2018 and note that the average over all MJO phases is not zero), suggesting
that the MJO may have an influence on the interannual vari- ation of the PJ-mode. This hypothesis is tested in the present study.
Note that we use the “MJO” here to represent the tropi- cal intraseasonal oscillation during summer, while some authors instead use the “BSISO” (e.g., Wang and Xie 1997;
Wang et al. 2006; Kikuchi et al. 2012; Chen et al. 2015; Lee et al. 2017) during summer and the “MJO” during winter. It should be noted that, unlike the MJO, the definition of the BSISO takes account of subtropical regions in the northern hemisphere, with the consequence that circulation anoma- lies associated with the EASM can directly project onto the BSISO. Therefore, we prefer to discuss the impact of the MJO, which is confined to the equatorial regions, on the PJ-mode in this study.
The rest of this article is arranged as follows: Sect. 2 pre- sents the data and methods used, Sect. 3 gives a brief review on the interannual variation of the PJ-mode and Sect. 4 dis- cusses the impact of the MJO on the interannual variation of the PJ-mode. Section 5 provides a summary and discussion.
2 Data and methods
The present study uses the monthly and daily data from the ERA-Interim dataset (Dee et al. 2011). Also used are monthly precipitation data from NOAA’s Climate Predic- tion Center (CPC) Merged Analysis of Precipitation data (CMAP; Xie and Arkin 1997) and daily mean outgoing longwave radiation (OLR) data from the National Oceanic and Atmospheric Administration (NOAA). The analyses are for boreal summer (June–August) during the period 1979–2015. We also repeated the main analyses using the daily mean OLR Climate Data Record (CDR; available at http://olr.umd.edu/; Lee et al. 2004, 2007) and obtained similar results (not shown).
We use the Real-time Multivariate MJO index (RMM, available at http://www.bom.gov.au/clima te/mjo/graph ics/
rmm.74toR ealti me.txt) defined by Wheeler and Hendon (2004) to present the characteristics of the MJO. The MJO index is obtained by projecting the daily observed data onto the first two leading MV-EOFs of 200 and 850 hPa zonal wind and OLR variability in the tropics (Wheeler and Hen- don 2004). The variables are first meridionally averaged over the band between 15°S and 15°N and the anomalies at each longitude are obtained by removing the mean and the first three harmonics of the annual cycle. Then the ENSO signal is removed from the anomalies by linear regression and finally the 120-day mean of the previous 120 days is subtracted for each day (see Wheeler and Hendon 2004, for the details). There are two components of this index, namely RMM1 and RMM2. These are the standardized principal component time series of the first two EOFs. The MJO has
eight phases according to the angle spanned by RMM1 and RMM2 and the MJO amplitude can be defined as the length of the vector defined by the two components. The active MJO is defined as the amplitude of the MJO index exceeding a threshold of 1.0. In the following, all the analyses related to the MJO refer to the active MJO.
When discussing intraseasonal variability, we utilize, in addition to the MJO, intraseasonal anomalies for various variables. These are obtained by first removing the seasonal cycle by subtracting the first three harmonics of the annual cycle, and then applying a 25–90-day, band-pass Lanczos filter to isolate the intraseasonal variability, similar to the analyses by Kikuchi et al. (2012). We also repeated the main analyses in this study by using a 10–20-day band-pass filter, but the results show weak anomalies and are insignificant (not shown here). Therefore, the 25–90-day band-pass filter is used here.
The MV-EOF analysis concerning the interannual vari- ability of the EASM is carried out on the boreal summer mean wind fields at 850 hPa and 200 hPa over the EASM region 10°–50°N, 100°–150°E during 1979–2015. The region used for the MV-EOF analysis is identical to that used in the previous studies of Sun et al. (2010) and Li et al. (2018). Before the MV-EOF analysis, the interannual anomalies of each variable are first normalized by their area- averaged standard deviation and then weighted by the square root of the cosine of latitude to obtain equal weight to equal areas. The detailed procedure can be found in Wang (1992), Wang et al. (2008) and Sun et al. (2010).
3 Interannual variation of the PJ‑mode
Figure 1 shows the first mode (PJ-mode) associated with the EASM, which explains 20.1% of the variance of zonal wind and meridional wind at 850 and 200 hPa in the EASM region and is significantly distinguished from the higher EOF modes according to North et al. (1982). As expected, the spatial pattern of the PJ-mode strongly resembles the PJ pattern discussed by Nitta (1987) in both lower and upper troposphere. At 850 hPa in the positive phase (Fig. 1a), there is an anticyclonic anomaly over the subtropical WNP and a cyclonic anomaly over mid-latitude East Asia. The anti- cyclonic anomaly, associated with suppressed precipitation anomalies over the tropical WNP, corresponds to a westward extended subtropical high that transports water vapor to East Asia along its northwest flank and results in enhanced rainfall along the East Asian rain band, as previous studies suggested (e.g., Lu 2001a, 2004; Jiang et al. 2017; Hu et al.
2017; Li and Lu 2017). As a result, the rainfall anomalies are characterized by a seesaw pattern between the tropical WNP and the East Asian rain band. At 200 hPa in the posi- tive phase (Fig. 1b), anomalous westerlies appear south of
40°N and anomalous easterlies appear north of this latitude, which corresponds to the equatorward displacement of the East Asian westerly jet (Lin and Lu 2005). All of these fea- tures are consistent with previous studies (e.g., Wang et al.
2008; Sun et al. 2010; Li et al. 2018).
In the following, we choose the 10 most positive and the 10 most negative years of PC1, where PC1 is the principal component time series of the interannual PJ-mode, to perform composite analyses (see the shaded bars in Fig. 1c). These two categories are denoted as positive PJ years and negative PJ years, respectively. There are totally 496 active MJO days for the 10 most positive PJ years and 543 active MJO days for the 10 most negative PJ years. We also repeated the analyses based on other criteria, such as based on plus and minus 0.7 or 1.0 standard deviation, and obtained similar results. How- ever, to keep similar sample sizes of active MJO days in both categories, we prefer to show the results based on the 10 most positive and the 10 most negative years of PC1.
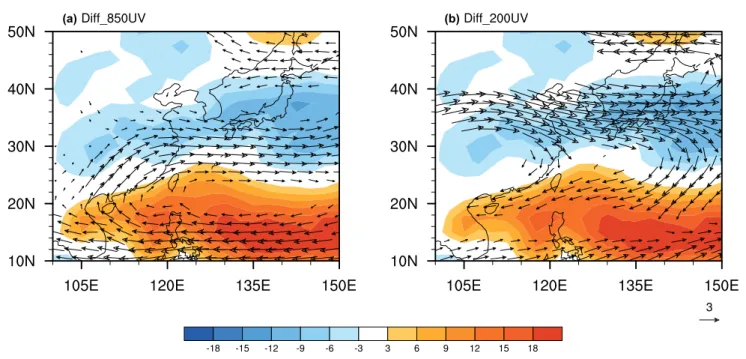
Figure 2 shows the composite difference of OLR anoma- lies and wind anomalies at 850 and 200 hPa between the positive and negative PJ years. The circulation differences, which represent the interannual variation of the PJ-mode, expectedly show the spatial pattern of the PJ-mode at both 850 and 200 hPa (Fig. 1a, b vs. Fig. 2a, b). Correspond- ingly, suppressed OLR anomalies appear over the tropical WNP and enhanced OLR anomalies appear along the East Asian rain band. Although the interannual variation of the PJ-mode has been investigated in many previous studies, the possibility that modulations of the intraseasonal variability contribute to the interannual variability of the PJ-mode has received little attention and this issue is the main focus of the present study.
4 Impact of the MJO on the interannual variation of the PJ‑mode
We start by analyzing the interannual variation of the PJ- mode associated with intraseasonal variability. Figure 3 shows the composite difference of OLR anomalies and wind anomalies at both 850 and 200 hPa between the positive and negative PJ years using 25–90-day band-pass filtered data. The circulation differences at 850 hPa are similar to the original interannual composite difference and resemble the PJ-mode (compare Figs. 2a and 3a), with significant anti- cyclonic anomalies over the subtropical WNP and cyclonic anomalies over mid-latitude East Asia. The OLR anomalies are characterized by enhanced convection anomalies along the East Asian rain band and suppressed convection anoma- lies over the tropical WNP. On the other hand, the wind dif- ferences at 200 hPa are almost indistinctive (Fig. 3b). These results suggest that the interannual variation of the intra- seasonal circulation contributes to the interannual variation
of the PJ-mode, albeit it only up to 15% (note the different vector scaling in Fig. 3) and that the contribution is mainly in the lower troposphere.
To quantify the intraseasonal (Fig. 3a) contribution to the interannual (Fig. 2a) variation in terms of the PJ- mode, we project the daily wind anomalies over the EASM region, i.e., 10°–50°N, 100°–150°E, onto the spatial pattern of the PJ-mode at 850 hPa. Prior to projection, the daily wind anomalies are divided by the JJA mean area-averaged standard deviation of the interannual variability and are area-weighted. The anomalies are then projected onto the corresponding spatial pattern of EOF1 at 850 hPa (Fig. 1a).
For the intraseasonal variation (Fig. 3a), daily wind anoma- lies are referred to the band-pass filtered data and for the
interannual variation (Fig. 2a), daily wind anomalies are unfiltered and referenced to the climatological mean sea- sonal cycle.
We compute the composite difference of the projection values between positive and negative PJ years. The pro- jection differences are 0.25 when using the intraseasonal anomalies (Fig. 3a) and 1.87 when using the interannual anomalies (Fig. 2a), which suggests that the interannual vari- ation of the intraseasonal circulation contributes 13% to the interannual variation of the PJ-mode at 850 hPa, consistent with the wind arrows in Fig. 3 being scaled to a length of about 17% of those in Fig. 2.
We now use a Monte Carlo technique to test the signifi- cance of the composite difference of the interannual and
(a)
(c)
(b)
Fig. 1 Spatial pattern of the first mode (referred to as the PJ-mode) associated with the East Asian summer monsoon (EASM) at a 850 hPa and b 200 hPa. c Time series of the PJ-mode, which is denoted as PC1. Shading in a, b shows the regression of CMAP JJA-
mean precipitation anomalies (mm day− 1) with respect to the normal- ized PC1. The reference arrow in the lower right corner represents a velocity anomaly of 1.0 m s− 1. Shadings in c show the 10 most posi- tive and 10 most negative PC1 years used for composite analyses
intraseasonal projection values. First, the composite pro- jection over two random sets of 10 years, drawn without replacement, are first computed. We then calculate the dif- ference of the projection values between these two sets of 10 years. This process is repeated a large number (10,000) of times. Figure 4 shows the resulting histograms, using 50
bins, for both raw anomalies and the band-pass filtered data, as an estimate of the probability density function (PDF) of the values. Both the resulting PDFs are centered around zero and show a Gaussian distribution. We then assess signifi- cance of the projection values according to the percentile ranges, i.e., values lower than the 2.5th or higher than the
(a) (b)
Fig. 2 Composite difference anomalies of wind at a 850 hPa and b 200 hPa and OLR (shading) between positive and negative PJ years.
The reference arrow represents a velocity anomaly of 3.0 m s− 1. Only
the vectors of either zonal or meridional wind anomalies significant at the 95% confidence level according to the Student’s t test are shown.
Shading is in W m2
(a) (b)
Fig. 3 Same as Fig. 2, but based on the 25–90-day filtered data (see text for details). The reference arrow represents a velocity anomaly of 0.5 m s− 1, which is 1/6 of that in Fig. 2
97.5th percentiles are significant at the 95% confidence level.
It is obvious that the composite differences of the projection values between the positive and negative PJ years for both the interannual (1.87) and intraseasonal (0.25) variations are highly significant.
In the following, we investigate the impact of the MJO on the interannual variation of the PJ-mode by using the approach developed by Yoo et al. (2011, 2012a, b). It should be noted that Yoo et al. focused on the impact of the MJO on the interdecadal change of, in their case, surface air tem- perature, while we focus on the interannual change of the PJ-mode here. The interannual change of a certain variable induced by the MJO (for brevity, the MJO-induced change) can be written as:
where X represents the studied variable, such as zonal wind, meridional wind or the projection values. An overbar means (1)
�
Xposi−Xnega
�
MJO
(𝜏) =
∑8
i=1ΔXposi,i(𝜏)Nposi,i N
−
∑8
i=1ΔXnega,i(𝜏)Nnega,i
N ,
the time average over the positive PJ years and negative PJ years separately, denoted as Pposi and Pnega, respectively, while τ indicates the lag day. On the right-hand side of Eq. (1), ΔXm,i is the intraseasonal anomaly associated with phase i of the active MJO in Pm, where m = “posi”, “nega”.
Nm,i is the number of active MJO days over phase i in Pm, and N is the total number of days in each of Pposi and Pnega, which equals to 920.
The right-hand side of Eq. (1) indicates that the MJO- induced change is a function of the intraseasonal anomaly associated with each MJO phase (ΔXm,i) and the frequency of the corresponding active MJO phase (Nm,i). The MJO- induced change can be further decomposed into three parts: (i) the part induced by the change in frequency of each MJO phase; (ii) the part induced by the change in the spatial pattern associated with each MJO phase; and (iii) the nonlinear combination of (i) and (ii). That is, ΔXm,i and Nm,i can be decomposed as ΔXm,i= Δ[X]i+ ΔXm,i∗ and Nm,i= [N]i+N∗m,i , respectively, where a square bracket represents an average over both Pposi and Pnega together, and an asterisk indicates a deviation from this average:
(2)
�
Xposi−Xnega�
MJO
(𝜏) =
∑8
i=1
�
Δ[X]i(𝜏)Nposi,i∗ − Δ[X]i(𝜏)N∗nega,i
�
N +∑8
i=1
�
ΔXposi,i∗ (𝜏)[N]i− ΔXnega,i∗ (𝜏)[N]i�
N +∑8
i=1
�
ΔXposi,i∗ (𝜏)[N]∗posi,i− ΔXnega,i∗ (𝜏)[N]∗nega,i� N
(a) (b)
Fig. 4 Histograms of projection difference between two sets of 10 random years based on a the raw data and b the filtered data. There are 50 bins in each histogram and experiments are repeated 10,000 times (see text for details). µ is the mean and σ indicates the stand- ard deviation of the estimated Gaussian distribution (shown as the red
line). Vertical black lines indicate the 2.5th and 97.5th percentage of distribution, which characterize the 95% confidence level according to the Monte Carlo test. Vertical green lines in a, b represent the pro- jection difference between the positive and negative PJ years based on the raw data (1.87) and filtered data (0.25), respectively
It is notable that the nonlinear term is not exactly zero, so the sum of the first two terms does not have to equal the left-hand-side term. Nevertheless, the nonlinear term is one order of magnitude smaller than the first two terms and has no important role to play, implying there is no covariance between the frequency of the MJO and the
anomalies associated with the MJO. Therefore, this term is neglected in what follows.
Figure 5 shows the wind anomalies at 850 and 200 hPa and OLR anomalies induced by the MJO, induced by the changes in frequency of the active MJO and induced by the changes in the intraseasonal spatial pattern associated with the active MJO between positive and negative PJ years
(a) (b)
(c) (d)
(e) (f)
Fig. 5 Composite difference of wind anomalies (Vectors; Units: m s− 1) at 850 hPa (left panels) and 200 hPa (right panels) and OLR anomalies (Shading; Units: W m− 2) between positive and negative PJ years induced by the MJO [a, b left-hand-side of Eq. (2)]; induced by the change in frequency of the different phases of the MJO [c, d the first term of the right-hand-side of Eq. (2)]; and induced by the change in the spatial anomalies associated with the MJO [e, f the
second term of the right-hand-side of Eq. (2)]. The anomalies are averaged over the first 5 days after each active MJO phase. The top panels show wind anomalies vectors that are significant at the 95%
confidence level according to the Student’s t test. Vectors with a value less than 0.3 m s− 1 are omitted. The marked area indicates the EASM region
according to Eqs. (1) and (2). Here, as well as in the rest of the paper, the anomalies induced by the MJO are aver- aged over the 5 days following the occurrence of each active MJO phase, to focus on the influence of the MJO on the EASM. Note that the MJO can cause almost-simultaneous atmospheric circulation anomalies in the western North Pacific due to a Gill-type response (Gill 1980). Therefore, the 5-day average is computed here rather than a 5-day lag.
The MJO-induced circulation anomalies at 850 hPa are char- acterized by an anticyclonic anomaly over the subtropical WNP (Fig. 5a), which characterizes the positive phase of the PJ-mode. The subtropical WNP anticyclonic anomaly is part of the large-scale easterly anomalies over the tropics in the lower troposphere, flowing towards the enhanced convec- tion over the Indian Ocean. The MJO-induced circulation anomalies at 200 hPa (Fig. 5b) are not significant within the EASM region, but show a significant southwesterly flow over the tropical western Pacific. The circulation anoma- lies over the tropics at upper and lower levels are almost opposite, suggesting a zonal overturning associated with the tropical convection anomalies. In positive PJ years, the downward branch of this zonal overturning may in turn favor suppressed convection over the tropical WNP (vice versa for negative PJ years), thereby possibly providing a posi- tive feedback of tropical vertical overturning induced by the MJO to the tropical convection anomalies. The convection anomalies over the tropical WNP further favor the positive phase of the PJ-mode. Overall, these results indicate that the MJO plays a role in the interannual variation of the PJ-mode, where the contribution is mainly in the lower troposphere.
Besides the RMM MJO index used here, we repeated the main analyses with some other MJO indices, such as the Velocity Potential MJO index (VPM; Ventrice et al. 2013) or the OLR MJO Index (OMI; Kiladis et al. 2014)1, and the MJO-induced circulation anomalies are similar (not shown).
The MJO exerts a clear influence on the PJ-mode at 850 hPa but not 200 hPa. This is probably because the vor- ticity balance in the lower troposphere is qualitatively dif- ferent from that in the upper troposphere (Sardeshmukh and Hoskins 1985). The relative vorticity advection, which is nonlinear, is weak compared with the stretching term and can be neglected in the lower troposphere over the WNP.
Therefore, the vorticity balance can be considered as linear and the MJO exerts a clear influence on the lower tropo- spheric extratropical circulation anomalies. However, the relative vorticity advection cannot be neglected in the upper troposphere over the tropical western Pacific due to the strong easterlies, and thus the vorticity balance is nonlinear
and prevents the MJO from exerting clear effects on the extratropical circulation anomalies over the WNP.
The analysis of the single terms of Eq. (2) indicate that the impact of the MJO on the interannual variation of the PJ-mode is mainly due to the frequency change of the MJO, as the anomalies associated with the frequency change of the MJO (Fig. 5c, d) are similar to the total change induced by the MJO (Fig. 5a, b), whereas the anomalies induced by the MJO-related pattern change are relatively weak (Fig. 5e, f).
Our previous study (Li et al. 2018) suggested that the intraseasonal variation of the PJ-mode is associated with the MJO. Early MJO phases (1–4) favor the positive phase of the MJO and late MJO phases (5–8) favor the negative phase of the PJ-mode. However, the frequency of occurrence and the circulation patterns associated with early MJO phases and late MJO phases are not exactly symmetric each year, suggesting that the MJO may exert an influence on the inter- annual variation of the PJ-mode. In this study, Eq. (1) sums the contributions from all individual MJO phases and the results are actually the residual of the anomalies of all dif- ferent MJO phases. Further, the analysis of the single terms of Eq. (2) demonstrates that the interannual variation of the non-zero residual is mainly caused by the frequency change of the MJO.
We now apply Eq. (1) on the PJ-mode projection val- ues based on the filtered data during positive and negative PJ years to quantify the impact of the MJO, i.e., to what extent the circulation anomalies shown in Fig. 5a contribute to those shown in Fig. 2a. The difference of the projection values between positive and negative PJ years induced by the MJO is 0.20, significant at 99% confidence level according to the Monte Carlo test. Therefore, the MJO contributes around 11% to the interannual variation of the PJ-mode (1.87).
As the sum of the circulation anomalies induced by the eight MJO phases makes a prominent contribution to the interannual variation of the PJ-mode at 850 hPa, we fur- ther investigate the relative role of each MJO phase. The projection anomalies induced by each MJO phase, induced by change in frequency of each MJO phase and induced by change in circulation anomalies associated with each MJO phase are calculated separately. Figure 6 shows the ratio between the projection anomalies induced by each MJO phase and the sum of the eight MJO phases. The dominate role of MJO phase 6 can be readily distinguished from others due to its contribution of around 50% to the total difference induced by the MJO (Fig. 6a). In addition, the contribution of MJO phase 7 (around 30%) is also significant (Fig. 6a).
The contribution of MJO phase 6 mainly comes from its frequency change (Fig. 6b), while the contribution of MJO phase 7 is induced by both the frequency change and the pattern change (Fig. 6b, c).
Figure 7 shows the frequency of occurrence of all eight MJO phases for positive PJ years, negative PJ years and the
1 The VPM index and the OMI index both are available online from the website of the NOAA/Earth System Research Laboratory (https ://
www.esrl.noaa.gov/psd/mjo/mjoin dex/).
climatological mean to verify the contributions shown in Fig. 6b. The frequency of occurrence is calculated by the number of days of active MJO phases divided by the total number of days (920) in positive and negative PJ years.
There exists a striking increase (decrease) of occurrence for MJO phase 6, and to some extent phase 7, in negative (posi- tive) PJ years, which suggests that convection anomalies associated with MJO phase 6 are particularly efficient at exciting the PJ-mode. The correlation coefficients between the interannual variation of the seasonal mean frequency of MJO phase 6 (not shown) and PC1 is − 0.49, significant at 99% confidence level. In addition, there are generally decreased (increased) frequencies of occurrence of early MJO phases (1–4) and increased (decreased) frequencies of occurrence of late MJO phases (6–8) for negative (positive) PJ years. This agrees well with the results of Li et al. (2018), who showed that on intraseasonal timescales, early MJO phases favor the positive phase of the PJ-mode and late MJO phases favor the negative phase of the PJ-mode.
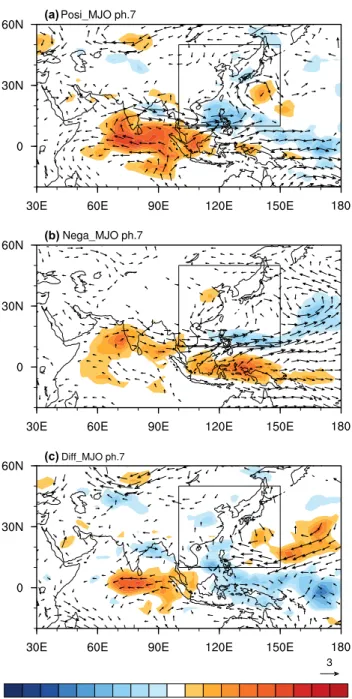
To verify the contributions of the change in patterns related to MJO phase 7 between positive and negative PJ years, Fig. 8 shows the 850 hPa wind anomalies and OLR anomalies averaged over the first 5 days after the occurrence of MJO phase 7 for the positive PJ years, negative PJ years, and their difference. For both the positive and negative PJ years, there are positive OLR anomalies over the tropical Indian Ocean and negative OLR anomalies over the subtrop- ical WNP and the wind anomalies show a cyclonic anomaly over the subtropical WNP (Fig. 8a, b), corresponding to the negative phase of the PJ-mode. These anomalies are consist- ent with Li et al. (2018). However, there is a distinct differ- ence in OLR anomalies between the positive and negative PJ years. In particular, the positive OLR anomalies tend to move eastward, and to be stronger over the eastern Maritime
(a)
(b)
(c)
Fig. 6 The projection anomalies at 850 hPa a induced by each phase of the MJO; b induced by the change in frequency of each phase of the MJO; and c induced by the change in the spatial anomalies asso- ciated with each phase of the MJO. Shown are the ratios compared to the same quantities induced by all 8 phases of the MJO [the left- hand-side of Eq. (2)]. Shaded bars indicate the anomalies that are sig- nificantly different from zero at the 95% confidence level according to the Monte Carlo test. Units: %
Fig. 7 Frequency of occurrence (Units: %) for each MJO phase.
Only days are included when the MJO is active. The red bars represent the positive PJ years, the blue bars represent the negative PJ years, and the black bars represent the climatologi- cal mean
Continent region, in the negative PJ years compared to the positive PJ years. As a result, the difference positive minus negative PJ years shows negative OLR anomalies over the eastern Maritime Continent region and corresponding wind anomalies (Fig. 8c) that project onto the positive phase of
the PJ-mode, even though these anomalies are shifted east- ward compared to the positive phase of the PJ-mode shown in Fig. 1. Since the difference, positive years minus nega- tive years, projects onto the positive phase of the PJ-mode, it follows that the change in spatial pattern of 850 hPa wind anomalies associated with the MJO phase 7 slightly contrib- utes to the interannual variation of the PJ-mode. Still, over most of the East Asian continent, and in particular China, the difference in circulation anomalies associated with MJO phase 7 between positive and negative years shown in Fig. 8c is negligible.
5 Conclusions and discussion
5.1 ConclusionsThe first mode of the East Asian summer monsoon (EASM) corresponds to the Pacific–Japan pattern (hereafter the PJ- mode), the interannual variability of which is closely associ- ated with floods and droughts along the East Asian (Meiyu/
Changma/Baiu) rain band. In this study, we investigated the interannual variation of the PJ-mode from the perspective of intraseasonal timescale variability.
The results show that the MJO has an influence on the interannual variation of the PJ-mode and the former contrib- utes about 11% to the latter. The impact of the MJO on the interannual variation of the PJ-mode mainly occurs at 850 hPa and is mainly due to changes in the frequency of occurrence of the MJO. A positive feedback by the vertical overturning associated with the MJO onto the convection anomalies is noted, e.g. the downward branch favoring suppressed convec- tion over the WNP during early MJO phases, which favors the positive phase of the PJ-mode (vice versa for late MJO).
Furthermore, we showed that, in particular, MJO phases 6 and 7 contribute significantly to variability of the PJ-mode, in particular about 50 and 30%, respectively, of the total con- tribution from the MJO. The contribution of MJO phase 6 is due to its frequency change (more frequent during negative, less frequent during positive PJ years) and the influence of MJO phase 7 is induced by both the frequency change (as for phase 6) and the change in circulation pattern associated with this phase (see Fig. 8).
5.2 Discussion
In this study, we discussed the anomalies averaged over the first 5 days after the occurrence of each active MJO phase, so that we more likely see the impact of the MJO on the EASM rather than the other way around. Further we chose the MJO, whose definition region (up to 15°N) only slightly overlaps with the EASM region (10°–50°N) instead of the BSISO, which uses data up to 30°N in its definition. On the other
(a)
(b)
(c)
Fig. 8 Wind anomalies at 850 hPa and OLR anomalies (Units: W m− 2) averaged over the first 5 days after the occurrence of MJO phase 7 for a the positive PJ years, b the negative PJ years, and c the dif- ference (a) minus (b). The reference arrow in the lower right corner represents a velocity anomaly of 3.0 m s− 1. Only the vectors of either zonal or meridional wind anomalies that are significantly different from zero at the 95% confidence level according to a two-tailed Stu- dent’s t test are shown. Vectors with a value less than 0.5 m s− 1 are omitted. The marked area indicates the EASM region
hand, as part of the background state for the intraseasonal timescale variability includes the interannual variation of the PJ-mode, the latter may in turn exert an influence on the tropical intraseasonal convection, which may need further investigation but is beyond the scope of this study.
The importance of MJO phases 6 and 7 is consistent with the results of Sun et al. (2010), who argued, using a linear model, that diabatic heating anomalies, associated with con- vection anomalies, centered on the equator over the Indian Ocean/Maritime Continent region most efficiently drive the PJ pattern (see their Figs. 8, 9).
We have seen an important role for changes in the fre- quency of occurrence of the different phases of the MJO.
Some studies have reported that changes in the frequency of occurrence of the MJO phase are associated with sea surface temperature (SST) anomalies over the tropical WNP and Indian Ocean (Slingo et al. 1999; Fu et al. 2003; Arnold et al. 2013), and the important role of the SST anomalies in the tropical Indian Ocean on the PJ pattern has been identi- fied by previous studies (Yang et al. 2007; Li et al. 2008;
Xie et al. 2009; Sun et al. 2010–see their Fig. 13; Tao et al.
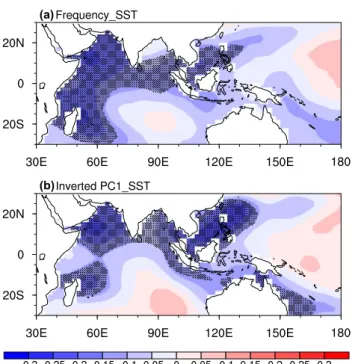
2017). These findings suggest that the tropical Indian Ocean and South China Sea could be a common driver of variabil- ity of the MJO and the EASM. Figure 9 further shows the regression of JJA-mean SST anomalies onto the normalized seasonal mean frequency of MJO phases 6 and 7 (cumu- lated) and the negative of PC1 during summer. There are
negative SST anomalies over the Indian Ocean and South China Sea for more MJO phases 6 and 7 (Fig. 9a), suggest- ing the negative SST there may favor more MJO phases 6 and 7. Similar SST anomalies appear over these regions for the negative phase of the PJ-mode (Fig. 9b), consistent with previous studies (e.g., Yang et al. 2007; Xie et al. 2009, 2016) and with the significant negative correlation between the interannual frequency of the occurrence of MJO phase 6 and PC1 noted earlier. However, the tropical intraseasonal oscillation may also exert an influence on the tropical SST (e.g., Duncan and Han 2009; Vialard et al. 2011), making it unclear what is cause and effect here.
In addition to the first mode of the EASM, the second mode also plays an important role in affecting the precipita- tion variability over East Asia, especially the precipitation over northern China (Wang et al. 2008; Sun et al. 2010).
This mode is influenced by the Indian summer monsoon (Greatbatch et al. 2013). In the lower troposphere, the spa- tial pattern in the positive phase is characterized by south- erly wind anomalies throughout East China; and in the upper troposphere, the spatial pattern is associated with a zonal teleconnection pattern along the Asian westerly jet, the so- called “Silk Road pattern” (Lu et al. 2002; Enomoto et al.
2003; Hong and Lu 2016) or the circumglobal teleconnec- tion pattern (Ding and Wang 2005). The intraseasonal vari- ation of this mode is also connected with the MJO (Li et al.
2018) and we have also investigated the impact of the MJO on the interannual variation of this mode. It was found that the influence of the MJO mainly appears in the upper tropo- sphere and the MJO-related projection anomalies accounts for about 6% to the interannual variation of the second mode at 200 hPa. The circulation differences induced by the MJO between positive and negative phases of this mode show a zonal teleconnection pattern in the upper troposphere, but the anomalous centers of action tend to shift westward compared to the spatial pattern of EOF2 at 200 hPa. We cannot explain this phenomenon so far and the results are not shown, but relevant analyses perhaps deserve further investigation.
Acknowledgements The authors thank three anonymous reviewers for their helpful comments on an earlier version of the manuscript. XL is grateful to the Joint PhD Training Program (UCAS[2015]37) between the University of the Chinese Academy of Sciences and the Deutscher Akademischer Austausch Dienst (the German Academic Exchange Ser- vice) for supporting a 12-month stay at GEOMAR. Support is acknowl- edged from the German Ministry for Education and Research (BMBF) through MiKlip2, subproject 01LP1517D (ATMOSMODINI). RJG is grateful for continuing support from GEOMAR. The data used in the study is available from data.geomar.de.
Open Access This article is distributed under the terms of the Crea- tive Commons Attribution 4.0 International License (http://creat iveco mmons .org/licen ses/by/4.0/), which permits unrestricted use, distribu- tion, and reproduction in any medium, provided you give appropriate credit to the original author(s) and the source, provide a link to the Creative Commons license, and indicate if changes were made.
(a)
(b)
Fig. 9 Regression of JJA-mean SST anomalies (Units: °C) onto the normalized a JJA-mean cumulated frequency of MJO phases 6 and 7 and b the inverted PC1. The stippled area denotes the 95% confidence level based on a Student’s t test
References
Arnold NP, Kuang Z, Tziperman E (2013) Enhanced MJO-like vari- ability at high SST. J Clim 26(3):988–1001
Chen TC, Wang SY, Huang WR, Yen MC (2004) Variation of the East Asian summer monsoon rainfall. J Clim 17:744–762 Chen J, Wen Z, Wu R, Chen Z, Zhao P (2015) Influences of north-
ward propagating 25–90-day and quasi-biweekly oscillations on eastern China summer rainfall. Clim Dyn 45:105–124 Dee DP et al (2011) The ERA-Interim reanalysis: configuration and
performance of the data assimilation system. Q J R Meteorol Soc 137:553–597
Ding YH (2004) Seasonal march of the East-Asian summer monsoon.
In: Chang CP (ed) East Asian monsoon. World Scientific, Singa- pore, pp 3–53
Ding YH (2005) Advanced synoptic meteorology. China Meteorologi- cal Press, Beijing (in Chinese)
Ding YH (2007) The variability of the Asian summer monsoon. J Meteorol Soc Jpn 85B:21–54. https ://doi.org/10.2151/jmsj.85B.21 Ding Q, Wang B (2005) Circumglobal teleconnection in the northern
hemisphere summer. J Clim 18:3483–3505
Ding H, Greatbatch RJ, Park W, Latif M, Semenov VA, Sun X (2014) The variability of the East Asian summer monsoon and its rela- tionship to ENSO in a partially coupled climate model. Clim Dyn 42:367–379. https ://doi.org/10.1007/s0038 2-012-1642-3 Ding H, Greatbatch RJ, Lu J, Cash B (2015) The East Asian summer
monsoon in pacemaker experiments driven by ENSO. Ocean Dyn 65:385–393. https ://doi.org/10.1007/s1023 6-014-0795-5 Duncan B, Han W (2009) Indian Ocean intraseasonal sea surface tem-
perature variability during boreal summer: Madden–Julian Oscil- lation versus submonthly forcing and processes. J Geophys Res 114:C05002
Enomoto T, Hoskins BJ, Matsuda Y (2003) The formation mechanism of the Bonin high in August. Q J R Meteorol Soc 129:157–178.
https ://doi.org/10.1256/qj.01.211
Fu X, Wang B, Li T, McCreary JP (2003) Coupling between north- ward-propagating, intraseasonal oscillations and sea surface tem- perature in the Indian Ocean. J Atmos Sci 60:1733–1753 Gill AE (1980) Some simple solutions for heat-induced tropical circu-
lation. Q J R Meteorol Soc 106:447–462
Greatbatch RJ, Sun X, Yang XQ (2013) Impact of variability in the Indian summer monsoon on the East Asian summer monsoon.
Atmos Sci Lett 14:14–19
Hong X, Lu R (2016) The meridional displacement of the summer Asian jet, Silk Road Pattern, and tropical SST anomalies. J Clim 29(10):3753–3766. https ://doi.org/10.1175/JCLI-D-15-0541.1 Hu K, Xie SP, Huang G (2017) Orographically anchored El Niño effect
on summer rainfall in central China. J Clim 30(24):10037–10045 Huang R, Sun F (1992) Impacts of the tropical western Pacific on the
East Asian summer monsoon. J Meteorol Soc Jpn 70:243–256 Huang R, Wu Y (1989) The influence of ENSO on the summer climate
change in China and its mechanism. Adv Atmos Sci 6:21–32.
https ://doi.org/10.1007/BF026 56915
Jiang W, Huang G, Hu K, Wu R, Gong H, Chen X, Tao W (2017) Diverse relationship between ENSO and the Northwest Pacific summer climate among CMIP5 models: dependence on the ENSO decay pace. J Clim 30:109–127. https ://doi.org/10.1175/
jcli-d-16-0365.1
Kikuchi K, Wang B, Kajikawa Y (2012) Bimodal representation of the tropical Intraseasonal oscillation. Clim Dyn 38:1989–2000 Kiladis GN, Dias J, Straub KH, Wheeler MC, Tulich SN, Kikuchi K,
Weickmann KM, Ventrice MJ (2014) A comparison of OLR and circulation-based indices for tracking the MJO. Mon Weather Rev 142:1697–1715
Kosaka Y, Xie SP, Nakamura H (2011) Dynamics of interannual variability in summer precipitation over East Asia. J Clim 24:5435–5453
Kosaka Y, Xie SP, Lau NC, Vecchi GA (2013) Origin of seasonal predictability for summer climate over the Northwestern Pacific.
Proc Natl Acad Sci 110:7574–7579. https ://doi.org/10.1073/
pnas.12155 82110
Lau KM, Kim KM, Yang S (2000) Dynamical and boundary forcing characteristics of regional components of the Asian summer mon- soon. J Clim 13:2461–2482
Lee HT, Heidinger A, Gruber A, Ellingson RG (2004) The HIRS out- going longwave radiation product from hybrid polar and geosyn- chronous satellite observations. Adv Space Res 33:1120–1124 Lee HT, Gruber A, Ellingson RG, Laszlo I (2007) Development of
the HIRS outgoing longwave radiation climate dataset. J Atmos Ocean Technol 24:2029–2047
Lee SS, Moon JY, Wang B, Kim HJ (2017) Subseasonal prediction of extreme precipitation over Asia: boreal summer intraseasonal oscillation perspective. J Clim 30:2849–2865
Li X, Lu R (2017) Extratropical factors affecting the variability in summer precipitation over the Yangtze River basin, China. J Clim 30(20):8357–8374. https ://doi.org/10.1175/JCLI-D-16-0282.1 Li S, Lu J, Huang G, Hu K (2008) Tropical Indian Ocean basin warm-
ing and East Asian summer monsoon: a multiple AGCM study. J Clim 21:6080–6088
Li X, Gollan G, Greatbatch RJ, Lu R (2018) Intraseasonal variation of the East Asian summer monsoon associated with the Mad- den–Julian Oscillation. Atmos Sci Lett 19:e794. https ://doi.
org/10.1002/asl.794
Lin Z, Lu R (2005) Interannual meridional displacement of the East Asian upper-tropospheric jet stream in summer. Adv Atmos Sci 22:199–211
Lin Z, Lu R (2009) The ENSO’s effect on eastern China rainfall in the following early summer. Adv Atmos Sci 26:333–342. https ://doi.
org/10.1007/s0037 6-009-0333-4
Lu R (2001a) Interannual variability of the summertime North Pacific subtropical high and its relation to atmospheric convection over the warm pool. J Meteorol Soc Jpn 79:771–783
Lu R (2001b) Atmospheric circulations and sea surface temperatures related to the convection over the western Pacific warm pool on the interannual scale. Adv Atmos Sci 18:270–282
Lu R (2004) Associations among the components of the East Asian summer monsoon system in the meridional direction. J Meteorol Soc Jpn 82:155–165
Lu R, Oh JH, Kim BJ (2002) A teleconnection pattern in upper-level meridional wind over the North African and Eurasian continent in summer. Tellus 54A:44–55
Madden RA, Julian PR (1971) Detection of a 40–50 day oscillation in the zonal wind in the tropical Pacific. J Atmos Sci 28:702–708 Madden RA, Julian PR (1972) Description of global-scale circula-
tion cells in the tropics with a 40–50 day period. J Atmos Sci 29:1109–1123
Nitta T (1987) Convective activities in the tropical western Pacific and their impacts on the northern hemisphere summer circulation. J Meteorol Soc Jpn 65:373–390
North GR, Bell TL, Cahalan RF, Moeng FJ (1982) Sampling errors in the estimation of empirical orthogonal functions. Mon Weather Rev 110:669–706
Sardeshmukh PD, Hoskins BJ (1985) Vorticity balances in the tropics during the 1982-83 El Niño-Southern Oscillation event. Quart J Met Soc 111:261–278
Slingo JM, Rowell DP, Sperber KR, Nortley F (1999) On the pre- dictability of the interannual behaviour of the Madden–Julian oscillation and its relationship with El Nin̄o. Q J R Meteorol Soc 125:583–609. https ://doi.org/10.1002/qj.49712 55541 1
Su TH, Xue F (2010) The intraseasonal variation of summermon- soon circulation and rainfall in East Asia. Chinese J Atmos Sci 34(3):611–628 (in Chinese)
Sun X, Greatbatch RJ, Park W, Latif M (2010) Two major modes of variability of the East Asian summer monsoon. Q J R Meteorol Soc 136:829–841
Tao L, Li T, Ke Y-H, Zhao J-W (2017) Causes of interannual and inter- decadal variations of the summertime Pacific-Japan-like pattern over East Asia. J Clim 30(22):8845–8864
Ventrice MJ, Wheeler MC, Hendon HH, Schreck CJ, Thorncroft CD, Kiladis GN (2013) A modified multivariate Madden–Julian oscillation index using velocity potential. Mon Weather Rev 141(12):4197–4210
Vialard J, Jayakumar A, Gnanaseelan C, Lengaigne M, Sengupta D, Goswami B (2011) Processes of 30–90 days sea surface tempera- ture variability in the northern Indian Ocean during boreal sum- mer. Clim Dyn 38(9–10):1901–1916
Wang B (1992) The vertical structure and development of the ENSO anomaly mode during 1979–1989. J Atmos Sci 49(8):698–712 Wang B, Xie X (1997) A model for the boreal summer intraseasonal
oscillation. J Atmos Sci 54:72–86
Wang B, Wu R, Fu X (2000) Pacific–East Asian teleconnection: how does ENSO affect East Asian climate? J Clim 13:1517–1536. https ://doi.org/10.1175/1520-0442(2000)013,1517:PEATH D.2.0.CO;2 Wang B, Wu R, Li T (2003) Atmosphere–warm ocean interaction and its
impacts on Asian–Australian monsoon variation. J Clim 16:1195–
1211. https://doi.org/10.1175/1520-0442(2003)16<1195:AOIAI I>2.0.CO;2
Wang B, Webster P, Kikuchi K, Yasunari T, Qi Y (2006) Boreal sum- mer quasi-monthly oscillation in the global tropics. Clim Dyn 27:661–675
Wang B, Wu Z, Li J, Liu J, Chang CP, Ding Y, Wu G (2008) How to measure the strength of the East Asian summer monsoon. J Clim 21(17):4449–4463
Wang J, Wen Z, Wu R, Lin A (2017) The impact of tropical intrasea- sonal oscillation on the summer rainfall increase over southern China around 1992/1993. Clim Dyn 49:1847–1863
Wheeler MC, Hendon HH (2004) An all-season real-time multivariate MJO index: development of an index for monitoring and predic- tion. Mon Weather Rev 132:1917–1932
Wu B, Zhou T, Li T (2016) Impacts of the Pacific–Japan and circum- global teleconnection patterns on the interdecadal variability of the East Asian summer monsoon. J Clim 29:3253–3271 Xie P, Arkin PA (1997) Global precipitation: a 17-year monthly analy-
sis based on gauge observations, satellite estimates, and numerical model outputs. Bull Am Meteorol Soc 78:2539–2558
Xie SP, Hu K, Hafner J, Tokinaga H, Du Y, Huang G, Sampe T (2009) Indian Ocean capacitor effect on Indo–western Pacific climate during the summer following El Niño. J Clim 22:730–747. https ://doi.org/10.1175/2008J CLI25 44.1
Xie SP, Du Y, Huang G, Zheng XT, Tokinaga H, Hu K, Liu Q (2010) Decadal shift in El Niño influences on Indo-western Pacific and East Asian climate in the 1970s. J Clim 23:3352–3368
Xie SP, Kosaka Y, Du Y, Hu K, Chowdary JS, Huang G (2016) Indo- western Pacific Ocean capacitor and coherent climate anomalies in post-ENSO summer: a review. Adv Atmos Sci 33:411–432.
https ://doi.org/10.1007/s0037 6-015-5192-6
Yang J, Liu Q, Xie SP, Liu Z, Wu L (2007) Impact of the Indian Ocean SST basin mode on the Asian summer monsoon. Geophys Res Lett 34:L02708. https ://doi.org/10.1029/2006G L0285 71 Yasunari T (1979) Cloudiness fluctuations associated with the northern
hemisphere summer monsoon. J Meteorol Soc Jpn 57:227–242 Yoo C, Feldstein S, Lee S (2011) The impact of the Madden–Julian
oscillation trend on the Arctic amplification of surface air tem- perature during the 1979–2008 boreal winter. Geophys Res Lett 38:L24804. https ://doi.org/10.1029/2011G L0498 81
Yoo C, Lee S, Feldstein S (2012a) The impact of the Madden–Julian oscillation trend on the Antarctic warming during the 1979–
2008 austral winter. Atmos Sci Lett 13:194–199. https ://doi.
org/10.1002/asl.379
Yoo C, Lee S, Feldstein S (2012b) Mechanisms of Arctic surface air temperature change in response to the Madden–Julian oscillation.
J Clim 25:5777–5790
Zhang C (2013) Madden–Julian oscillation: bridging weather and climate. Bull Am Meteorol Soc 94:1849–1870. https ://doi.
org/10.1175/BAMS-D-12-00026 .1
Zhang L, Wang B, Zeng Q (2009) Impact of the Madden–Julian oscil- lation on summer rainfall in southeast China. J Clim 22:201–216