J. Clin. Chem. Clin. Biochem.
Vol. 18,1980, pp. 183-192 '
An External Quality Control Survey (EQCS) for Serum Cortisol By W. G. Wood,M. Bauer J. Marschner and P. C Scriba
Medizinische Klinik Innenstadt (Direktor: Professor Dr. E. Buchborn) der Universität München, Laboratorienfür Klinische Chemie und Endokrinologie
(Received June 18/August 2,1979)
Summary: The external quality control survey (EQCS) was based on those already published from this department (Marschner, I. et al. (1976) J. Clin. Chem. Clin. Biochem. 14, 345-351; Marschner, I. et al. (1974) Horm. Metab. Res.
6, 293-296; Horn, K. et al. (1976) J. Clin. Chem. Clin. Biochem. 14, 353-360). Each participant received 20 sera sent in dry-ice by express post or airmail, together with a detailed questionnaire requesting assay details and raw data from his own standard curve as well as from the 20 samples.
The data returned was transferred to punched cards and processed by computer (Siemens 404/3) using a modular system of programmes arid sub-routines.
The serum samples contained a hidden standard curve, samples for assay internal control and sera from suppression and stimulation tests. Possible crossreacting substances were added to 2 sera. Each participant received a detailed computer print-out with an explanatory letter and set of histograms for each serum sample with which he could check his performance against other participants, in particular those using the same kit as himself. 87 laboratories received the 20 samples for cortisol assay. 64 laboratories returned data on the questionnaire sent, and of these, 49 sets of data could be fully worked out, the other 15 were only partly interpretable. Apart from laboratory-own methods, results from 9 different commercial kits were received. 21 participants had an intra-assay coefficient of variation under 5 %, 16 participants between 5 and 10 %. The minimum coefficient of variation for the 3 sera measured was 0 % and the maximum 86 %. Coincidence of laboratory-own and hidden standard curves was only seen in 13 cases.
Externer Ringversuch für Cortisol im Serum
Zusammenfassung: Es wurde ein Ringversuch nach früherem Modell (Marschner, I. et al. (1976) J. Clin. Chem. Clin.
Biochem. 14, 345-351; Marschner, I. et al. (1974) Horm. Metab. Res. 6, 293-296; Horn, K. et al. (1976) J. Clin.
Chem. Clin. Biochem. 14, 353—360) durchgeführt.
20 Seren wurden in Trockeneis verpackt und per Express an die Teilnehmer versandt. Jeder Teilnehmer erhielt einen Fragebogen, in dem alle Assay ^Parameter sowie die Impulsraten der laboreigenen Standardkurve und die der 20 ge- messenen Seren verlangt wurden. Die Ergebnisse wurden auf Lochkarten gestanzt, in einen Siemens 404/3 Computer eingelesen und ausgewertet. Die Auswertung erforderte etwa 30-35 Programme, die auf modularer Basis zusammen- gestellt wurden. Die 20 Seren setzten sich zusammen aus einer versteckten Standardkurve, Proben mit kreuzreagieren- den Substanzen, Seren von Stimulations- bzw. Suppressipnstesten und anderen Poolseren.
Jeder Teilnehmer erhielt einen Computerausdruck, einen ausführlichen Begleitbrief und einen Satz Histogramme, anhand derer er seine Leistung mit dien anderen Teilnehmern vergleichen konnte.
Die 20 Sefumproben für die Cortisolbestimmung, wurden an 87 Laboratorien versandt. 64 Laboratorien sandten Ergebnisse zurück, von denen 49 voll auswertbar und 15 nur teilweise auswertbar waren. Neben laboreigenen Me- thoden wurden Ergebnisse von 9 kommerziellen Testbestecken eingesandt. 21 Teilnehmer hatten einen Variations- koeffizienten (VK) unter 5 % und weitere 16 Teilnehmer einen VK zwischen 5 und 10 %.
Der geringste VK betrug 0 % und der höchste VK 86 %.
Eine Übereinstimmung der laboreigenen und der versteckten Standardkurve wurde nur in 13 Fällen erreicht.
0340-076X/80/0018-0183S2.00
© by Walter de Gruyter & Co. · Berlin · New York
The need for external and internal quality control in hormone assays is well recognised. In the Federal Re- public of Germany, both external and internal quality- control measures are laid down statutarily for clinical chemistry (1). EQCS for clinical chemical parameters and for several hormones are carried out by two authori- sed bodies, namely the Deutsche Gesellschaft f r Klinische Chemie (German Society for Clinical Chemistry) and INSTAND, Institut f r Standardisierung und Dokumen- tation. The hormone EQCS carried out by these two societies are not obligatory, thus leaving laboratories free to choose whether they participate or not. The hormone EQCS are carried out at regular intervals (3-4 times per year) and consist of two lyophilised samples, sent by normal post to participants. An analysis of the results is then sent to each participating laboratory. Both the above organisers charge a small fee to participants to help cover costs involved.
The disadvantage of such EQCS is the limited information which can be given regarding possible sources of error in the assay system of a participant and for this reason, an EQCS model was devised in this laboratory (2—4) to support the above surveys, while at the same time moni- toring performance of commercial kits and self-construc- ted assays. This system has been copied by others (5) and has been given the name the "Munich-Model" of EQCS (5).
Preparation for the EQCS Choice of participants
Letters of invitation were sent to active members of the Deutsche Gesellschaft f r Endokrinologie and the Deutsche Gesellschaft f r Klinische Chemie, to all commercial kit producers as well as to selected private and hospital laboratories. Each potential partici- pant was asked whether he wished to take part in a quality control survey for cortisol, and also to indicate his preference for the hormones which he would like to measure in the sub- sequent 4 EQCS. From the replies, a list of participants as well as a priority list for the next EQCS was drawn up. All informa- tion on participants in this and subsequent EQCS was then transferred to punched cards and stored away until needed.
Sample preparation
Serum samples from "special-interest" patients were pooled over a three month period to provide enough material for the EQCS. In addition, possible interfering substances, as well as sera from suppression and stimulation tests were collected. Table 1 shows the composition of the 20 sera sent to each participant. The numbering of the samples was random.
All samples were filtered through an asbestos filter (Seitz-filter, Bender and Hobein, D-8000 M nchen) under pressure (5 Bar N2) before being portioned into plastic cups (Eppendorf, D-2000 Hamburg) in 1 ml lots, the filtration removed both bacteria and fibrin clots and rendered the sera clear and easy to pipette. All sera were then frozen at -25 °C until dispatch.
The medium for the standard curve was made up as follows:
40 g · Γ1 Human Serum Albumin (Sigma - D-8011 Taufkirchen) 20 g · Γ1 Human ^-globulins (Miles-Pentax - D-6000 Frankfurt
a.M.)
10 g · Γ1 Human globulins (Miles-Pentax)
Serum
no. C o n t e n t s
1 Dexamethasone-suppression test pool serum 2 Hidden standard curve - 0 nmol · Γ1
3 Pregnancy pool serum ^21-42 weeks of gestation 4 Intra^assay C.V. pool serum
5 Hidden standard curve - 138 nmol · I"1
6 Hidden standard curve =,1725 nmol · Γ1
7 Hidden standard curve - 448 nmol · Γ1
8 Hidden standard curve — 276 nmol · Γ1
9 Hidden standard curve - 46 nmol · Γ1
10 Gushing*s disease pool serum
11 Hidden standard curve ^ 690 nmol · Γ1 12 Serum 1 + corticosterone - 700 nmol · Γ1 13 Stripped serum
14 Intra-assay C.V. pool serum 15 Serum 13 + serum 19 1 + 1 mixture 16 Pool serum from 100 patients 17 Intra-assay C.V. pool serum
18 Serum 1 + ll^deoxycorticosterone ^725 nmol · Γ1
19 Corticotropin stimulation test pool serum
20 Pool serum - upper limit of normal range (09°° value)
dissolved in Ringer solution (Fresenius — D-6380 Bad Homburg) This system gave a zero reading in three different assay systems,
namely radioimmunoassay, competitive protein binding and fluorimetry. Corticosterone and ll^eoxycorticosterone were obtained from Fluka, D-7910 Neu-Ulm.
Dispatch
Samples were packed in expanded polystyrene squares and sealed with adhesive foil before being transferred to boxes of the same material (Febra, D-7129 Brackenheim) containing dry ice (5-7 kg). The boxes were then sent by express post or airmail to each participant together with a questionnaire and letter giving the last date for return of completed data forms.
Questionnaire
The points covered by the questionnaire were as follows:
1. Name and address of participant.
2. Whether the sera arrived still frozen.
3. Method used in assaying the samples — including make of kit, label used, extraction procedure.
4. Incubation scheme and volumes and constitution of reagents.
5. Separation of bound and free hormone 6. Counting apparatus and procedure
7. Construction of standard curve with mathematical trans- formation of data.
8. Data concerning normal range, internal quality-control meas- ures.
9. Invitation to criticise the format of the questionnaire.
10. Results from laboratory^)wn standard curve in terms of con- centrations and counts.
11. Cortisol contrations measured in the 20 sera together with counts.
Data Processing
Treatment of completed questionnaires
All answers and data were coded and transferred to punched cards. The assay details were contained on three cards arid the raw data from laboratory standard curve and measured sera on a further 27^32 cards, depending on the number of points used in the laboratory standard curve.
Each participant was allotted a number known only to him and to the organisers. Numbers were allotted in the order in which the
J. Clin. Chem/Clin. Biochem. / Vol. 18,1980 / No. 3
Off-line
On-line
I Collection of raw data and transfer on to punch ι ι cards (statistical data, concentrations, standard I j curve and count rates) [
Data storage
I
Data transfer from punch cards to magnetic discs with concurrent preparation of data for standard curve construction.
Main programme 1.
a. Construction and print out of standard curves for each participant (spline function) b. Serum sample concentrations read off
standard curves.
c. Comparison of participant values with those read off the spline curves.
d. Regression analysis of values given by parti- cipant and those from the different standard and recovery curves.
e. Storage of above data on magnetic discs.
Main programme 2.
a. Comparison of each participant's values with the mean of all participants' values.
b. As a. above but for participants using the same kit.
c. a. and b. were carried out for participant's own values and those read off the stand- ardised and recovery curves.
d. Print out of intra-assay c. v. from the stand- ardised curve — from participant's own standards and count rates.
Histogram plotting programme.
Plotting of histograms from all 3 curves to give a visual representation of the distribution of participants for each sample.
The participant could see at a glance where his values lay in respect to others both overall and to those using the same kit as himself.
Each value was represented as a box containing both participant and kit numbers.
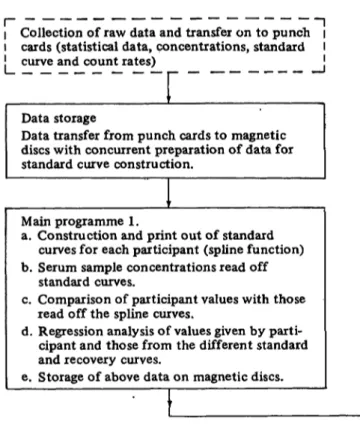
Fig. 1. Data flow sheet and computer programme blocks for EQCS carried out in this laboratory.
returned data were received. The assay method (or kit) was coded to allow a later comparison of performance between kits, and to compare different methods, for example, radioimmunoassay and competitive protein binding assays.
Computer programme layout
Figure 1 shows the layout of the computer programmes. The system was so devised that it could be used for subsequent EQCS with minimal modification. A Siemens 404/3 computer with paper-tape and punched-card reader was used. Data were stored on magnetic discs, each having a capacity of 3 MByte and the programme language was Fortran IV.
The standard and recovery curves were constructed using a spline function as described by Reinsch (6) and modified for radioimmunoassay data by Marschner et al. (7). Histogrammes were drawn using a plotter connected on-line to the computer.
Treatment of results
After plotting the results and evaluation of data, the results from each participant were examined separately to see if either system- atic or random errors were present. Figures 2a-2f show a copy of the 6-page computer print out. An explanatory letter was sent to each participant, containing an evaluation of laboratory performance together with constructive criticism for possible improvement where necessary, and a copy of histograms for all 20 samples. The participant was invited, if he felt it necessary, to/contact the organisers if any point was not clear, or if he needed help in reconstruction of his assay in order to obtain better results.
Results
Preliminary Data
150 letters were sent to various laboratories in the Federal Republic of Germany who had indicated interest in taking part in hormone EQCS. 87 laboratories wished
to take part in a cortisol EQCS, of whom 64 returned either fully or partially completed questionnaires. From these 64 participants 49 were able to return fully-useable data and 15 partly-useable data. An analysis of laboratory type and returned data is shown in table 2. The majority of returned data was from University laboratories (50.0 %) with routine and research functions. This group also re- turned the highest percentage (37.5 %) of incorrectly answered questionnaires.
Tab. 2. Analysis of participating laboratories showing data returned. Laboratories are subdivised into groups.
Type of laboratory No. of Data Data
participants fully useable partly useable University clinic
routine laboratories Local hospital routine laboratories Large private laboratories Small private laboratories Commercial kit producers or representatives Research laboratories Totals
32 8 8 2 6 8 64
20 7 6 2 6 8 49
12 1 2 0 0 0 15
J. Clin. Chem. Clin. Biochem. / Vol. 18,1980 / No. 3
A U S W E R T U N G DES C O R T I S O L « « I N G V E R S U C H S M A E R Z - A P R U 1977
A L L C K H V E N - U R D E N K I T S P L 1 N E - A P P R O X Ι Μ Λ Τ I O N E R R E C H N E T ,
« U R V E I N A C H A N G A B E N DES T E I L N E H M E R S ,
( F E H L T E A N G A b E Z U R U N S P E Z , 6 1 N O U N C . SO W U R D E AUS P R O t t R A M M f E C H N l S C H E N 6 R U E N O E N N « 10 G E S E T Z T ) ( E B E N S O M U R O E F U E R F E N L E N w E Β θ - W E H T E E I N P R O G R A M M T E C H N I S C H B R A U C H B A R E R *£RT A N G E N O M M E N )
( N M O L / U
K U R V E n : V E R S T E C < T E M A N O A R O K U R V E : NR.2 · eo , STANDARDS i NR. 9 s β 7 11 6
MIT DEN VOM V E R A N S T A L T E R E I N G E S E T Z T E N K O N Z E N T R A T I O N E N l 46 138 276 448 690 172*
U N O O E N V O M T E I L N E H M E R GEMESSENE* Z A E H L R A T E N .
K U R V E I I I : V E R S T E C K T E S T A N D A & D t u R V E A U S O E N G L E I C H E N P R O B E N . A B E R M I T DEN V O M T E I L N E H M E R G E M E S S E N E N K O N Z E N T R A T I O N E N . ( P k Q Z . B I N O U N G BEZ GEN A(jF DAS B DER S T A N D A R D K U H V E )
K O N Z E N T R A T I O N E N , D I E FUER D I E K U R V E N I I O D E R I M EP-Ε N I C H T A N S T E I G E N D E K O N Z E N T R A T l O N S F O L G E E R G E B E N H A E T T t N ,
• U P C E N N I C » T B F R U E C K S U H T I G T .
K U M v E l
S T A N D A R O K O N Z E M T R . S T A N O A R O L E E R r f E R T ( B U )
27.6 N M O L / L 82.β » M O L / L 16S.6 N M O L / L 276.0 N - O L / L 690.0 N M O L / L 1636.0 N M O L / L 3312.0 S M O L / L UNSPEZ. oI*Our;G(N>
K U h v E I I
M R O Z . ( B U ) 100.00 92.43 68.85 55.48 44.3) 28.V9 17.95 10.27
2.496 2.672 2.108 0 . 3 3 7 3.066 1.656 1.488 1.381
2 . 2 3 3 2.8/2 2,108 0.537 3.066 1.656 1,488 1.381
O R D I N A T E 100.63
89.30 68.47 S3.60 43.82 29.11 17.90 10.30
Z A E H L R A T E N 867S.
8105.
636*.
4979.
4248.
2993.
2058.
1267.
438.
8740.
8 1 0 5 . 6189.
4903.
4453.
1769.
1296.
316.
9072.
8142.
6413.
4920.
4183.
2878.
1996.
1184.
480.
9136.
8601.
6023.
4997.
3831.
2687.
1978.
1462.
507.
6762.
S T A N O A R D K O N Z E N T f c . S T A N D A R D L E E R « E * T ( B O )
46.C » « O L / L 13β.ϋ N M O L / L 176.0 * « O L / L 446.0 N M U L / L 6 9 U . O N M O L / L 1725.0 '·" L / L
«U»VE I I I
P R O Z . ( B O ) 100.00 73.41 54.52 40.57 34.63 24.78 14.12
S.D.
1.369 .899 1.093 0.607 1.297 0.822 0.91V
2«S.E.".
1.581 1,039 1,262 0.932 1,497 0,949 1.061
O R D I N A T E 100.01
7 3 . 7 9 54.36 40.90 33,23 25.18 14.01
Z A E H L R A T E N 9151.
6977.
5317.
4067.
3585.
2566.
1759.
932*.
682U.
5148, 3937.
3359.
2687.
1654.
9106, 688«.
5155.
39S4.
34*4.
2559, 1601.
S T A N O A R D K O N Z E N T K . S T A t O A R D L E E R t f E r t T d O )
56.9 NMOL/L 144.0 NMOL/L 305.0 N M O L / L 441.0 NMOL/L 885,0 NMOL/L 2215.0 N M O L / L
P R O Z . ( B O ) 103.68 76.52
>6.*2 42.06 35.90 25.69 14.64
S . D . 1.420 0.933 1 . 1 3 3 0.837 1.3*4 0.832 0.953
2 * S , E , M , 1,639 1 , 0 7 7 1.308 0.966 1 , 5 5 2 0,984 1,100
O R D I N A T E 103,97
7 5 , 5 7 57.13 42,43 36.07 25.73 14.59
Z A E H L R A T E N 9131.
6977, 5317.
4067.
3585.
2566, 1759,
9325.
6820.
5148.
3 9 3 7 , 3359.
2687.
1654.
9106.
6βββ.
5155.
3954.
3454, 2559.
1601.
Fig. 2a.
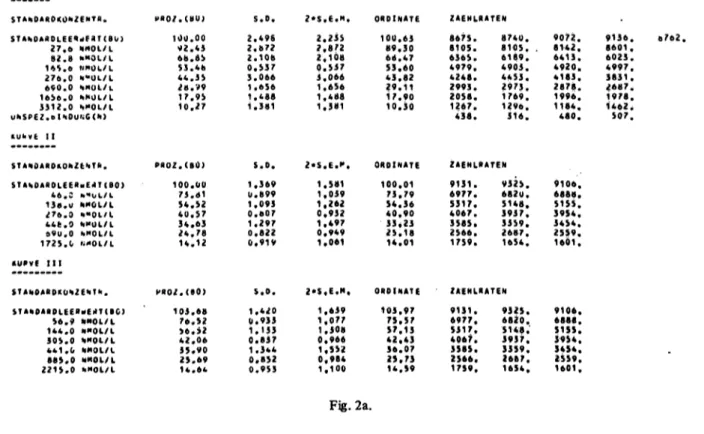
Fig. 2a-2f. A typical computer-print-out.
Fig. 2a. The explanation of the 3 curves used, and the data used in constructing the curves. Curve I is from the data and counts of the participant's own standard curve; curve II is the hidden standard curve using the organisers' assigned values and count-rates from the participant; curve III the values of the hidden standards measured by the participant and his own count-rates. Here BO is calculated as a percentage of the count-rates of the zero standard in curve I.
Methods and kit codes
43 participants used commercially available kits and 21 their own methods. 48 participants used radioirnmuno- assay (RIA), 15 used competitive protein binding analysis (CPBA) and one fluorimetry to measure cortisol. 36 partic-
ipants used 12SI, 20 used 3H and 8 used 7SSe labelled tracer. The code used for the kits was:
1. Clinical Assays (RIA - 125I-tracer) Tr venol, D-8000 M nchen.
2. Diagnostic Products Corporation (RIA - 125I-tracer) Biosigma, D-8000 M nchen
3. Amersham-Buchler (CPBA - 7$Se-tracer) D-3300 Braun- schweig.
4. Corning (RIA - 125I-tracer) IMA, D-6300 Gie en 5. Byk-Mallinckrodt (RIA - 125I-tracer) D-6057 Dietzen-
b ch-Steihberg.
6. Clinical Assays — Modified method — otherwise as Kit 1.
7. CIS (CPBA - 125I-tracer) Isotopen Dienst West, D-6079 Sprendlingen.
8. Lepetit (CPBA - 3H-tracer) Milan, Italy.
9. New England Nuclear (RIA - 125Ltracer) D-6072 Drei- eich.
s *
Own methods were not coded.
j. Clin. Chem. Clin, Biochem. / Vol. 18,1980 / No. 3
i t sssss
( i ) i r K U R V i II ι 00000
2 * S E * C U > : I K U R V E I I I ι ··.··
2 * S C M ( t I l ) | X
3C
SSSSSS···!
§•000 · 00000000
0000
sss•••SSS!»
0000····
000\
kSS·· SSS T
·· SS T
··· s$T 00 ·· T 00 »*S
000 «SS 00 ··$
00 *S 0 ··00
001 I
• XX
0 ·0 ·Τs·
0 »·OOTS
uα •s·
o sxs*
0 ItI f
ότι0 l 00· T
01T Of *ISX
tost*
0 S*X|
OOSti 111l·>s·
os*vo r·
01 IS 10 X00 •
··$··τ
000 Sf uotttx
I ISSSST TT
1,000 S.000 10,00 30.00 100,0 100,0 1000. SOOO. 10000.
Fig. 2b.The printout of the 3 curves.
Results of sample analysis
The content of the 20 serum samples is shown in table 1.
The results of the more interesting samples are displayed in table 3. Difference in results from samples 2 and 13 are due to the different matrix in the so-called cortisol·
free serum. Table 3 shows the results of samples either used for testing dilution or cross-reacting substances added to a serum sample.
Samples 1, 12 and 18 should be approximately the same if no cross-reactivity occurred between the antibody and corticosterone and 1 l^deoxyeprticpsterone, in the RIA, or if the binding proteins were specific for cortisol in the CPBA. In all CPBA the cross-reaction in samples 12 and
18 was high, reflecting the relatively unspecific nature of cortisol-binding-globulin (CBG) for these compounds.
The kit CPBA gave on average lower cross reactivity than the ''home-produced" CPBA, The one participant who
used fluorimetry to measure cortisol measured corti- costerone, but not 11-deoxycorticosterone, showing that his extraction method was specific for 11-hydroxy steroids.
The cross-reaction of the RIA-methods in samples 12 and 18 was varied, and depended to some extent on the derivative used to raise the antiserum. The antibodies raised to C
3-derivatives were more specific than those raised to C
2i4erivatives. The kits showing no cross- reactivity in both samples 12 and 18 (kits 2 and 6) were raised against C
3-derivatives.
The eortisol measured in samples 2 and 13 was similar, although on average sample 13 (stripped serum) gave a lower value than sample 2 (protein matrix). Both sample 2 and 13 gave significantly lower values than sample 1 (dexamethasone suppression-test).
In all cases where no interfering substances were present, all methods gave similar results seen in samples 13, IS
J. Clinu Chem. Clin. Biochem. / Vol. 18,1980 / No. 3
G E G E N U E B E R S U L L U N G D E N A N G A B E N D E S T E I L N E H M E N S M I T D E N VON D E N K U R V E N A B G E L E S E N E N W E R T E N
E K L A E U T E R U N G : ' L . T . * t L E S S T H A N ( D I E PROBE W A R N I C H T M E S S B A H N I E D R I G )
'G.T.· t G K E A T E R THAN ( D I E PROBE WAR N I C H T MESSBAH HOCH)
L I S T E D E R W E R T E
A B G E L E S E N V O N P H O B E N R .
12 54 i6 7 89 10 11 12 13 14 15 16 17 14 19 20
E I G E N E A N G A B E N K U R V E I K U R V E I I K U R V E I I I
29.500 1.000 100%.CGO
2O.OOO 144. U 2 2 1 5 . 0 0 0 4 4 1 . 0 0 0 3U5.000 56.900 1 1 3 7 . 0 0 0 805.000 114.000 1 2 . 1 0 U 262.000 4 0 1 . O O 1389.000 244.000 273.000 e V I . O O O 662.0.00
N M Q L / L N M O L / L N M O L / L N N O L / L N M O L / L N M O L / L N M O L / L N M O L / L N M O L / L N M O L / L NM L / L N M O L / L N M O L / L N K O L / L N M O L / L N M O L / L N M O L / L N M O L / L N M O L / L N M O L / L
29.524 ZU N I E D R I G 1 0 0 3 , 0 5 0 243.006 143.868 2209.160 440.301 304,844 56.493 1135.675 884.643 1 1 3 , 4 7 2 10,474 2 1 1 , 2 9 6 4 0 1 . 8 0 5 1386.852 242.902 2 7 2 . 4 1 0 687.002 660,434
N M O L / L N M O L / L N M O L / L N M O L / L N M O L / L N M O L / L N M O L / L N M O L / L N M O L / L N M O L / L N M O L / L N M O L / L N M O L / L N M O L / L N M O L / L N M O L / L N M O L / L N M O L / L N M O L / L
1 8 . 5 2 1 1 . 0 0 5 779,783 225,610 136,897 1 7 0 5 , 0 8 5 4 1 2 , 4 0 7 281.607 45.959 866.181 7 0 6 . 2 7 4 106,562 4,487 197,947 376.845 1043,089 2 2 5 . 5 2 0 2 5 1 , 6 5 7 707,709 570.901
N M O L / L N M O L / L N M O L / L N M O L / L N M O L / L N M O L / L N M O L / L N M O L / L N M O L / L N K O L / L N M O L / L N M O L / L N M O L / L N M O L / L N M O L / L N M O L / L N M O L / L N M O L / L N M O L / L N M O L / L
23.913 1 . 3 1 9 1005.406 249.821 148.341 2 2 0 4 . 6 1 7 445.488 3 1 1 . 2 2 5 53.905 1 1 3 7 . 4 7 1 887.535 1 1 5 . 9 4 0 6.568 2 1 7 , 9 9 3 407.303 1387.641 249.718 279.074 889.684 664.416
N M O L / L N M O L / L N M O L / L N M O L / L N M O L / L N M O L / L N M O L / L N M O L / L N M O L / L N M O L / L N M O L / L N M O L / L N M O L / L N M O L / L N M O L / L N M O L / L N N O L / L N N O L / L H N Q L / L N M O L / L
L I N E A R E R E G R E S S I O N S H E C H N U N G Z W I S C H E N D E N Auf V E R S C H I E D E N E A R T E R M I T T E L T E N W E R T E N
M I T H I L F E D E R R E G R E S S I O N S * E C H N U N G L A S S E N S I C H S Y S T E M A T I S C H E U N T E R S C H I E D E Z W I S C H E N D E N U N T E R S C H I E D L I C H E R R E C H N E T E N B E R T E N E R K E N N E N , ( I D E A L F A L L : K O R R . K O E F F , · 1 , ' R E G R . K U E F F ,·1 , A C H S E N A B S C H N I T T ' O )
E R L A f c U T E R U N G X D I E A M E R S T E R S T E L L E G E N A N N T E N W E R T E G E H E N A L S ' X1
A L S 'V I N D I E R E C H N U N G E I N . DIE AN Z W E I T E R STELLE GENANNTEN WERTE
K O R R . t O E F F . : ftEGR.KOEFF. ; A C N S E N A B S C H N . : A N Z A H L W E R T E :
( • Ε . Α . - Γ B E D E U T E T Z . B . , DASS D I E E I G E N E N A N G A B E N M I T D E N A N K U R V E I A B G E L E S E N E N W E R T E N K O R r t E L l E R T W U R O E N )
E.A.· I
1.000 1.001
•4.042 19
E , Α . - Μ 0.998 0 . 7 5 » 30.316 19
E . A , - I I I 1.000 0.999
•0,447 19
I · II 0.998 0 , 7 5 5 33,38$
19
I · I I I 1.000 0.998 3.602 19
I I · I I I 0.998 1 . 3 1 3
•54,612 20
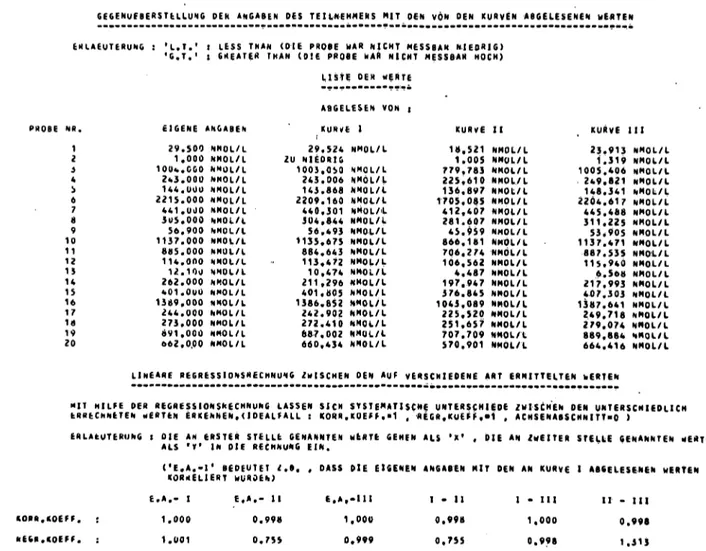
Fig. 2c. The 20 serum values read off the 3 curves compared with values given by the participant, together with regression data.
Tab. 3. A comparison of results from 7 serum samples as analysed using different methods/kits.
Method
No. of participants
Own RIA n=12
Kitl n=7
Kit 2 n=12
Kit 4 n=3
Kit5 n=3
Own CPBA n=6
Kit 3 n=8
Fluorl·
metry n=l
Tracer isotope 3jj 125j 125j 12Sj 12Sj
(nmol · Γ1) (nmol · Γ1) (nmol · Γ1) (nmol · Γ1 (nmol · Γ1
x S x S x S · x S x S
3Η 75Se -
(nmol-Γ1) (nmol-l"1) (nmol-l"1) x S x S x Serum No.
121 182 1315 19
15617 42915 35111 663
13117 30528 1488 136
7833 3043.8 3042.9 638
1036 3.729 2.262 136
4371 5713 35920 721
2721 1211 7.577 82
99156 3345.2 3790 706
1179
" 99 0.40 14855
11927 3698.9 2780 577
0.433 1114.6 930 245
81735 71435 36822 687
29922 22038 11023 201
30658 42629 ' 18334 685
3439 7629 2350
2180104 10834 503106 , 965
J. Clin. Chem. Clin. Biochem. /Vol. 18,1980 / No. 3
T E I L N E H M E « UN. 1
AUS-EATUHG ofcs coRTisoL-niNtvERsuCHs MAERZ-APRIL r? T E I L 2
I N OEM N A C H F O L G E N D E N L I S T E i S f OEM U N G E F A E N R E COAT I S O L - G E H A L T BZ*. D I E H E R S T E L L U N G D E R P R O B E N A U F G E F u E H U T . D U H I T » S T A N D A R D * B E Z E I C H N E T E N »ROBE*. D I E N T E N ZUR GEttlNNUMG DER « V E R S T E C K T E N · S T A N O A R D K U R V t N . ( S I E H E T E I L 1 ) D I F M I T » T E S T * OOIR »POOL· B E Z E I C H N E T E N P R O B E N D I E N T E N ZUR K O N T R O L L E P E S A S S A Y - V E R H A L T E N S
U N l k « » E R S C H U D E N E N B E D I N G U N G E N . D I E S I C H S T O E R E N D A U S W I R K E N K O N N T E N . V E R H A L T E N S IM E l f t / E L N E N H A B E N D I E PROBEN F O L G E N D E B E D E U T U N G l
PROBE 2 U N O 1i S O L L T E N M E I D E A L S fC O » T I S O L F R E I ' E R M I T T E L T « E R D E N .
D I E PROBEN 4.14 UNO 17 H REN G L F I C H < l P· M I T T L E R E N B E R E I C H ) UNO D I E N T E N / U R l N T R A - A S S A Y - O U A L I T A E T S K O N T R O L L E . D I E PROBEN 12 UNO 16 D I E N T E N ZUR P R U E F U N G AUF E V T L . K M E U Z R E A K T I O N E N ,
S l f c H A T T E N D € N G L E I C H E N C O R T I S O L - G E H A L T -1C PROBE 1 , K A M E N A * E H M I T S T O E R S U B S T A N / E N V E R M I S C H T . PROBE I S SOLLTE CTttA D E N M I T T E L W E R T Z W I S C H E N P R O B E 1 3 U*0 1 9 E R G E B C N .
D I E PROBE 1 6 D I E N T E ZUR PftUEFUNG U N S P E / 1 F I SCHER S T O E R E F F f i K T E .
1 TEST O E V A M E T N A S O M S U P P R I M I E R T 2 STANDAMD
3 T t S T S C H W A N G E R S C H A F T 2 . M A E L F T E 4 POOL N O R M A L f e E R E l C H
5 STANDARD 6 S T A N D A R D 7 STANDARD B STANDARD 9 STANDARD
10 TEST CUSMl*G*SYNOROM 11 STANDARD
12 TEST DCBAMETNASON * C O R T I C O S T ί β Ο Ν 15 TEST ^ S T R I P P E D SERUM* < 0 - w E R T >
14 POOL » O R f t A L B f R E I C H
15 TCST ACTH * ' S T R I P P E D SERUM* 1|1 16 TEST MIfCrtlERUM VON 100 P A T I E N T E N 17 POOL N O R f A L B E R E I C M
1B TffST OEKAMETMASON * 1 1 - D C S O X V C O R T I C O S T E R O N 19 TEST A C T H - S T I M U L l f R T
2U POOL CRCNZwERT/ERNOtNT
0 N M O L / L
13B N M O L / L 1723 N M O L / L 448 N M O L / L 276 N M O L / L 46 N M O L / L
690 N M O L / L 700 N M O L / L
723 N M O L / L
Fig. 2d. The composition of the 20 sera.
and 19, where 15 lay, as expected midway between 13 and 19.
In contrast to an earlier EQCS for thyrotropin (2) the results from the hidden standard curve were not much better than those from the standardised laboratory-own curve. This is perhaps due to the fact that the antibodies used were raised against different cortisol-protein con- jugates, that all methods involved a prior extraction/
denaturation step and the relative unspecific binding characteristics of CBG. The use of a non^ideal matrix in which the standard curve in the survey samples was set up had most probably little or no influence on the results when the assay conditions are examined.
The results for sample 17 are shown in figures 3 a— 3c s constructed from laboratory results, from the standard- ised laboratory result and from the hidden standard curve. These pictures emphasise what is written in the previous paragraph.
Coincidence of standardised laboratory curve and hidden standard curve occurred in 28 cases (56 %). The
regression equation as read off the laboratory own and standardised laboratory curve was better than y = a + (0.9 to 1.1) χ in 36 cases (72 %), an index for the ability to read data from a standard curve. Within the same limits, the regression line between standardised laboratory
curve and hidden recovery curve was identical in only 13 cases (26 %), and serves as an index for the accuracy of the assay.
The number of participants with an intra-assay coefficient of variation (CV) under 5% was 21 (33 %), between 5 and 10 %, 16 (25 %), between 10 and 15 %, 7 (11 %) and above 15 %, 20 (31 %). The minimum CV recorded was 0 % and the maximum 86 %.
Discussion
The amount of data returned in the "Munich-Model"
EQCS is enormous and it is difficult to extract only
those data which give the maximum information to the
participant, The visual aid effect of the standard and
hidden standard curves show the participant at a glance
J. Clin. Chem. Clin. Biochem. / Vol. 18, 1980 / No. 3ftp. IHR riE*T χ ALLE T E I L N E H M E R T E I L N E H M E » N I T I H « E M K I T < N R 1 )
« I T T E L W E R T S . O . 2 - S . O . - B E R E I C H M I T T E L W E R T S.O. 2 « S . O . - B f c M E l C H
1 32 45
6 7 dV 1011 1213 U1J 1617 1819 20
29. SO 10V4.00O.OU 243, 00 144. O 2215. 00
4* T*. 00 305.00 56. VO 1137.00 685. GU 114.00 12.10 262.00 401.00 1369. Ου 244.00 273.00 691.00 662.00
37.20 25, V3 V19.76 236.11 172.35 1726.75 500.89 342.3?
62.31 87«. 24 7β3.95 176.44 22. 7 234.31 368.93 773,47 236.14 2V4.13 722.47 54*. 28
15.98 22.00 173.21 47.36 49.57 363. V«
121. B 112.72 32.75 148.54 206.12 161.38 16.11 34.33
«4.37 307.99 61.55 204.02 15*. 15 134.08
•18.0*5.24 573.35 U1.3B 73.21 99* .80 258.73 116.93
•3.18 581.16 371.71 -146.32 -10.16 125.65 200.20 157.50 113.05 -113.91 414.16 280.12
69.16 69.94 1266.17 530.84 271.49 2454.70 743.05 567.81 127.00 1175.32 1196.19 499.20 54.30 542.97 537,66 1309.44 359.23 702.17 1030.78 816.44
33,18 15.58 1034,23 241.84 168.89 2158.57 511.01 530.59 58.51 987,07 827.17 93.66 10.38 232.04 343.71 1216.08 242.52 364.45 765.78 585.09
10.08 14.33 107.98 37.29 27.40 134.75 86,64 55.46 25.21 121.46 110.16 18.58 4.04 51.55 37.15 194.25 62.04 58.69 179.93 60.29
13.01 - -13.07 - 818.27 · 167.26 · 114.09 · 1889.07 · 337.73 - 219,68 - 8.10 - 744.14 · 606.86 · 56.91 - 2.29 * 129.38 - 269.42 - 827.62 - 118.43 · 247.05 · 403.91 · 464.51 -
53.35 44.23 1250.19 516.42 223.69 2428.07 684.29 441.50 108.92 1230.00 1047.48 130.41 18.47 554.70 418.00 1604.54
566.61 481 .81 1123.65 705.67
I N T R A - A S S A V - t A R l A N Z AUS DEN » R O B E N I 4 . 14 f 17 .
M I T T E L W E R T * 249.67 S.O.* 10.693 V . U . · 4.28 P*02.
AI6ELESCN VON K U R V E I :
NR. I H R «EfiT : A L L E T E I L N E H M E R
M I T T E L W E R T S.O. 2 « S . O . - B E R E I C H
T E I L N E H M E R M I T I H R E M K I T (NN 1 )
M I T T E L W E R T S,D. 2»S.O.-BEREICH
1
·· 2
1011 1213 1415
• 1617 1V1*
20
N E H M E R N R A B G E L E S E N
29.52 1003.050.00 243.01 145.87 2209.16 440.30 504.84 56.49 1135. 6/
884.64 113.47 10.47 211.30 401.81 1386.85 242. 90 272.41 887. OU 660.45
VON K U R V E I I :1
32.80 23.50 V40.29 227.61 155.86 1860.82 485.33 307.35 52.28
¥19.94 770,86 151.88 17.04 224.87 455.56 746.85 231. 4*
295.58 736.13 546.02
18.31 22.98 160.92 42.09
44.69
338.71 108.71 89.76 27.08 157.18 167.50 129,14 15.73 58.50 94.30 292.88 73.76 209.29 166.94 119.22
-3.81.
-22.45 618.45 143.42 66,49 1183.41 267.92 127.82
•1,89 645.59 455.86
•106.40
•14.45 107.87 166.97 161.07 83.90
•123.00 398.24
69.41 69.45 1262.15 311.80 245.25 2538.25 702.74 486.88 106.45 1194.29 1105,86 410,16 48.51 341,87 544.15 1332,59 378,94 714,16 1074.02 509.59 782,45
Fig. 2e.
25.45 11.37 1069.73
226.65 147.20 2152.19 507.11 320.10 51.55 999.19 860.79 85.17 214.946.39 551.39 1264.51 209.56 555.30 784.36 612.46
9.849.66 109.85 34.46 41.42 208.78 88.52 55.37 28.71 118.08 81.13 21.90 55.374.29 74.69 172.46 33.61 63.29 169.67 97.41
-7.965.77 850.02 157.74 64.35 1714.64 330.07 209.37 -5.«7 763.02 698.52 41.37
•2.20 106.21 202.02 919.40 142.34 221.73 445.02
45.15 30.70 1289.44 295.56 250.05 2549.74 684.15 430.83 108.97 1255.56 1023.0«
128.97 14.98 321.67
»00.7«
1609.22 276.78 481.07 1123.70 417.63 807.29
N R . IHR W E R T t A L L E T E I L N E H M E R T E I L N E H M E R M I T I H R E M K I T ( N R 1 )
M I T T E L W E R T S.O. 2 * S . D , - B E R E I C H M I T T E L W E R T S . D . 2 · $ . D , - B E R E I C H 1
23 4 56 7 β 9 1011 12 1314 1516 17 1d19 20
18.52 779.781.01 225.61 136.90 1705.03 412.41 281.61 45.96 666.18 706.27 106.S6 4.49 197.95 376.84 1043.09 225.52 251.66 707.71 570. 9C
27,10 10.51 837.16 187,02 135.73 1704.38 4 4 4 . 0 2 270.66
41.39 830.27 702.88 152.14 16.18 185.93 324.86 723,64 193.40 256.22 672.44 495.35
15.93 10.95 186.89 41.80
7. ·95 28.64 19.03 23.59
5.56 127.61 33.42 173.82 9.08 56.75 77,12 270.37· »
45.25 180.31 124.ο1 81.64
-4.76 - -11.39 - 463.37 - 103.43 - 119.83 - 1647.10 - 405.97 - 223.48 - 30,26 - 575,05 - 636.04 - -195,50 - -1.98 - 110.44 - 170.63 - 182.89 - 102.90 - -104,40 - 423.21 - 332.07 -
58,96 32.41 1210.95
270.61 151.63 1761.66 482.07 317.84 52,52 1085.49 769.72 499.78 34.34 257.42 479.09 1264.39 283.90 616.84 921.67 658,65
19.38 3. 80 843.54 198.49 135.15 1712.21 426.12 272.60 46.72 797.63 695.30 78,28 190.222.89 303.73 979.68 202.64 303.80 638.04 485.68
12.18 3.69 89.51 36.42 12.40 28.778.03 16.64 13.16 55.54 58.37 35.97 2.26 40.74 62.54 106.10 46.08 28,70 135.90 51.50
-4.98 - -3.59 - 664.52 - 125.64 - 110.36 - 1696.14 - 368,. 59 - 239.32 · 20.40 · 690.54 - 616.56 - 6.35 - -1.63 - 106.74 - 179.05 - 767.49 - 110.47 - 246.40 - 366.25 - 382.69 ·
43.74 11.19 1022.56
271.34 159.94 1728.26 485.65 305.66 73.04 904.72 772.04 150.21 7.41 271.70 428.41 1191.67 294.81 361.20 909.83 588.67
Z E I C H E N E R K L A E R U N 6 J
' · ' : W E R T L I E 6 T A U S S E R H A L B DES 2 * S . O . - B C R E I C H S A L L E R T E I L N E H M E R . '··': WERT W A H N I C H T M E S S B A R .
Fig.2f.
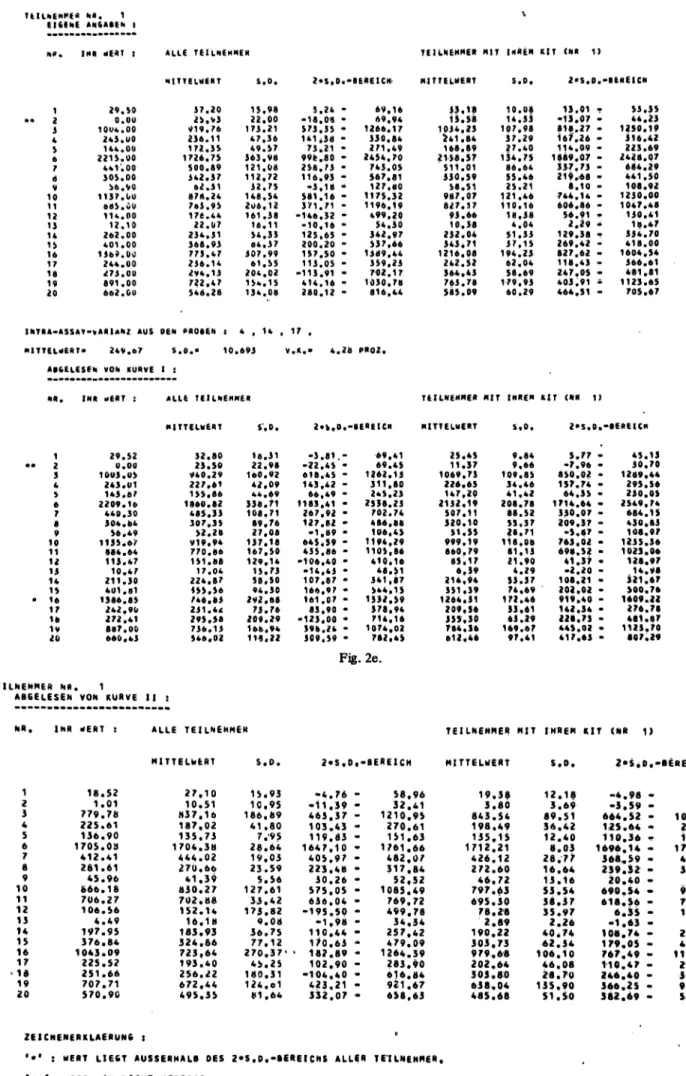
Fig. 2e-2f. Values determined by the participant compared with values obtained by other participants using the same kit, and read off the participant's standard curve, the standardised (curve I) and the recovery (curve II) curves. The mean, standard deviation (S) and ± 2S ranges are given.
51 113 175 236 298 359 Q
|""T1 4
20 |33 (95
48
»
2 161031
26 '
5-
1026
42β
5 474
«
5 2711042
242 3
1016 312
17*
9
^— gl
^2105 362 35 18 102
it-
SO3 7 72
11
«'
1H 1
8 442
36 373
23
<35 3±
H M
3 21 1 1 2I» |45 I |4, |ΐ2Ί ,.
462
41 32 421
b
„ . I7l , l^
// 1 1 10 84
495 5
*o5 33*
«5
»2
25
16
i
158
103 27
,07«
I·1
47 24
„
73 * 1042
,o,s 3,'
«'
β ' 105α
« 2
ο5 9
Ί
2312 so362
35 18 Η3
22
1 1
15 1 36 45 21 733 73| 2 3 ψ* |263|4lV|44(212 305 379
3
, „ιη ι //
453
C
// Ι58 -3s
204|33<
, ί^Ι
1 103 495
.ο5
«k 1
486
42 28 5
105 39 23 16 K3
1016 292 18 15 1
104 1026 3 22
37 24 172 9
e,' „2
27 32
474 44 36 62
Z 35 31 21
10
GZ« 1
, U W5 [zS U7l |SO l , /f\32 | 103 148 193 239 284 329 -2s -s χ" +s *2s *3s
Cortisol (nmol/l)
Fig. 3a-3c. The distribution of sample 17 (pool serum) from results given by the participant (fig. 3a), read off the standardised curve (fig. 3b) and from the hidden recovery curve (fig. 3c). The abscissa values are mean ± 3S range. The figures in the boxes are: lower left, participant number and upper right, kit number. Values lying outside the ± 3S range are shown on the extreme left and right of the histograms.
if his assay is in order or not, although it must be stated that this is only strictly true for this one assay.
This is in itself a disadvantage of the "Munich-Model"
EQCS, which can only perform a spot-check on how a laboratory performs. This information is very im- portant, especially in a country in which a large number of commercial kits are used. Changes in protocol, anti- body, and tracer are not infrequent, and these can give rise to different results as seen in the comparison between kits 1 and 6 in this survey where new anti- body, tracer and protocol considerably reduced the cross reactivity between 11-deoxycorticosterone and cortisol.
Another disadvantage of this system is its time-con- sumption and its limitation to one, or at the most two components. This means that the same component cannot be repeated inside a 2-year period unless;it is carried out by an institute specially designed to per?
form such quality control surveys. A few examples will make this more clear. The data from each partic- ipant is transferred to between 30 and 35 punched cards (20 for the samples, 3 for the assay data and
between 7 and 12 for the laboratory-own standard curve, including total counts and unspecific binding).
The modification of the computer programmes has been minimised by the modular construction used, but around 100 punched cards are needed for the headings and serum composition, together with 20 cards for each kit, containing mean and s.d. for each sample, and 60 cards containing sample number mean and s.d. for the histograms. The first 100 text-cards must be written by band, the latter 80 data cards are punched by commands from the computer. Each participant's printout of 6 pages took approximately 3V£ minutes, most of this time being spent on the curve plotting, and each histogramme — in this EQCS
— took between 10 and 11 minutes. Together with the photo-copying time needed so that each participant received the 20 histograms for the samples and an ex- ample read from the standardised and hidden standard curve, one can begin to appreciate the real time needed — simply for sending the results back to each participant.
As can be seen, this type of survey must be coupled to a regular 2 or 3 sample EQCS, which are at present run in
J. Clin. Chem. Clin. Biochem. / Vol. 18,1980 / No. 3
laboratory internal quality control scheme.
Another interesting point in the "Munich-Model" is the provision of correlation data between own results and those from the standardised and hidden standard curves.
Here, it is very easy to see if errors which have arisen are of a methodological or random nature. For example a good correlation coefficient with a regression line slope widely deviating from 1.0 points to a methodological error (perhaps wrong dilution of standards) whereas a bad correlation coefficient indicates a non-optimal assay system.
This type of EQCS has had a positive spin-off effect, that of monitoring the quality of commercial kits, without having to do anything except send the results to each participant. The effects of this, and of earlier EQCS from this laboratory (2) have led to a subsequent improvement of methodology and quality in commercial kits, and this method of "automatic-policing" is far more effective and much cheaper and quicker than legislative measures, which must be constantly updated to keep in touch with a rapidly moving field such as hormone analysis.
The two-way contact opened up between kit-producers and organisers in this type of EQCS has led to a positive dialogue often resulting in improvement in kit-perform- ance by optimation of methodology, thus paving the way for comparable results between different kits, a goal which must be attempted, especially for peptide and proteohormones. That this state of affairs is by no means achieved even for a small molecule like cortisol, can be
relatively low coincidence of hidden and laboratory-own standard curves (26 %). The use of non-specific methods, here the CPB assays, show in their high cross-reactivity with closely related compounds, that many laboratories still use techniques which have long since been superseded by more modem technology — in this case RIA and
125
I-labelling, which give remarkably good results and are to be recommended, at least until the next gener- ation of tests has been developed and proofed.
The participant, for relatively little cost arid work-load, receives a large amount of data, with which he can ex- amine his method for faults, if such have arisen, and with which he can compare his performance with other methods and participants. The complete anonymity of participants, reduces the inhibition to make contact with the organisers should a participant require help, which is a very important point. To conclude, although these EQCS are laborious, they provide enough positive influence on the current state of hormone assays to warrant their continuance.
Acknowledgements
The authors would luce to thank Fräulein Gabriela Kuflicki for help in preparation and sending the samples, to Frau Marianne Preisendanz for typing the manuscript and tables, to Professor Dr. E. Kuss for supplying the serum from pregnant women and to Abbott GmbH, D-6070 Langen, for giving permission to use their styropor box moulds in conjunction with pebra GmbH, D-7129 Brackeriheim. This project was supported by the Bun- desministerium für Forschung und Technologie, D^5300 Bonn 12, Federal Republic of Germany.
References
1. Richtlinien der Bundesärztekammer zur Durchführung der statistischen Qualitätskontrolle und von Ringversuchen im Bereich der Heilkunde (1974) Dtsch. Ärzteblatt 13, 959-965.
2. Marschner, L, Erhardt, E. W. & Scriba, P. C. (1976) J. Clin.
Chem. Clin. Biochem. 14, 345-351.
3. Marschner, L, Bottermann, P., Erhardt, F., Linke, R., Löffler, G., Maier, V., Schwandt, P., Vogt, W. & Scriba, P. C (1974) Horm. Metab. Res., 6, 293-296.
4. Horn, K., Marschner, I. & Scriba, P. C. (1976) J. Clin. Chem.
Clin. Biochem. 14, 353-360.
5. Dwenger, A. & Trautschold, I. (1978) J. Clin. Chem. Clin.
Biochem. 16, 587-596.
6. Reinsch, C. H. (1967) Numer. Math. 10,177-183.
7. Marschner, L, Erhardt, F. & Scriba, P. C. (1974), Calculation of the radioimmunoassay standard curve by "spline-function'*.
In Radioimmunoassay and Related Techniques in Medicine, IAEA, Vienna, pp. 111-122.
Dr. W. G. Wood
Laboratorien für Klinische Chemie und Endokiinologie Medizinische Klinik Innenstadt
Ziemssenstr. l D-8000 München 2
J. Clin. Chem. Clin. Biochem. / Vol. 18,1980 / No. 3