J. Clin. Chem. Clin. Biochem.
Vol. 19, 1981, pp. 441-445
An Evaluation of Suitable Functions for the Insulin Standard Curve
By G. L. Atkins
Department of Biochemistry, University of Edinburgh Medical School, Edinburgh, Scotland (Received August 27, 1980/January 23,1981)
Summary: The insulin radioimmunoassay technique used for human insulin has been modified for measuring rabbit insulin (i) at lower concentrations of insulin in plasma, and (ii) more precisely.
Eleven algebraic functions were fitted in turn to fifty-three data sets. The goodness-of-fit was assessed in each case.
It was concluded that a quadratic equation was the best function for the standard curve of the modified immuno- assay, although this function is not necessarily the best for other different immunoassays.
Bewertung geeigneter mathematischer Funktionen für die Insulin-Standardkurve
Zusammenfassung: Der Radioimmunoassay für menschliches Insulin wurde modifiziert, um Insulin vom Kaninchen in geringeren Konzentrationen und genauer zu bestimmen.
Elf algebraische Funktionen wurden im Wechsel 53 Datensätzen angepaßt. Die Güte der Anpassung wurde in jedem Fall ermittelt.
Eine quadratische Gleichung wurde als beste Funktion für die Standardkurve des modifizierten Radioimmunoassay befunden, obwohl diese Funktion nicht notwendigerweise die beste für andere unterschiedliche Immunoassays ist.
introduction
As part of a programme for investigating models of the glucose-insulin control system, we intend to use rabbits as experimental animals, and to measure their plasma insulin precisely. Because all the published methods and the assay kits commercially available for measuring in- sulin by radioimmunoassay are primarily intended for human insulin, it was necessary to modify the procedures to measure rabbit insulin. This was for three reasons.
First, the porcine insulin standards generally used do not produce the same results äs rabbit insulin standards.
Secondly, insulin concentrations in rabbit plasma during fasting are lower than those for humans and are below the range of the usual standard curve. Thirdly, it was decided to restrict the range of standards so that only the steeper part of the standard curve was used in order to give better results.
Because the new method was sufficiently different from those established for measuring human insulin we could not assume that a logit equation was valid for the stand- ard curve. It was therefore necessary to fit several algebra- ical functions and compare their suitability. Several authors have investigated various functions for insulin standard curves (1,2, 3). We have fitted many more
functions and analysed the fit of each curve to the experimental data more rigorously.
Several elegant treatises have been published on how antigen-antibody systems should behave (4). Unfor- tunately most radioimmunoassays do not behave accord- ing to theory so it is not possible to fit theoretical standard curves to data, nor can one use simulation techniques to investigate the fit of standard curves (cf.
the Michaelis-Menten equation (5)). It is necessary there- fore to use empirical functions and then attempt to assess and compare their goodness-of-fit to the data (6).
Methods
Radioimmunoassay for rabbit insulin Materials
Phpsphate buffer, (40 mmol/1, pH 7.4) was prepared according to Hales & Rändle (7). Rabbit insulin was a gift from the Novo Research Institute and was supplied freeze-dried (100/ig) with human albumin (1 mg). It was diluted in two stages with phos- phate buffer to give the standard solutions. Insulin binding reagent and [12*I]insulin (bovine) was obtained from the Radio- - chemical Centre, Amersham. Solutions were prepared according
to the suppliers1 instructions. Rabbit plasma, insulin-free, was prepared according to Albano et al. (8). Buffer, for washing the filter discs, was prepared using 125 ml horse serum (Horse serum, No. 2; Wellcome) plus 125 ml phosphate buffer.
0340-076X/81/0019-0441S02.QO
'© by Walter de Gruy ter & Co. · Berlin · New York
De-ionised water was used for all solutions. Plastic disposable tubes (1 ml) were obtained from Luckham Ltd., Burgess Hill, Sussex, England. Membrane filter discs were from the Radio- chemical Centre. Dioxan-based liquid scintillation fluid was prepared according to Bray (9).
Method
Six standard insulin concentrations were used: 13.6, 27.3,40.9, 54.6, 68.2 and 81.8 pmol/1. Into a 1 ml plastic tube were placed 100 ìÀ buffer, 50 ìÀ standard insulin solution, 150 ìÀ insulin- free plasma and 50 ìÀ insulin binding reagent. Each standard was measured in quadruplicate. The tubes were left at 4 °C for 24 h and then 50 ìÀ 112*I]insulin was added. After a further two days at 4 °C the solutions were filtered through membrane filter discs by vacuum filtration and the discs washed twice with 1 ml washing buffer at 0 °C. The filter discs were trans- ferred to empty counting vials and dried at 120 °C for 10 min.
Scintillation fluid (10 ml) was added and the vials counted in a Packard Liquid Scintillation counter (model 3320) for a time such that at least 1000 counts were recorded for the highest standard, i.e. lowest count rate.
Algebraic functions
y = count/min bound insulin (in presence of unlabelled hormone)
yj - total count/min 7T= — X 100
yj
y$ = count/min bound insulin (in absence of unlabelled hormone)
y
0= — ÷ loo, r = i/r
0 JVo÷ = concentration of unlabelled hormone pmol/1 Pi = parameters to be estimated
fl, b> c = general constants Functions used
Eleven functions were used and they were arranged into a form y = f(pi,x), where;/ (count/min) was the dependent variable
and ÷ (pmol/1) the independent variable.
1. Two parameter
\ Ë Morgan ttal (10) y=pi+p2 -Iog10(x)
1.2 Hyperbola (Rodbard, method 4 (11))
2.3 Hyperbola (T ljedal & Wold (1)) l
becomes
(Pi-*)
2.4 Exponential
2.5 Chard (12)
or, where,
2.6 Sigmoid (Taljedal & Wold (1))
3. Four parameter 3.1 Cubic
3.2 Brown et al. (13)
can be transformed into y = £4 · exp
3.3Malan etal. (14) (P1+P2-*
-4 · p3 ^x) -p2J>
can be transformed into 1 (Pi+P2 -x) 2. Three parameter 2.1 Quadratic
y=Pi+p2 -X+P3-X2
2.2Lpgit(ll)
can be transformed into
P3
Curve fitting
Background coXmt rates (about 30 countsVmin) were negligible compared with the count rates of the standards and were there- fore. not subtracted. Each count rate Was usiH as a separate data point. A slandard^curve was fitted to 24 equaUy weighted points using non-linear regression (15, 15). Recent work (Michaelis- Menten equation) has shown that there is ho advantage iri cal- culating a weighted mean of the quadruplicates and then fitting a standard curve to the six means using appropriate weighting rather than using 24 equally weighted points (17).
Model testing
Previous assessments of |oodrie$s-or>fit of irtsulin RIA standard curves used mainly tne F-test (1, 2,.3). In this survey we have used 6 tests on each curve fitted: They ate dispussed in greater detail elsewhere (6) but they are briefly described below. The first test was to calculate the sum. of square of residuals (l+exp{p1+p2.logeW})
J. Clin. Chem. Clinu Biochefn. / VoL 19,1981 / No. 7
where >Obs wa$ tne experimentally observed count rate and .Vcalc was the predicted value calculated by the curve fitting
program. The lower the value of SSR, the better the goodness- of-fit. The second test plotted Rankits PS the residuals (y0bs - ycaic). If the residuals were normally distributed the points lay
close to a straight line. The third test plotted the residuals vs the independent variable (insulin concentration) and calculated a probability (P) that their distribution would have been expected from a normal distribution. This if often palled a "Runs test".
The fourth test explored the sum-of-squares surface near the minimum. Generally, only models which fit data well give a symmetrical surface at this point. The fifth test was less quantita- tive and concerned the nature of convergence of the non-linear regression to a solution. Experience shows that convergence is slow or difficult with a poor model. The sixth test expressed the standard deviations of the parameter estimates as percentage coefficient of variation. With a good fit these are approximately equal. The results of these six tests were considered together to give an overall assessment of goodness-of-fit.
Finally, the assessments for the curves fitted to each data set were compared and ranked according to their gpodness-of-fit.
Computer
The computer programs were written in IMP (an advanced language developed in Edinburgh from Algol and Atlas Auto- code) and run on the IBM 350/155 a*t the Edinburgh Regional Computing Centre.
Results
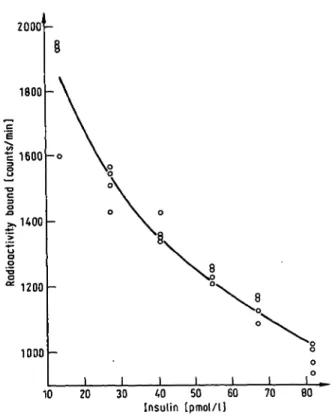
Fifty three sets of experimental data were obtained al- together. Figure 1 shows one of these data sets. The fitted curve is a quadratic. The eleven functions were fitted to each data set in turn. At the completion of this stage it was apparent that three of the functions fitted the data poorly. They were: no. 2.3, the hyperbola of Täljedal & Wold (7); no. 2.6, the sigmoid of Täljedal &
Wold (1); and no. 3.2, the function of fypvrn et al. (13).
This was apparent by the large number of occasions in which it was impossible to get the computer program to converge satisfactorily. Recently it has been pointed out to nie that functions 2.2 and 2.6 are mathematically identical. If in function 2.2 pl is replaced by In(/?1/p3), and p3 by l/p3 then function 2.6 is obtained. However the observation that one model, with a different arrange- ment of parameters, should fit better than the other is not unknown in model fitting.
2000 -
1800
.£
1600
J400
1200
1000
I _ 10 20 30 40 50 60
Insulin [pmol/U 70
Fig. 1. A quadratic function fitted to one of the data sets. Note that the four data points at each insulin concentration appear to be widely separated because the ordinatc has been abbreviated and expanded.
The fit of the remaining eight functions to each data set was then analysed by the model testing program.
The results for one data set are given in table 1. Com- parison of the fit of each function allowed the goodness- of-fit of each function to be ranked from 1 (the best) to 8 (the worst). Table 2 shows the rankings for each data set.
Discussion
Future work on modelling glucose homeostatis requires precise and accurate estimates of insulin in rabbit plasma.
It has therefore been necessary to modify the existing
Tab. 1.' Results of the model testing on one data set. The final rank is obtained by overall assessment of the six statistical tests.
Function:
SSRRankits plot Run's test P
Sum of squares surface Convergence
SD pararns
Rank
(1-1) Morgan
etal.
good77.6 very good0.31 very good 2.35.5
2
(1.2) Rodbard's hyperbola 80.3very poor 0.74good slow3.1 6.0 4
(2.1) Quadratic very poor87.2 very good0.59
15.93.5 32.9 5
(2.2) Logit 88.5poor very good0,11 slow high
7
(2.4) Exponential 120.9 good0.03 very good very good high
8
(2.5) Chard poor79.0 good0.31 poor very high
6
(3.1) Cubic 67.4poor ' very good0.95
24.85 8 46.139.0
1
(3.3) Malan
At -al
good71.2 good0.64 very good high
3
J. Clin. Chem, Clin. Biochem. / Vol. 19, 1981 / No. 7
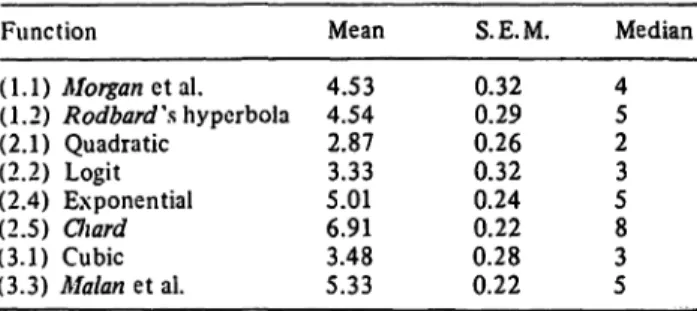
Tab. 2. Summary of rankings. The mean of the individual ranks with S.E.M. (n = 53) and median is presented.
Function
(1.1) Morgan et al.
(1.2) Rodbard \shyperbola (2.1) Quadratic
(2.2) Logit (2.4) Exponential (2.5) Cliard (3.1) Cubic (3.3) Malan et al.
Mean 4.534.54 2.87 5.013.33 6.913.48 5.33
S.E.M.
0.320.29 0.260.32 0.240.22 0.280.22
Median 45 23 58 53
method, for measuring insulin in human plasma, so that it will measure insulin in the rabbit. The first important modification is that rabbit insulin has been used as the standard. Unpublished work shows that the use of porcine insulin as a standard produces high estimates of rabbit insulin concentration, as much as 100% at some insulin concentrations. Secondly, precision has been increased by using only the steepest part of the standard curve. In practice, plasma samples may have to be diluted with plasma to bring them within the range of the abbre- viated standard curve.
Because the assay has been modified there was no guarantee that the logit curve used for human insulin assays will be applicable. It was therefore necessary to determine the best function to use as a standard curve for the new assay. Many functions have been proposed for standard curves and, as far as can be ascertained, all of those published up to 1973 have been included in this survey. The number used here is greater than in previous surveys (1,2,3). It would be desirable to use a theoretically derived function (e.g. Feldman et al. (4)) for the standard curve. However, in practice, binding assay curves often do not appear to obey these theories.
It was therefore necessary to use empirical functions.
One disadvantage of the current use of the logit curve is that the data is transformed so that a straight line can be fitted, although the logit function has been fitted directly (18). It is well known in other areas of bio- chemistry (c.f. the Michaelis-Meriten equation, (5)) that transformation of data introduces bias into the fitting of functions, if the error is normally distributed, and will therefore lead to inaccurate results. In this survey all the functions were fitted directly by non-linear regres- sion so that no bias was introduced, assuming a normal distribution of errors.
The problem then is to assess the goodness-of-fit to decide which, if any, of the empirical functions is the best. Taljdal & Wold (l)'Jchihara et al. (2) and Schönes- höfer (3) used principally the F-test, which is usually
considered to be rather insensitive. Malan et al. (14) claimed to have applied many statistical tests in their survey of several functions, but full details of this work do not appear to have been published. The current survey is an improvement on these other studies, because a wide range of statistical tests of known reliability has been used (6).
the results shown in table 2 show that from the mean and the median of its rank a quadratic function is better than any other, although it might not be significantly better than the logit function. Next in goodness-of-fit are the logit function and the cubic function, and here there is ho significant difference between the two. It is therefore proposed to use a quadratic function for the standard curve in all future work using this insulin assay.
These conclusions are not of general application to all immunoassay standard curves. A survey of the above functions for use with an immunoassay for cAMP (Atkins, unpublished) produces quite different results and indicates that an entirely different function is appro- priate. Marschner, Herndl & Scriba (19) evaluated four equations for use with ten different immunoassays. They showed that for two-thirds of the assays all four equa- tions were equally suitable, but for the other immuno- assays some equations gave better results depending mainly on the type of error likely to be present in the data. Schöneshöfer (3), also, has shown that different standard curves are required for steroid and peptide assays. It is therefore apparent that no one algebraic function can be used for each type of immunoassay.
When any new immunoassay is devised, some work must be included to choose the most suitable function for the standard curve.
Since this manuscript was prepared,Marschner et al. "
(19) have introduced the use of spline functions for standard curves. Although these functions have been used much in physics and technology for fitting curves to data, this example of their application to immuno- assays appears to be the only one so far. Their work shows that a spline function can be used with ten different types of assay and overall it is better (although sometimes only marginally) than three other types of standard curves. Spline functions may therefore be applicable more generally than most other functions used to date for immunoassay standard curves, arid thus they need to be investigated more fully.
Acknowledgements
I would like to thank Miss Caroline Thompson for her expert assistance. This work was supported by a grant from the Science RescarduCouncil.
L Clm. Chem. Clin, Biochem. / Vol. 19,1981 / No. 7
References
L Taljedal, I.-B. & Wold, S. (1970), Biochem. J. 119, 139-143.
2. Ichihara, K., Yamamotq, T., Kumahara, Y. & Miyai, K.
(1977), Clin. Chim. Acta 7P, 331-340.
3. Schöneshöfer, M. (1977), Clin. Chim. Acta 77,101-115.
4. Feldman, H., Rodbard, D. & Levine, D. (1972), Anal. Bio- chem. 45, 530-556.
5. Atkins, G. L. & Nimmo, I. A. (1975), Biochem. J. 149, 775-777.
6. Atkins, G. L. (1976), Biochem. Soc. Trans. 4, 357-361.
7. Hales, C. N. & Rändle, P. J. (1963), Biochem. J. 88,137- 8. Albano, J. D. M., Ekins, R. P., Maritz, G. & Turner, R. C.146,
(1972), Acta Endocrinol. 70,487-509.
9. Bray, G. A. (1960), Anal. Biochem. 7, 279-285.
10. Morgan, C. R., Hardigg, J. B. & Fisher, D. D. (1967), Dia- betes 16, 734-737.
11. Rodbard, D., Bridson, W. & Rayford, P. L. (1969), J. Lab.
Clin.Med. 74,770-781.
12. Chard, T. (1971), in Radioimmunoassay Methods (Kirk- ham, K. E. & Hunter, W. M., eds.) p. 595-598. Churchill Livingstone, Edinburgh and London.
13. Brown, G. M., Boshans, R. L. & Schalch, D. S. (1970), Comput. Biomed. Res. 3, 212-217.
14. Malan, P. G., Newman, G. B. & Ekins, R. P. (1973), Acta Endocrinol. 75,8177,99.
15. Atkins, G. L. (1971), Biochim. Biophys. Acta 252, 405- 16. Atkins, G. L. (1977), Comput. Biol. Med. 7, 321-325.420.
17. Atkins, G. L. & Gardner, M. L. G. (1977), Biochim. Biophys.
Acta 468, 127-145.
18. Healy, M. J. R. (1972), Biochem. J. 130, 207-210.
19. Marschner, I., Herndl, R. & Scriba, P. C. (1980), J. Clin.
Chem. Clin. Biochem. 18, 105-109.
Dr. Gordon L. Atkins Dept. Biochemistry
University of Edinburgh Med. School Teviot Place
Edinburgh EH 8 9 AG Scotland
J. Clin. Chem. Clin. Biochem. / VoL 19,1981 / No. 7