M. Oltscher, M. Ciorga, M. Utz, D. Schuh, D. Bougeard, and D. Weiss
Experimentelle und Angewandte Physik, University of Regensburg, D-93040 Regensburg, Germany.
In this Supplemental Material we provide some additional data from our measurements on both GaAs/AlGaAs and GaAs/InGaAs structures.
I. TRANSPORT PARAMETERS OF THE INVERTED 2DEG CHANNEL IN GaAs/AlGaAs STRUCTURE.
-0.03 -0.02 -0.01 0.00 0.01 0.02 0.03 100
105 110
I=+8 µA
Vnl
(V)
B x
(T)
T=3.8K
60 62 64
Vnl
(V)
140 160 180 200 220 240
I 5 µA Vnl
(V)
I 15 µA
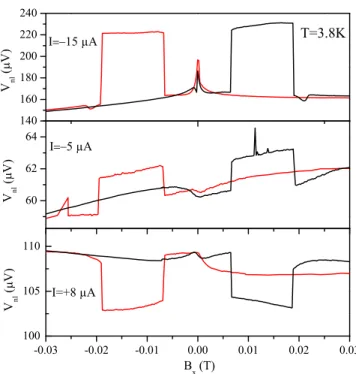
FIG. S1. Spin valve measurements for I21 = −15,−5 and +8 µA in the narrow-wide configuration with contact 2 as the injector. Magnetic field evolution of the nonlocal voltage at the nearest detector 3 is plotted.
In Fig. S1 we show spin valve traces measured at three different bias voltages, as discussed in the main paper, using contact 2 as the injector and contact 3 as the detector. Contrary to Fig. 2(a) in the paper we show here the raw data. Please note the clear presence of the DNP-related peak atBx = 0 in case ofI21=−15 µA and lack thereof in the other two curves, measured at different
bias conditions.
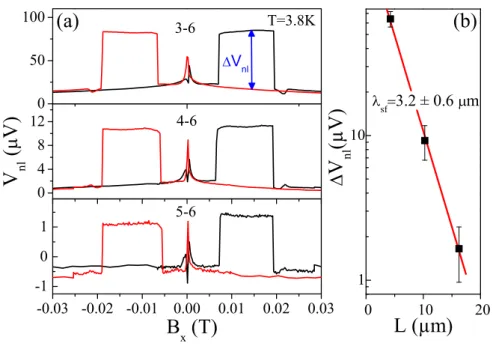
In Fig. S2 we show how the amplitude of the spin valve signal depends on separation between injector and the detector. We plotVnl measured at three detectors for I21=−15µA as a function of magnetic field, swept in thex−direction. From the observed exponential decay, consistent with Eq. 1, a spin diffusion lengthλsf = 3.2 ± 0.6 µm was extracted.
-0.03 -0.02 -0.01 0.00 0.01 0.02 0.03 -1
0 1
5-6
B x
(T)
T=3.8K
0 4 8
12 4-6
0 50 100
(b)
V nl
(V)
3-6
V nl (a)
0 10 20
1 10
L (µm)
V nl
(µV)
sf
3.2 ± 0.6 m
FIG. S2. (a) Nonlocal voltageVnl measured at three detectors forI21 =−15µA as a function of magnetic fieldBx. (b) Amplitude of the spin valve signal ∆Vnl vs. injector-detector separation.
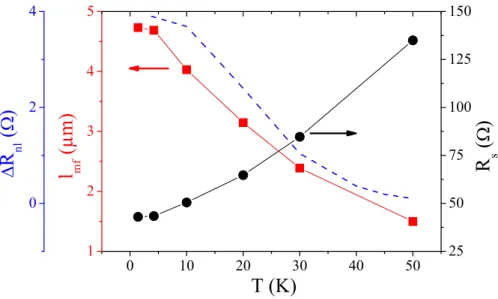
Fig. S3 shows the temperature dependence of the sheet resistanceRsheetand the channel’s mean free pathlmf extracted from magnetotransport measurements. The measurements were performed on a different cooldown than the curve shown in Fig. 1(c) in the main manuscript. This is why a slightly different value of the mean free path at 1.6 K was measured. For comparison we additionally plot the temperature evolution of ∆R36,21 for I21 = −15 µA (blue dashed curve), shown also in Fig. 2(d) in the main text.
0 10 20 30 40 50 1
2 3 4 5
0 2 4
l mf
(µm)
T (K)
25 50 75 100 125 150
R s
()
R nl
()
FIG. S3. Temperature dependence of mean free path of the channel lmf(red squares), sheet resistance Rs
(black circles) and ∆R36,21 forI21=−15µA (blue dashed curve).
II. HANLE EFFECT
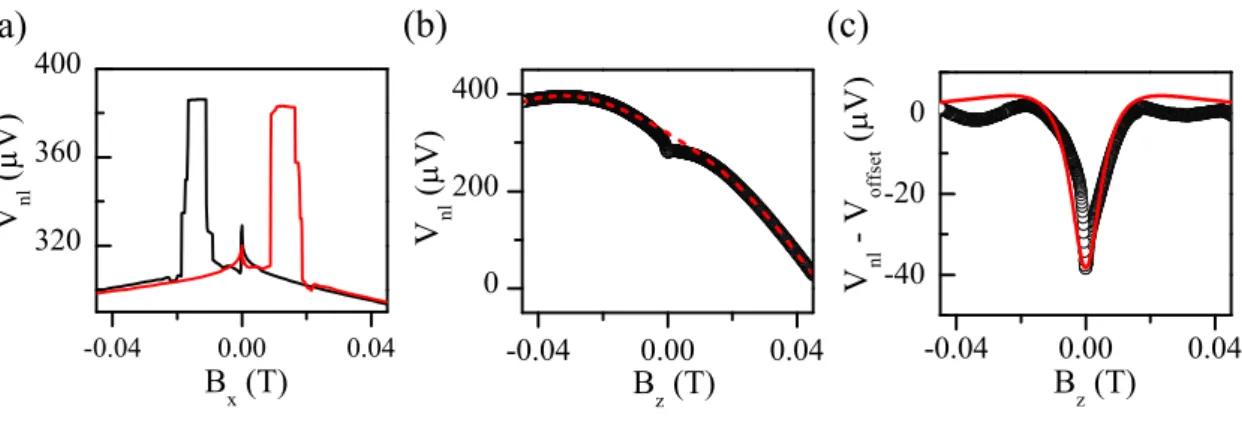
In the Fig. S4 we show the result of measurements performed in an out-of-plane magnetic field Bz for I21 = −20 µA together with the corresponding SV curve (measurements performed on a different cooldown than SV data presented in the main text). A Hanle-like oscillation of Vnl is clearly observed near Bz = 0 superimposed on the large field-dependent background. The width of the Hanle-like curve corresponds to τs ≈5 ns, i.e., orders of magnitude larger value than the one obtained from SV measurements. We link it to dynamic nuclear polarization effects in the sampleS1,S2, which are known to narrow the experimental Hanle curvesS3. The large non-local signal is connected to a large spin current in the 2DEG which could polarize the nuclei and cause an enhanced total field in z−direction. Please note that no Hanle-like signal was observed for bias conditions corresponding to the two bottom SV curves shown in Fig. S2, where also no DNP feature was observed. Similarly, no Hanle curve could be measured for the InGaAs sample, where also no DNP feature was observed in SV measurements, as can be seen in Fig. S5.
-0.04 0.00 0.04 -40
-20 0
-0.04 0.00 0.04
320 360 400
-0.04 0.00 0.04
0 200 400
B z
(T) V nl
(V)
B z
(T)
V nl
-V offset
(V)
(c) (b)
B x
(T)
V nl
(µV)
(a)
FIG. S4. (a) Spin valve curve measured at contact 3 forI21=−20µA. The measurements were performed during a different cooldown than the curve from Fig. 2(a) in the main manuscript. (b) Measurements in the out-of-plane fieldBz corresponding to the SV curve in (a). Clear Hanle-like feature aroundBz = 0 is observed on the large background, marked with the dashed curve. (c) Hanle-like curve after subtracting the background. The red curve represents simulated Hanle signal withτs= 5 ns.
III. SPIN VALVE SIGNAL FROM THE InGaAs SAMPLE.
-0.02 -0.01 0.00 0.01 0.02 -11.5
-11.0 -10.5
5-6
B x
(T)
T=4.2K
-18 -16 -14
4-6 -120
-100 -80 -60
V nl
(V)
3-6
V nl (a)
0 10 20
0.1 1 10 100
(b)
L (µm)
V nl
(µV) sf
2.4 ± 0.5 m
FIG. S5. (a) Nonlocal voltageVnlfrom the InGaAs sample measured at three detectors forI21=−300µA as a function of magnetic fieldBx. (b) Amplitude of the spin valve signal ∆Vnlvs. injector-detector separation.
In Fig. S5 we show spin valve curves obtained from the InGaAs quantum well. The geometry of the sample was identical to the the one used in case of the GaAs/AlGaAs sample, shown in Fig. 1(a) of the main text. The measurements shown in Fig. S5 were performed in the narrow- wide configuration with I21 = −300 µA. Please note, that no DNP peak is observed. Also the measurements in an out-of-plane magnetic field did not result in any Hanle-like signal.
[S1] G. Salis, A. Fuhrer, and S. F. Alvarado, Phys. Rev. B80, 115332 (2009).
[S2] M. K. Chan, Q. O. Hu, J. Zhang, T. Kondo, C. J. Palmstrøm, and P. A. Crowell, Phys. Rev. B80, 161206 (2009).
[S3] C. Awo-Affouda, O. M. J. van ’t Erve, G. Kioseoglou, A. T. Hanbicki, M. Holub, C. H. Li, and B. T.
Jonker, Appl. Phys. Lett.94, 102511 (2009).