Research Collection
Review Article
Singlet Oxygen Quantum Yields in Environmental Waters
Author(s):
Ossola, Rachele; Jönsson, Oskar M.; Moor, Kyle; McNeill, Kristopher Publication Date:
2021-04-14 Permanent Link:
https://doi.org/10.3929/ethz-b-000478666
Originally published in:
Chemical Reviews 121(7), http://doi.org/10.1021/acs.chemrev.0c00781
Rights / License:
Creative Commons Attribution 4.0 International
This page was generated automatically upon download from the ETH Zurich Research Collection. For more information please consult the Terms of use.
ETH Library
Singlet Oxygen Quantum Yields in Environmental Waters
Rachele Ossola, Oskar Martin J ö nsson, Kyle Moor, and Kristopher McNeill*
Cite This:Chem. Rev.2021, 121, 4100−4146 Read Online
ACCESS
Metrics & More Article Recommendations*
sı Supporting InformationABSTRACT: Singlet oxygen (1O2) is a reactive oxygen species produced in sunlit waters via energy transfer from the triplet states of natural sensitizers. There has been an increasing interest in measuring apparent 1O2quantum yields (ΦΔ) of aquatic and atmospheric organic matter samples, driven in part by the fact that this parameter can be used for environmental fate modeling of organic contaminants and to advance our understanding of dissolved organic matter photophysics.
However, the lack of reproducibility across research groups and publications remains a challenge that significantly limits the usability of literature data. In the first part of this review, we critically evaluate the experimental techniques that have been used to determine ΦΔ values of natural organic matter, we identify and quantify sources of errors that potentially explain the large variability in the literature, and we provide general experimental recommendations for future
studies. In the second part, we provide a qualitative overview of knownΦΔtrends as a function of organic matter type, isolation and extraction procedures, bulk water chemistry parameters, molecular and spectroscopic organic matter features, chemical treatments, wavelength, season, and location. This review is supplemented with a comprehensive database of ΦΔ values of environmental samples.
CONTENTS
1. Introduction 4101
2. Brief Overview of Surface Water 1O2 Photo-
physics 4103
3. Methods forΦΔDetermination in Environmental
Systems 4104
3.1. Derivation of the Basic Equations 4105 3.1.1. Chemical Probe Methods 4105 3.1.2.1O2Phosphorescence Methods 4106 3.2. Critical Discussion of the Parameters 4107 3.2.1. Measuring Light Absorption 4107 3.2.2. Measuring1O2Production 4112
3.3. Error Analysis 4116
3.4. Experimental Recommendations and Re-
search Gaps 4119
4. Singlet Oxygen Quantum Yields in Environ-
mentally Relevant Samples 4121
4.1. Structure of the Database 4122
4.2. DOM Types 4122
4.2.1. Freshwater DOM 4122
4.2.2. Wastewater DOM 4123
4.2.3. Soil Organic Matter 4124
4.2.4. Marine DOM 4124
4.2.5. Atmospheric Organic Matter 4124 4.2.6. Other Organic Matter Samples 4125 4.3. Isolation and Extraction Procedures 4125 4.3.1. Aquatic and Soil Samples 4125
4.3.2. Atmospheric Samples 4127
4.4. Short Summary and Research Gaps 4127
5. Trends and Interpretation of Results 4128
5.1. Water Chemistry 4128
5.2. Molecular, Optical, and Photophysical DOM
Features 4130
5.2.1. Macroscopic and Microscopic Molecu-
lar Features 4130
5.2.2. Optical Features 4131
5.2.3. Photophysical Features 4133
5.3. Chemical Treatments 4133
5.3.1. Reductive Treatments 4133
5.3.2. Oxidative Treatments 4133
5.4. Wavelength Dependence 4134
5.5. Seasonal and Spatial Variability 4135 5.5.1. Freshwater to Saltwater Systems 4135
5.5.2. Lake Superior 4136
5.6. Short Summary and Research Gaps 4136
6. Final Remarks 4137
Associated Content 4138
Supporting Information 4138
Author Information 4138
Corresponding Author 4138
Authors 4138
Received: July 24, 2020 Published: March 8, 2021
© 2021 The Authors. Published by
Downloaded via ETH ZURICH on April 14, 2021 at 11:29:43 (UTC). See https://pubs.acs.org/sharingguidelines for options on how to legitimately share published articles.
Notes 4138
Biographies 4138
Acknowledgments 4138
Abbreviations list 4138
References 4139
1. INTRODUCTION
Singlet oxygen (1O2) is a photochemically produced reactive intermediate (PPRI) and an important oxidant ubiquitous in sunlit aquatic environments. In natural and engineered systems, singlet oxygen is generated via energy transfer from triplet states of chromophoric dissolved organic matter (CDOM), the fraction of dissolved organic matter (DOM) able to absorb light that include aromatic ketones, coumarins, chromones, and quinones.1−5 In atmospheric aqueous phases such as fog, cloud, and rain droplets,1O2can be produced via an analogous sensitization process involving atmospheric organic matter.6−11 In these diverse environments, 1O2 contributes to the transformation of pollutants and bio- molecules,1,12−16to the deactivation of pathogens,17−21to the formation and the photochemical aging of organic aero- sols,7,9,22,23 and to the sunlight-induced oxidation of natural organic matter.24−26
In order to quantitatively assess the role of 1O2 in these processes, one has to quantify the ability of natural chromophores to sensitize its formation. A useful parameter in this respect is the apparent singlet oxygen quantum yield (ΦΔ), which represents the moles of1O2produced per moles of photons absorbed by a sensitizer (eq 1). In this context, the term “apparent” indicates that the actual sensitizer(s) responsible for 1O2 production is unknown, a consequence of the complex molecular nature of CDOM.27−29
mol O formed mol photons absorbed
2 1
Φ =Δ
(1)
The apparent 1O2 quantum yield is an intensive property of CDOM, as it accounts for variations in sensitizers’absorption spectra and concentration, as well as for variations in light intensity. This feature makes ΦΔ a useful parameter in environmental chemistry studies, as it can be used to predict variations in1O2 steady-state concentrations as a function of light intensity (thus, water depth, presence of other water constituents, DOM concentration, seasonal light intensity fluctuations, etc.).2Indeed, apparent quantum yields of PPRIs, including1O2, are needed as the input parameters in predictive models of steady-state concentrations and micropollutants’ lifetimes.2,30,31Furthermore, apparent quantum yields can also be used to study and compare the sensitizing properties of natural chromophores based on their origin (i.e., microbially vs terrestrially derived DOM)8,32−39and to understand the effect of environmental factors (e.g., photooxidation) on the photoreactivity of dissolved organic matter.40−43 Finally, the study of ΦΔ values offers the prospect of deepening our understanding of basic photophysical properties of DOM.
Despite the importance of apparent1O2quantum yields, the array of techniques and large variability of experimental conditions employed over the years strongly limits a confident use of literature values for the above purposes. In this work, we reviewed 59 papers published between 1977 and March 2020 (Table 1) reporting apparent1O2quantum yields of environ- mental samples, from natural and impacted aquatic environ-
ments to atmospheric aquatic phases. We collected a total number of 857ΦΔvalues ranging from≈0% to 33% (median
= 2.29%). Even though several of these papers discuss trends and significant variations within their data sets, their conclusions often do not hold valid when ΦΔ values are compared across studies. Indeed, several independent studies measured higher ΦΔ for Pony Lake fulvic acid (PLFA), a microbial DOM end-member, compared to Suwannee River fulvic acid (SRFA), a terrestrial DOM end-member (Table 1).
On average,ΦΔPLFA/ΦΔSRFA= 1.63±0.63 when considering all studies (N= 13, median of 1.58;ΦΔPLFA/ΦΔSRFA= 1.86±0.53 when excluding the three values <1). However, if we pool all of the available data together, there appears to be no statistical difference between the ΦΔ values found for the two isolates.
For instance, for data collected with the same light source (solar), the averages (±standard deviation) areΦΔ= (2.0± 0.7)% (N= 12) and (3.0± 1.5)% (N = 12) for SRFA and PLFA, respectively (Figure 1). Very comparable results are obtained from the average of all data, independent of the light source, i.e.,ΦΔ= (2.0±0.9)% (N= 34) and (2.5±1.5)% (N
= 18) for SRFA and PLFA, respectively. Similarly, several authors observed a strong positive correlation between E2:E3 (the ratio between the absorbance at 250 or 254 nm to that at 365 nm)44,45andΦΔ, but the slopes of the regression line vary considerably from one study to another, even if referred to the same light source (i.e., from 0.08 to 2.2 for xenon light; see section 5.2.2). From our point of view, these observations highlight the need of standardizing and better constraining the way we perform 1O2 quantum yield measurements in environmental samples, in terms of general methodology, data treatment, data reporting, and quality control.
Thefirst objective of this review is to critically evaluate the experimental methods that have been used to determineΦΔin environmental samples, with the specific aim of identifying potential sources of errors that might explain the large variations in literature values. Based on this analysis, we suggest guidelines and best practices to be considered for future studies. A second objective is to provide a comprehensive database of curated ΦΔ values of environ- Figure 1.Comparison between apparent1O2quantum yields of SRFA and PLFA across studies shown as boxplot and average (empty circles). Data in blue are solar-integrated quantum yields, while data in gray are all available values. In this analysis, we included only data for untreated DOM samples (database field “Treatment” = “none (isolate*)”). We did not consider potential variability in source material of different IHSS stocks (seesection 3.2.2.5).
Table 1. Overview of Apparent1O2Quantum Yield Studies Found in the Environmental Photochemistry Literature from 1977 to March 2020a
study light source ΦΔSRFA(%) ΦΔPLFA(%) ref
chemical probe, absolute, radiometry UVC
Lester et al., 2013 mercury (255 nm) 3.20±0.05 46
UVB and UVA
Haag et al., 1984 xenon (365, 405, 545 nm) 47
Frimmel et al., 1987 xenon (365 nm) 1.00±0.30 (pH 7) 33
1.80±0.54 (pH 3.5)
Dalrymple et al., 2010b mercury (365 nm) 48
Nkhili et al., 2014c UVA bulbs (365 nm) 49
Sharpless et al., 2014b mercury (365 nm) 1.8 42
Hong et al., 2018 mercury (290−450 nm) 1.71±0.02 50
Li et al., 2019 UVA bulbs (380 nm) 51
Zhao et al., 2020 mercury (290−450 nm) 1.61±0.12 52
Zhou et al., 2020 mercury (290−450 nm) 1.23±0.05 2.90±0.11 53
solar
Glover and Rosario-Ortiz, 2013 xenon (solar) 0.37 1.14 54
Mostafa and Rosario-Ortiz, 2013 xenon (solar) 2.11±0.31d 2.04±0.27d 55
Cawley et al., 2014 xenon (solar) 56
Mostafa et al., 2014 xenon (solar) 57
Zhang et al., 2014 xenon (solar) 1.85±0.15d 1.34±0.09d 58
Fu et al., 2016 xenon (solar) 59
McKay et al., 2016 xenon (solar) 1.8±0.1 60
McKay et al., 2017 xenon (solar) 35
Silva et al., 2017 xenon (solar), mercury (255 nm) 61
Tenorio et al., 2017 xenon (solar), cutoff at 310 nm 62
Zhou et al., 2017 xenon (solar) 3.12±0.22 4.55±0.26 63
Zhou et al., 2018 xenon (solar) 2.83±0.07 4.96±0.11 31
Chen et al., 2019 xenon (solar) 64
Wang et al., 2019 xenon (solar) 2.2±0.1 65
Wenk et al., 2019 xenon (solar), cutoff at 320 nm 1.61±0.12d 1.55±0.12d 66
chemical probe, absolute, actinometry UVB and UVA
Zepp et al., 1977 mercury (365 nm) 3
Baxter and Carey, 1982 mercury (365 nm) 67
Zepp et al., 1985 mercury (315, 365, 405 nm) 68
Faust and Allen, 1992 xenon (335 nm) 6
Aguer et al., 1997 mercury (365 nm) 69
Halladja et al., 2007 xenon (320, 340, 375, 400, 425, 450, 500 nm) 70
Sharpless, 2012 xenon (310, 370, 415 nm) 1.8±0.1 (370
nm)
71
Janssen et al., 2014c UVB bulbs (315 nm) 5.4 72
Bodhipaksha et al., 2015 mercury (365 nm) 40
Marchisio et al., 2015 UVB bulbs (315 nm), UVA bulbs (365 nm), blue bulbs (420 nm) 73
Bodhipaksha et al., 2017 Mercury (290−450 nm) 41
Maizel and Remucal, 2017 (ES&T) UVA bulbs (365 nm) 1.5±0.1 1.9±0.2 74
Maizel and Remucal, 2017 (ESPI) UVA bulbs (365 nm) 75
Maizel et al., 2017 UVA bulbs (365 nm) 76
Berg et al., 2019 UVA bulbs (365 nm) 77
solar
De Laurentiis et al., 2013 xenon (solar), cutoff at 310 nm 38
McCabe and Arnold, 2016 xenon (solar) 34
Kaur and Anastasio, 2017 xenon (solar), cutoff at 295 nm 8
Du et al., 2018 xenon (solar) 2.14 3.4 32
Kaur et al., 2019 xenon (solar), cutoff at 295 nm 7
Leresche et al., 2019 xenon (solar) 1.33±0.07 (pH 7) 2.53±0.14 (pH 7) 43
2.08±0.11 (pH 3) 3.27±0.18 (pH 3)
O’Connor et al., 2019 xenon (solar), cutoff at 290 nm 78
Wan et al., 2019 xenon (solar), cutoff at 300 nm 79
mentally relevant samples. Even within the limitations of the current methods, we believe that this data set still represents a valuable resource for modelers and other scientists interested in understanding and characterizing the natural variability of DOM photoreactivity. Finally, we provide an overview of results accumulated over more than 40 years of ΦΔ research, includingΦΔtrends as a function of relevant water chemistry parameters, spectroscopic and molecular DOM features, light sources, and irradiation wavelengths. In this final section, we also revise available data on spatial and temporal variability in apparent1O2quantum yields.
2. BRIEF OVERVIEW OF SURFACE WATER1O2 PHOTOPHYSICS
Here we provide a brief summary of basic photophysical processes pertaining to 1O2in natural systems (Figure 2). A more detailed discussion of its photophysical properties and of sensitized 1O2 production in biological, environmental, and photocatalytic systems can be found elsewhere.1,4,87−93In this review, we use the term CDOM to indicate any complex mixture of organic molecules present in the aquatic environ- ment (i.e., surface waters but also the atmospheric aqueous phases) that are able to absorb sunlight. Note that the same scheme is also valid for discrete-molecule sensitizers (Sens) such as the ones used as ΦΔ reference compounds (e.g., perinaphthenone).
Upon absorption of light (hν), CDOM is promoted to its singlet excited state, 1CDOM*. 1CDOM* is a short-lived intermediate (estimated lifetime of 150 ps to 6 ns),94 which either relaxes back to its ground state via internal conversion (IC; nonradiative deactivation) or fluorescence emission (F;
radiative deactivation), or undergoes intersystem crossing (ISC) that converts it to a triplet excited state (3CDOM*).
The (apparent) intersystem crossing quantum yield or
3CDOM* quantum yield (ΦT) describes the conversion efficiency of 1CDOM* into 3CDOM*. Compared to the singlet excited state, 3CDOM*has a longer lifetime (10−30
μs)95 and can participate in bimolecular chemical reactions before decaying back to the ground state. Depending on the substrate, 3CDOM*can act as an oxidant (electron transfer reactions) or undergo energy transfer reactions;5alternatively,
3CDOM* can relax back to the ground state via radiative (phosphorescence emission; P) or nonradiative processes (i.e., intersystem crossing) with afirst-order rate constantkdT, which is equivalent to the inverse of the natural triplet lifetime (the term “natural” indicates the lifetime in the absence of quenchers). Due to its relatively high concentrations in sunlit aquatic systems compared to other natural 3CDOM* quenchers (∼260μmol L−1at 25°C)96and its high reactivity with excited triplet states, oxygen is the most prominent
3CDOM* quencher, and is thus the species that largely controls its lifetime in the natural environment.5Upon energy transfer, O2 is converted to singlet oxygen (1O2), while
3CDOM* decays back to its (singlet) ground state. In principle, energy transfer from triplet sensitizers can produce
1O2in two excited states, i.e., O2(1Δg) and O2(1Σg+), which are 94 and 157 kJ mol−1, respectively, above O2(not indicated in Figure 2; see Paterson et al.97 for more information on the symbols 1Δg and 1Σg+).89,98 However, due to the extremely efficient deactivation of O2(1Σg+) to O2(1Δg), the relevance of the 1Σg+ state is negligible in most systems.89 Thus, in this review,1O2indicates only thefirst singlet oxygen excited state, i.e., O2(1Δg). Furthermore,1O2can also be produced from the sensitizer’s singlet excited state (i.e., 1CDOM*)89,98,99 and from direct excitation of O2at 765 nm100,101(not indicated in Figure 2). To the authors’knowledge,1O2production via these two additional mechanisms remains untested in the context of aquatic photochemistry. The first-order rate constant of the triplet-sensitized production of 1O2 can be obtained as kO2 [O2]fΔ, wherekO2 is the second-order rate constants for the physical quenching of 3CDOM* with O2, [O2] is the dissolved oxygen concentration, and fΔ is the fraction of physical quenching that leads to1O2production. Note that a fraction 1 − fΔ of all oxygen quenching events deactivates Table 1. continued
study light source ΦΔSRFA(%) ΦΔPLFA(%) ref
Zhou et al., 2019 xenon (solar), cutoff at 290 nm 2.66±0.12 5.29±0.12 80
chemical probe, relative
Cory et al., 2009 UVA bulbs (365 nm) 0.47 0.69 81
Peterson et al., 2012 UVA bulbs (365 nm) 36
Chu et al., 2015 UVA bulbs (365 nm) 82
Manfrin et al., 2019 UVA bulbs (365 nm), UVB bulbs (310 nm) 1.9±0.6 (UVA) 9
3.4±1.1 (UVB)
1O2phosphorescence, time-resolved
Paul et al, 2004 Nd:YAG laser (350, 450, 480, 500, 550 nm) 0.57 (480 nm) 83
Carlos et al., 2012 Ti:sapphire laser (400 nm) 84
Pozdnyakov et al., 2017 Nd:YAG laser (532 nm) 85
Partanen et al., 2020 Ti:sapphire laser (300, 320, 330, 340, 365, 380, 400, 430, 470, 500, 540, 560 nm)
1.4 (365 nm) 2.4 (365 nm) 39
1O2phosphorescence, steady-state
Sandvik et al., 2000 mercury (280−380 nm) 37
Bilski et al., 2003 mercury (365 nm) 86
aStudies are divided intofive groups according to the classification provided inFigure 3and are ordered chronologically within each group. For absolute chemical probe studies, we further subdivided the papers based on the light source. When available, we reportΦΔvalues for SRFA and PLFA to provide a better sense of the variability observed also under comparable experimental conditions.bSome measurements were performed via a reference chemical probe method (Table S8).cUnclear if authors used radiometry or chemical actinometry.dExceptions of the general trend ΦΔSRFA<ΦΔPLFA.
3CDOM*without resulting in the formation of singlet oxygen (not indicated in Figure 2B). Similar to 3CDOM*, singlet oxygen is a transient species with a natural lifetime on the order of microseconds in distilled water (∼3.5 μs).101−103In the presence of a chemical quencher (QC),1O2can chemically react to form endoperoxides and ring-opened products with a second-order rate constantkrxn,1O2QC .1,104Alternatively, 1O2can undergo energy-transfer quenching (i.e., physical quenchers, QP, such as with tertiary aliphatic amines)105and be converted back to its ground state. In the absence of quenchers,1O2can decay back to the ground state via radiative (phosphorescence emission at 1270 nm) and nonradiative pathways (intersystem crossing) with afirst-order rate constantkdΔ, which represents the inverse of the natural 1O2 lifetime. Notably, kdΔ changes considerably from D2O (1/kdΔ=τΔ≈67μs) to H2O (τΔ≈3.5 μs) due to vibrational energy differences between H−O and D−O bonds.89,102,106,107
This fact has been exploited in several
contexts either as a diagnostic test for 1O2 involvement in chemical reactions29,90,102 or as a way to overcome the low time-resolution and sensitivity of the first singlet oxygen phosphorescence detectors (vide infra).
From a quantitative point of view, the singlet oxygen quantum yield of a sensitizer can be expressed as a function of photophysical and chemical properties of the system according toeq 2.71,89,98
i
kjjjjj y
{zzzzz k
k kO f
T O
O2 2 dT
O2 2
Φ = Φ [ ]
+ [ ]
Δ Δ
(2) This equation shows thatΦΔ, which is the fraction of excited CDOM that produces1O2, is itself a product of three fractions:
the fraction of1CDOM* that becomes 3CDOM*(ΦT), the fraction of triplets that are quenched by oxygen (kO2 [O2]/
(kdT+kO2 [O2])), and the fraction of these quenching events that lead to formation of 1O2 (fΔ). In theory, eq 2 should contain an additional term that accounts for the production of
1O2from the quenching of1CDOM*.87,89,99Considering the sizable difference in triplet and singlet excited state lifetimes (i.e., 150 ps to 6 ns94 vs 10 to 30 μs95 for 1CDOM* and
3CDOM*, respectively) and the relatively low O2 concen- trations in surface waters compared to organic solvents, this contribution is expected to be minor. We also point out that ΦΔ < ΦT, as kdT > 0, and that apparent1O2 quantum yields depend on dissolved oxygen concentrations (see alsosection 5.1).
Based on the kinetic scheme inFigure 2A, it is possible to recognize the relevant photophysical processes that need to be monitored to measure apparent1O2quantum yields. Thefirst important parameter is the number of photons absorbed by the chromophore (the denominator ofeq 1, blue shaded arrow in Figure 2A). InΦΔdeterminations, this parameter is generally quantified as the rate of light absorption (Rabs, in (mol absorbed photons) L−1s−1), which represents the number of absorbed photons per unit of time and volume. Rabs is proportional to the overlap between the absorption spectrum of the sensitizer and the emission spectrum of the light source (more details insection 3.2.1.1). A second important quantity is the moles of1O2produced (the numerator ofeq 1), which can be estimated in several ways (orange shaded arrows in Figure 2A). A common technique involves the use of a probe compound (a chemical quencher) that can trap1O2. From the probe depletion kinetics, it is possible to calculate the amount of photogenerated 1O2. Alternatively, one can observe 1O2 directly by monitoring its phosphorescence emission 1270 nm.
These two approaches are the basis of the techniques that have been used to measureΦΔ in environmental samples and are described more in detail in the following section.
3. METHODS FORΦΔDETERMINATION IN ENVIRONMENTAL SYSTEMS
There are two well-defined experimental strategies that have been used to measure ΦΔ in environmental samples. As introduced in the discussion above, thefirst approach consists of quantifying1O2 via reaction with a chemical probe, while the second method is based on direct observation of1O2via its weak phosphorescence signal at 1270 nm (Figure 3). Within each category, we identified further distinctions based on minor variations in the experimental approach. Chemical probe methods are classified as absolute or relative based on the strategy employed to quantify the rate of light absorption Figure 2. Schematic overview of the photophysical properties of
CDOM and1O2. PanelAshows a qualitative overview of all possible photophysical processes, while quantitative parameters relevant for understanding1O2photophysics are indicated in panelB. In panelA, gray arrows indicate processes that occur but are not directly relevant for 1O2 measurements; colored arrows indicate processes that are directly monitored inΦΔmeasurements; straight arrows are radiative decays or chemical reactions, while wavy arrows are nonradiative processes. Legend for panel A: F, fluorescence; IC, internal conversion; ISC, intersystem crossing; P, phosphorescence; QC, chemical quencher; QP, physical quencher. Legend for panelB:Rabs, rate of light absorption;ΦT, apparent3CDOM*quantum yield;kdT, (natural)3CDOM*decay rate constant;kdΔ, (natural)1O2decay rate constant;kO2, second-order rate constants for the physical quenching of3CDOM*with O2;fΔ,fraction of physical quenching that leads to
1O2production;krxn,1O2QC , second-order rate constant for the reaction of QCwith1O2.
(Rabs). Absolute probe-based methods require the explicit calculation ofRabs; in contrast, relative methods avoid this step by using a reference1O2 sensitizer whose ΦΔ is well-known.
Absolute probe-based methods can be further divided into two groups based on how the absolute spectral irradiance is determined, either by chemical actinometry or radiometry. On the other hand, phosphorescence-based methods can be classified as steady-state or time-resolved based on the experimental setup used to produce and detect the 1O2 phosphorescence signal. To date, there have been no time- resolved probe-based methods, as all of the reported experiments have determined apparent 1O2 quantum yields via steady-state irradiation. Likewise, there have been no absolute phosphorescence-based measurements, as all those reported so far have been relative to a reference sensitizer.
Since the first report in 1977,3 probe-based methods have been the technique of choice for measurements of apparent
1O2 quantum yields of environmental samples due to the straightforward experimental setup and protocol (53 of 59 studies; 90%), with actinometry (24 of 59; 41%) and radiometry (25 of 59; 42%) being equally popular variants.
Despite being more robust (see discussion in section 3.3), relative chemical probe methods have only rarely been used (4 studies over 59; 7%). A clear disadvantage of all probe-based methods is that they detect 1O2 indirectly and are thus susceptible to interference from other photochemically produced reactive intermediates (seesection 3.2.2.4). Similarly to the relative chemical probe method,1O2 phosphorescence has not yet gained wide popularity among the environmental chemistry community (6 of 59; 10%), probably because of the more specialized and expensive equipment demands, both in terms of light sources (e.g., Nd:YAG pulsed lasers for the time- resolved methods) and high-sensitivity detectors (e.g., 77 K- cooled Ge diode), and the requisite use of highly concentrated DOM solutions. Note also that, until the most recent generation of thermoelectrically cooled NIR photomultiplier tubes, these experiments had to be conducted in D2O to overcome the low sensitivity and poor time resolution of Ge photodiode detectors,89,108,109 which might have further lowered the general appeal of this approach (more details in section 3.1.2). This disadvantage is a direct consequence of the low1O2phosphorescence emission quantum yield in H2O (i.e.,
<10−6).89On the other hand,1O2phosphorescence is a more selective technique than probe-based methods because it detects the near-infrared emission that is unique to this reactive species, thus it is not prone to interferences from other PPRIs.90
In the following sections, we derive the general ΦΔ
equations needed for each of the methods inFigure 3(section 3.1), we critically discuss all of the important parameters that are part of the equations (section 3.2), we qualitatively summarize and estimate the magnitude of most common errors in1O2quantum yield determinations (section 3.3), and we provide general guidelines for future studies (section 3.4).
Due to the ease of application and widespread use in the literature, our discussion will be more oriented toward probe- based methods.
3.1. Derivation of the Basic Equations
3.1.1. Chemical Probe Methods. Chemical probe methods involve the use of a probe compound (P) that reacts selectively with1O2(eq 3). Furfuryl alcohol (FFA) is the most widely used 1O2 probe in environmental studies,1,103 even if alternative compounds have been developed and used in the past1,110,111and in otherfields.29,112−117
P 1O2 krxn,1O2 products
P
+ ⎯⎯⎯⎯⎯⎯→ (3)
The rate of disappearance of P can be written according toeq 4.
t k
R k
k k k
d P
d O P
P
( ) P
rxn,1O2P 1 2 ss
abs
rxn,1O2 P
d phys,1O2
P
rxn,1O2 P
− [ ]
= [ ] [ ]
= Φ [ ]
+ + [ ]
Δ Δ
(4) where Rabs ((mol absorbed photons) L−1 s−1) is the rate of light absorption of the sensitizer, either CDOM or a single- molecule sensitizer, ΦΔ is the apparent 1O2 quantum yield, krxn,1O2P (L mol−1s−1) is the bimolecular rate constant for the reaction of the probe molecule with1O2,kphys,1O2P (L mol−1s−1) is the bimolecular rate constant for physical quenching of the P with1O2, andkdΔ(s−1) is the singlet oxygen deactivation rate constant to ground state O2.48,118In this equation, degradation via direct photolysis and reaction with other PPRIs is assumed to be negligible. In addition, this equation assumes that the only deactivation processes for 1O2 are solvent-dependent deactivation and quenching by the probe compound, which is usually the case.
If (kphys,1O2P +krxn,1O2P )[P]≪kdΔ, probe molecule loss follows pseudo-first order kinetics (eq 5), wherekobs,P(s−1) is defined according toeq 6.
t
R k
k k
d P
d abs rxn,1O2 P P
P
d
obs,P
− [ ]
= Φ
[ ] = [ ]
Δ
Δ (5)
k k R k
O k
obs,P rxn,1O2
P 1
2 ss
abs rxn,1O2P d
= [ ] = ΦΔ
Δ (6)
Equation 6can be rearranged to provide an expression for the singlet oxygen quantum yield (eq 7).
k k
k R
obs,P rxn,1O2P
d abs
Φ =Δ
Δ
(7) Equation 7represents the starting point of three probe-based methods and is also the basic equation for absolute quantum yields determinations. Note that this equation is valid under the assumption that (kphys,1O2P +krxn,1O2P )[P]≪kdΔ, thus that [P]
is low enough to not influence the 1O2 steady-state concentration. So far, most apparent 1O2 quantum yields Figure 3.Schematic of the main methods to quantify1O2 quantum
yields in environmental samples classified as chemical probe and singlet oxygen phosphorescence methods. In parentheses we report the number of literature studies per each subgroup (see alsoTable 1).
Note that different chemical probe methods are classified based on the strategy used to measure the absolute spectral irradiance, which is needed to calculate the rate of light absorption.
determinations in environmental samples have been based on this approximation, even if this not the only possible approach for data analysis. For example, in early ΦΔ measurements, P was deliberately added at high concentrations to trap all the photogenerated1O2.33,47Alternatively, a few authors adopted the initial rate approach based on zeroth-order ki- netics.38,49,52,69,70,73
Details on data analysis approaches can be found in section 3.2.2.2. Note that this review focuses on ΦΔ measurements in environmental samples; readers inter- ested in steady-state 1O2 quantum yield determinations in other systems should refer to other reviews on the subject.29,98 Even within the steady-state approach, several variants can be found in the literature. Indeed, authors have expressedeq 7 i n t e r m s o f 1O2 f o r m a t i o n r a t e s (R1 O 2; e q 8),7,8,32,34,35,40,41,43,46,48,51,55,57,59,62−64,80 steady-state concen- trations ([1O2]ss, eq 9),42,54,56,61,66,72,78
quantum yield coefficients (fP;eq 10),75or beta factors (β, eq 11).3,68
R
R R k k
; k
1O2 abs
1O2
d obs,P rxn,1O2
Φ =Δ = P Δ
(8)
k R
k
O ; O k
1 2 ss
d abs
1 2 ss
obs,P rxn,1O2
Φ = [Δ ] [ ] = P Δ
(9)
f k
k f k
; R
P d rxn,1O2
P P
obs,P abs
Φ =Δ =
Δ
(10)
k R
k
; k
obs,P abs
d rxn,1O2
β β P
Φ =Δ =
Δ
(11) Absolute methods based on the use of a chemical probe can be classified into two groups, depending on how one determines the absolute spectral irradiance at the liquid surface (I0,λ), which is needed to calculateRabs(various approaches described insection 3.2.1.1). Afirst possibility is to measure directlyI0,λ by spectroradiometry. Alternatively, the absolute irradiance can be obtained via chemical actinometry.
On the other hand, relative probe-based methods rely on the use of a reference sensitizer, generally a single-molecule sensitizer, to indirectly quantifyI0,λ(thus, ΦΔ). Specifically, if DOM and a reference sensitizer are irradiated under the same light conditions, the variation in the pseudo-first-order degradation rate constants of the probe with the two sensitizers (kobs,PDOM and kobs,PSens,ref) depends only on the differences in 1O2 quantum yields and the rates of light absorption.
k R k
obs,P k
DOM abs
DOM DOM
rxn,1O2 P
d
= ΦΔ
Δ (12)
k R k
obs,PSens,ref absSens,ref Sens,refk
rxn,1O2P d
= ΦΔ
Δ (13)
By combiningeqs 12and13and solving forΦΔDOM, one arrives at the following expression, whereRabs can be calculated with either the absolute or the normalized lamp irradiance.
k k
R R
DOM obs,P
DOM
obs,P Sens,ref
absSens,ref absDOM
Sens,ref
ΦΔ = ΦΔ
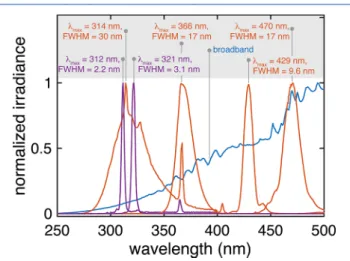
(14) Note that, when using monochromatic light (i.e., with full width at half-maximum, FWHM <5 nm; seesection 3.2.1.5), RabsSens,ref/RabsDOM≈ελSens,ref[Sens]/αλDOM, whereελSens,ref(in L mol−1
cm−1) is the decadic molar extinction coefficient of the reference sensitizer, and αλDOM (in cm−1) is the decadic absorption coefficient of the DOM solution. However, apparent quantum yield measurements are typically performed with narrow (FWHM between 5 and 50 nm) and broad (FWHM >50 nm) bandwidth light sources (section 3.2.1.5);
thus, the use of an integral form forRabs remains necessary.
Furthermore, if the DOM solution contains a considerable amount of suspended particles,eq 14, andRabsDOMin particular, should be readapted to account for the effect of scattering and/
or absorption from these particles (see sections 3.2.1.1 and 3.2.1.4).
3.1.2. 1O2 Phosphorescence Methods. In 1O2 phos- phorescence experiments, singlet oxygen is directly observed via its phosphorescence emission in the near-infrared (NIR;
peak at around 1270 nm).87,89,109,119,120
This emission can be monitored either in a steady-state or in a time-resolved manner. In thefirst case, the photogenerated signal S(λ) can be described as a function of wavelength according toeq 15.119 S( )λ =κkrΔτΔ ΔΦ Rabs (15) where κ is an instrument response factor that accounts for optical efficiencies, detector response, alignment, etc., krΔ (in s−1) is the radiative relaxation rate constant of1O2, andτΔ is the natural1O2lifetime in the experimental media (i.e.,τΔ= 1/
kdΔ). In time-resolved measurements, S will change as a function of time as indicated byeq 16.119,121
S t( ) S0 (e t e t )
T
/ /T
τ
τ τ
= −Δ τ − τ
Δ
− Δ −
(16) whereτTis the lifetime of the triplet state of the sensitizer. The parameter S0 relates to the overall 1O2 signal intensity and, similar toeq 15, is proportional to ΦΔ,κ, andkrΔ.119
In both cases, comparing the1O2signal (S, either its area or its amplitude) produced from DOM to a reference sensitizer irradiated under the same conditions yields eq 17, which is analogous to the equation used in relative chemical probe determinations (eq 14). Note that, as foreq 14, the presence of particulate matter requires an appropriate treatment ofRabsDOM to correct for light scattering and/or absorption.
S S
R R
DOM DOM
Sens,ref abs
Sens,ref abs DOM
Sens,ref
ΦΔ = ΦΔ
(17) There are nevertheless a few differences that are worth highlighting. First, steady-state1O2phosphorescence measure- ments have typically been performed in D2O in the presence of high DOM concentrations (>100 mgC L−1) in order to overcome the problems of low1O2phosphorescence intensity and poor sensitivity and temporal resolution of the Ge detectors used in early studies. Due to the∼20 times longer lifetime in D2O compared to H2O,87,89,101 the use of deuterated water increases the intensity of the1O2phosphor- escence signal by slowing the nonradiative decay rate to ground state oxygen.90On the other hand, this strategy comes with a side effect, as in deuterated water, physical and chemical quenching of1O2by DOM also becomes relevant (because of the lower kdΔ value in D2O compared to H2O; see the Supporting Information,section S1andFigure S1) and needs to be accounted for in quantum yield calculations. This correction can be done by determiningτΔin the two solutions via time-resolved phosphorescence and by introducing a multiplying term τΔSens,ref/τΔDOM in the apparent 1O2 quantum
yield formula.37,86,119 This same correction has to be accounted for in time-resolved1O2phosphorescence measure- ments in D2O that use the area of the1O2signal.119Notably, due to advances in 1O2phosphorescence detection technolo- gies over the past 30 years, time-resolved measurements can now be performed reliably in H2O. Additionally,eq 17has to be multiplied by an additional factor tcollectionSens,ref /tcollectionDOM that accounts for the difference in collection times (tcollection) between the reference sensitizer and DOM.39 Furthermore, one could use optically matched solutions with constant laser energies to further simplifyeq 17, as under these conditions RabsSens,ref/RabsDOM.83−85 Lastly, one author used the slope of a phosphorescence intensity vs power plot as the1O2signal (Sin eq 17).84,98
3.2. Critical Discussion of the Parameters
In this section, we critically analyze and discuss the parameters needed for apparent1O2 quantum yield calculations with the aim of identifying possible sources of errors, and we provide guidelines on best practices to be considered for future studies.
For the sake of simplicity, we divide the discussion into two major topics, which represent the two key components ofΦΔ
determinations (eq 1): (1) Measuring light absorption (section 3.2.1) and (2) measuring singlet oxygen production (section 3.2.2). In thefirst section, we define equations forRabsand we highlight problems related to the selection of the integration range (section 3.2.1.1). We then describe the challenges of obtaining absolute irradiance measurements via radiometry (section 3.2.1.2) and the working principles of chemical actinometry (section 3.2.1.3), giving an overview of the pros and cons of the methods that have been used in environmental photochemistry studies. Finally, we discuss the collection and treatment of absorption spectra (section 3.2.1.4) and the problems related to the selection of the light source (section 3.2.1.5). In the part focusing on measuring1O2production, we discuss important aspects pertinent to1O2probe compounds, including selection of the probe (section 3.2.2.1), data analysis protocols (section 3.2.2.2), bimolecular rate constants with
1O2 (krxn,1O2P ; section 3.2.2.3), and accurate measurements of unimolecular rate constants (kobs,P; section 3.2.2.4). We next discuss the problem of selecting good reference sensitizers (section 3.2.2.5) and we present updated literature values for the1O2deactivation rate constant (kdΔ;section 3.2.2.6).
3.2.1. Measuring Light Absorption. 3.2.1.1. Rate of Light Absorption: Expressions, Approximations, and Inte- gration Range.The rate of light absorption (Rabs) represents the moles of photons absorbed by the chromophore of interest per unit of time and volume [units of (mol absorbed photons) L−1 s−1; in the environmental photochemistry literature, the unit Einstein (E) is often used instead of (mol absorbed photons), even if IUPAC discourages its use122,123]. Several authors have calculated Rabs according to eq 18 (Table S1), which directly derives from the physics of light absorp- tion.88,124
S
R 1 I S
(1 10 )
abs=
∑
0, − Δλλ λ
−αλ
(18) where I0,λ(in (mol photons) s−1nm−1cm−2) is the absolute spectral irradiance at the liquid surface, αλ (in cm−1) is the decadic absorption coefficient of the chromophore solution, andS(in cm) is the optical path length.Equation 18should be used only in the presence of a single chromophore or class of chromophores (i.e., CDOM), a typical situation when
irradiating, for example, DOM isolates or whole natural waters with negligible levels of nitrate, or solutions of single-molecule sensitizers. If the solution contains more than one class of chromophores (i.e., CDOM and nitrate) and one wants to obtain Rabs for only one component i, eq 19should be used instead.
R 1l I
(1 10 )
i
i
l
abs 0, tot
∑
α totα λ
= − Δ
λ λ
λ λ
−αλ
(19)
whereαλi is the decadic absorption coefficient of componenti, andαλtot= ∑iαλi is the total decadic absorption coefficient of the solution. Several authors have applied this equation to assessRabsfor DOM in whole waters with relatively high levels of nitrate,55,66in the presence of halides,54or in the presence of other whole water matrix components.31,58,63Note that for αλtot = αλi, eq 19 simplifies to eq 18. Furthermore, both equations take into account the self-screening caused by chromophore itself and are therefore valid at any chromophore concentration. This is not the case for simplified versions that have been used in some studies (see the Supporting Information, section S2 and Table S1). A version of eq 19 should also be employed to calculate DOM’s rate of light absorption in the presence of light scattering particles.
Even if there appears to be an overall literature agreement on theRabs equations, there is less consensus on the wavelength range to be used in these calculations. This detail becomes particularly important when using polychromatic light sources, such as xenon lamps and natural sunlight. The most common approach is to integrate between 290 and 400 nm (Table S2) following the rationale that solar radiation below 290 nm does not reach the Earth surface, and that 1O2 production is
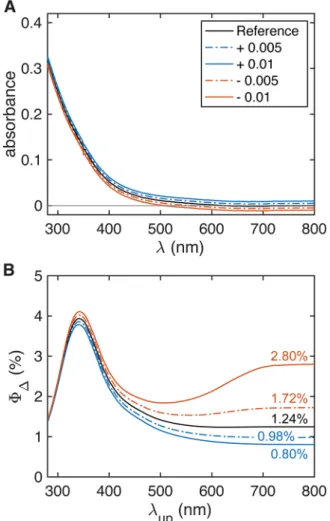
“negligible” above 400 nm.54,56 Despite their apparent reasonability, these assumptions are the origin of a systematic error in final ΦΔ values. Evidence of this error was clearly shown in 2016 by McKay and co-workers,60 who performed their polychromatic apparent quantum yield calculations using three integration ranges and obtained different results in each case. For example, for SRFA, they reported ΦΔ = (19.0 ± 0.5)% forΔλ= 290−350 nm, (2.13±0.06)% forΔλ= 290− 400 nm, and (1.13± 0.06)% for Δλ = 290−450 nm. More recently, O’Connor et al.78obtainedΦΔin the range of 0.7%
to 3.5% using an integration range of 275−600 nm (solar lamp), and found that reducing the integration interval to 275−400 nm would cause a dramatic increase in apparent1O2 quantum yields (2.2−15.9%). Interestingly, until 2018, the majority of the studies (14 of 16, 88%; Table S2) were still adopting the often-used limit of 400 nm as upper integration wavelength (λup). In the past two years, the tendency has inverted, with more authors extending λup up to 700 nm (Table S2). Note that this problem does not arise when using narrow bandwidth and single wavelength sources as far as the integration range is selected to cover the entire bandwidth.
Following on these results and motivated by the apparent confusion in the choice of λup (Table S2), we performed a more systematic analysis to find out the minimal integration range needed to obtain reliable quantum yield values. We performed chemical probe measurements using SRFA and a xenon lamp, and we quantified the surface irradiance via both absolute and relative methods. Using the experimental rate constants, we calculatedΦΔSRFAby incrementally increasingλup
to up to 800 nm (details insection S3).Figure 4summarizes the results of our analyses. In all cases,ΦΔ converged to an