Supplement of Biogeosciences, 14, 1631–1645, 2017 http://www.biogeosciences.net/14/1631/2017/
doi:10.5194/bg-14-1631-2017-supplement
© Author(s) 2017. CC Attribution 3.0 License.
Supplement of
Effects of low oxygen concentrations on aerobic methane oxidation in sea- sonally hypoxic coastal waters
Lea Steinle et al.
Correspondence to:Lea Steinle (lea.steinle@unibas.ch)
The copyright of individual parts of the supplement might differ from the CC-BY 3.0 licence.
1 Supplementary Tables
1.1 Supplementary Table S1
Table S1. Oxygen concentrations and consumption rates during the oxygen dependency experiment and corresponding methane oxidation rates determined with 3H-CH4 in Feb. 2014. Standard deviation (n=3) of initial ([O2]initial) and final ([O2]final) oxygen concentrations, and rMOx are indicated. tincubation corresponds to incubation time and O2 cons. to the oxygen consumption per hour.
1.2 Supplementary Table S2
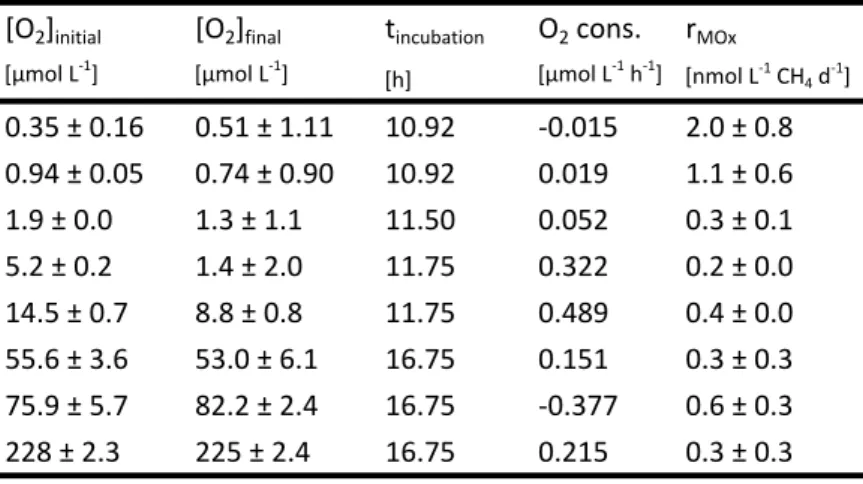
Table S2. Oxygen concentrations and consumption rates during the oxygen dependency experiment and corresponding methane oxidation rates determined with 3H-CH4 in June 2014. Standard deviation (n=3) of initial ([O2]initial) and final ([O2]final) oxygen concentrations, and rMOx are indicated. tincubation corresponds to incubation time and O2 cons. to the oxygen consumption per hour.
[O
2]
initial[O
2]
finalt
incubationO
2cons. r
MOx[µmol L-1] [µmol L-1] [h] [µmol L-1 h-1] [nmol L-1 CH4 d-1]
0.02 ± 0.04 0.01 ± 0.01 8.15 0.001 1.8 ± 0.1 0.10 ± 0.01 0.04 ± 0.02 8.25 0.007 1.5 ± 0.2 0.19 ± 0.02 0.08 ± 0.01 11.70 0.010 1.4 ± 0.2 0.40 ± 0.01 0.08 ± 0.02 12.00 0.026 1.3 ± 0.1 1.8 ± 0.0 0.78 ± 0.18 12.75 0.082 1.4 ± 0.1 13.0 ± 1.8 7.8 ± 1.1 13.00 0.402 1.4 ± 0.3 39.7 ± 1.1 30.9 ± 2.8 19.85 0.442 1.5 ± 0.1
125 ± 1 107 ± 0 19.90 0.864 1.5 ± 0.1
226 ± 1 209 ± 6 19.95 0.815 1.0 ± 0.1
[O
2]
initial[O
2]
finalt
incubationO
2cons. r
MOx[µmol L-1] [µmol L-1] [h] [µmol L-1 h-1] [nmol L-1 CH4 d-1]
0.35 ± 0.16 0.51 ± 1.11 10.92 -0.015 2.0 ± 0.8 0.94 ± 0.05 0.74 ± 0.90 10.92 0.019 1.1 ± 0.6 1.9 ± 0.0 1.3 ± 1.1 11.50 0.052 0.3 ± 0.1 5.2 ± 0.2 1.4 ± 2.0 11.75 0.322 0.2 ± 0.0 14.5 ± 0.7 8.8 ± 0.8 11.75 0.489 0.4 ± 0.0 55.6 ± 3.6 53.0 ± 6.1 16.75 0.151 0.3 ± 0.3 75.9 ± 5.7 82.2 ± 2.4 16.75 -0.377 0.6 ± 0.3 228 ± 2.3 225 ± 2.4 16.75 0.215 0.3 ± 0.3 [O
2]
initial[O
2]
finalt
incubationO
2cons. r
MOx[µmol L-1] [µmol L-1] [h] [µmol L-1 h-1] [nmol L-1 CH4 d-1]
0.02 ± 0.04 0.01 ± 0.01 8.15 0.001 1.8 ± 0.1 0.10 ± 0.01 0.04 ± 0.02 8.25 0.007 1.5 ± 0.2 0.19 ± 0.02 0.08 ± 0.01 11.70 0.010 1.4 ± 0.2 0.40 ± 0.01 0.08 ± 0.02 12.00 0.026 1.3 ± 0.1 1.8 ± 0.0 0.78 ± 0.18 12.75 0.082 1.4 ± 0.1 13.0 ± 1.8 7.8 ± 1.1 13.00 0.402 1.4 ± 0.3 39.7 ± 1.1 30.9 ± 2.8 19.85 0.442 1.5 ± 0.1
125 ± 1 107 ± 0 19.90 0.864 1.5 ± 0.1
226 ± 1 209 ± 6 19.95 0.815 1.0 ± 0.1
[O
2]
initial[O
2]
finalt
incubationO
2cons. r
MOx[µmol L-1] [µmol L-1] [h] [µmol L-1 h-1] [nmol L-1 CH4 d-1]
0.35 ± 0.16 0.51 ± 1.11 10.92 -0.015 2.0 ± 0.8
0.94 ± 0.05 0.74 ± 0.90 10.92 0.019 1.1 ± 0.6
1.9 ± 0.0 1.3 ± 1.1 11.50 0.052 0.3 ± 0.1
5.2 ± 0.2 1.4 ± 2.0 11.75 0.322 0.2 ± 0.0
14.5 ± 0.7 8.8 ± 0.8 11.75 0.489 0.4 ± 0.0
55.6 ± 3.6 53.0 ± 6.1 16.75 0.151 0.3 ± 0.3
75.9 ± 5.7 82.2 ± 2.4 16.75 -0.377 0.6 ± 0.3
228 ± 2.3 225 ± 2.4 16.75 0.215 0.3 ± 0.3
2 Supplementary Figures
2.1 Supplementary Figure S1
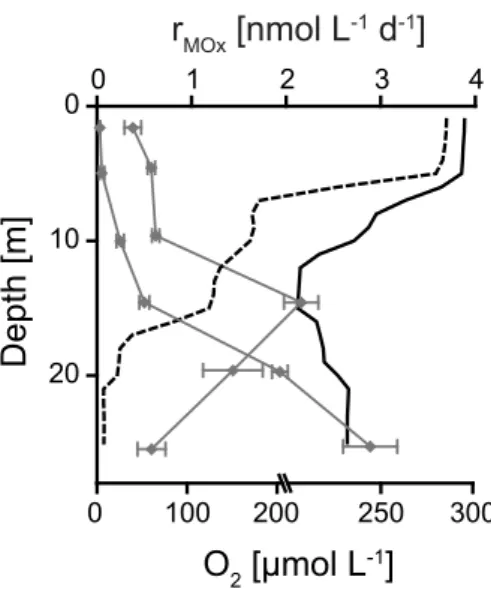
Figure S1. Profiles of unusual oxygen and methane oxidation rate profiles in Nov. 2013. Oxygen profiles (black lines) and methane oxidation rates (grey lines) from Oct. 2012 (dashed lines) and Nov. 2013 (solid lines). Error bars show the standard deviation (n=4). The profiles from Oct. 2012 show a ‘usual’ trend for fall (i.e., depletion of oxygen with depth and increase of methane oxidation rates), whereas in Nov. 2013 profiles show some deviations (i.e., higher oxygen in bottom waters than at 10 mbsl and lower rates in bottom waters).
0 100 200 250 300 20
10
00 1 2 3 4
Depth [m]
O
2[µmol L
-1]
r
MOx[nmol L
-1d
-1]
2.2 Supplementary Figure S2
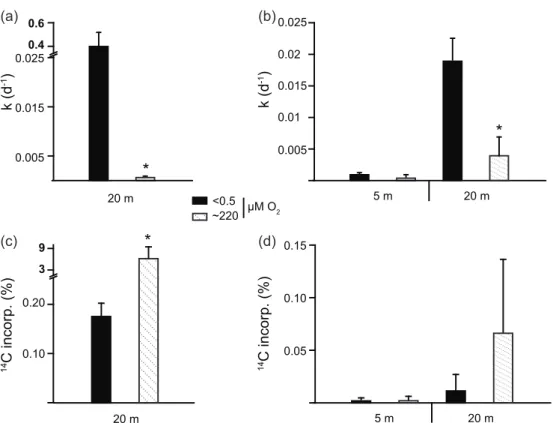
Figure S2. Methane-carbon assimilation in relation to oxygen concentration. Methane-carbon assimilation was determined from incubations amended with 14C-CH4 at saturated (~220 µmol L-1, shaded bars) or low oxygen concentrations (<0.5 µmol L-1, black bars) of water recovered in Nov. 2013 at 20 mbsl (a, c) and in Feb. 2014 at 5 and 20 mbsl (b, d). Incubations were performed in triplicates and standard deviations are indicated. (a, b) First-order rate constant k. (c, d) Fraction of oxidized methane incorporated into biomass.
Asterisks indicate a p-value <0.05 of a two-tailed, two-sample t-test assuming equal variance between the samples at low and high oxygen concentrations.
k (d-1)
0.025
0.01 0.015 0.02
0.005
5 m 20 m
5 m 20 m
µM O2
<0.5
~220
14C incorp. (%) 0.05
0.10 0.15
Supplementary Figure 1.
20 m
14C incorp. (%) 0.10
9 3 0.20
k (d-1)
0.005 0.015 0.025 0.6 0.4
20 m
(c) (d)
(a) (b)
*
*
*
2.3 Supplementary Figure S3
Figure S3. MOx first order rate constants (k) at different temperatures. First order rate constants of MOx were determined with 3H-CH4 amendments in triplicated incubations of water from 5 mbsl (a-d) and 20 mbsl (e, f), recovered in Nov. 2013 (a), Feb. 2014 (b), June 2014 (c, e), and Sept. 2014 (d, f). Red, dashed lines indicate the in situ temperatures for each date.
temperature [°C]
0.018
0.012
0.006 0 0.024
0.018
0.012 0.006 0 0.024 0.018
0.012 0.006 0 0.024
0.018
0.012
0.006 0 0.024
0.018
0.012 0.006 0 0.024 0.04 0.03
0.01 0 0.05
0.02
0 10 20 30 40
0 10 20 30 40
0 10 20 30 40 0 10 20 30 40
0 10 20 30 40 0 10 20 30 40
(b) (a)
(c)
(e)
(d)
(f) k [d-1]