CHAPTER THREE MATERIAL AND METHOD
The following chapter demonstrates a conceptual framework in order to reach all hypothetical questions set for this current study. Strategy involves a unique feature of mixed methods designs that cover quantitative and qualitative approaches. The beginning of this chapter provides this detail.
Then, it provides description of the quantitative investigation, which covers 2 parts of measurements; namely, assessment of fruit and vegetable consumption and estimation of disease burden attributable to low fruit and vegetable consumption risk factor. Explanation also includes data sources used, data preparation and data analysis. The chapter is ended with the description of the qualitative method, together with its technique and application.
3.1 Study Design
In response to the study aims and settled hypotheses, this study applied mixed methods for the investigations of fruit and vegetable consumption in Thailand with respect to magnitude, its associated disease burden and urbanization influence. Evolved in the fields of social and behavioral sciences, Mixed methods designs refer to combinations of quantitative and qualitative
methods applied in a single study or multi-phased research (Tashkori and Teddlie 1998). Such designs using triangulation techniques encompass both types of data collection—quantitative and qualitative techniques—and both types of data analysis—statistical and qualitative analysis (Creswell 2003).
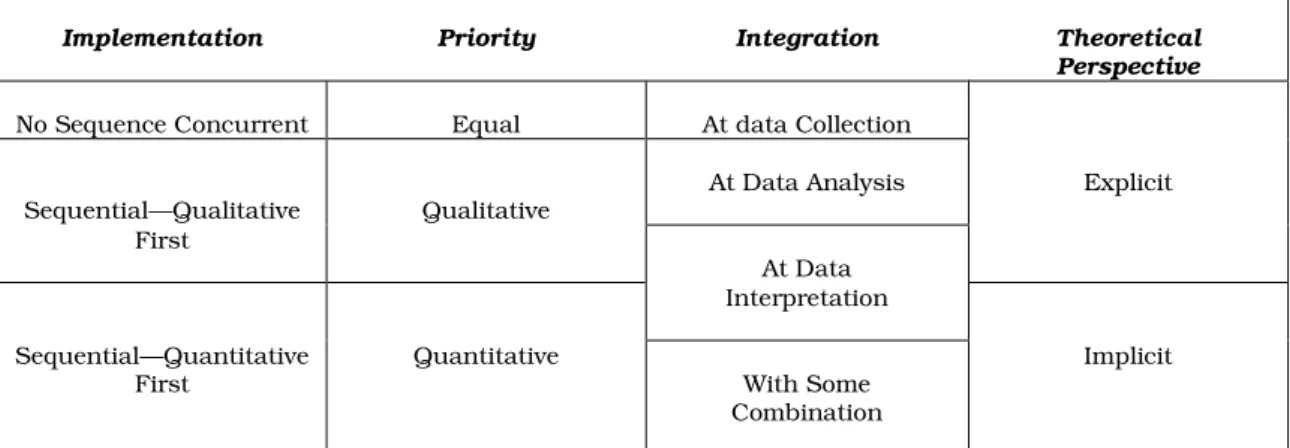
In the frame of theoretically sequential explanatory model (Table 3.1),
the priority principally emphasizes quantitative strategies (Creswell 2003).
This study adopted the Dominant-less dominant study design, denoted as the study within a single dominant paradigm with a small component of the overall study drawn from an alternative design (Tashkori and Teddlie 1998).
(p.177).
Table 3.1: Decision choices for determining a mixed methods strategy of inquiry.
Implementation Priority Integration Theoretical
Perspective
No Sequence Concurrent Equal At data Collection
Sequential—Qualitative Qualitative At Data Analysis Explicit First
At Data Interpretation Sequential—Quantitative
First Quantitative
With Some Combination
Implicit
Source: Research design qualitative, quantitative, and mixed methods approaches, Creswell (2003), pp. 211
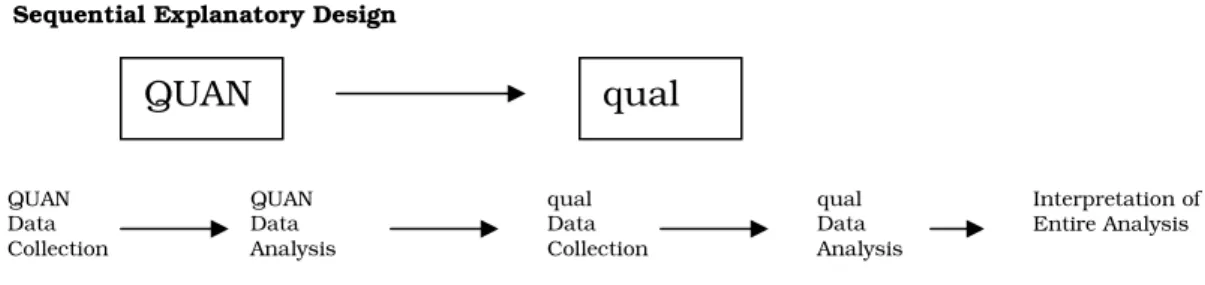
To explain the theoretical elements from Table 3.1 applied to this
current study, the implementation sequence of the quantitative data
collection as well as its priority came first with intent to addressing the low
fruit and vegetable intake risk’s magnitude and its associated disease
burden. Then, in the later phase, the collected qualitative data were used to
amplify the understanding of correlation between low intake of fruits and
vegetables and the urbanization influence. Integration of two types of data
covered the stages data analysis and interpretation; namely, quantitative
multivariate analysis, as well as qualitative content analysis. Figure 3.1
illustrated the applied design to this current study.
Figure 3.1: Sequential mixed strategy.
Sequential Explanatory Design
Source: Research design qualitative, quantitative, and mixed methods approaches, Creswell (2003), pp. 211
3.2 Study Strategy
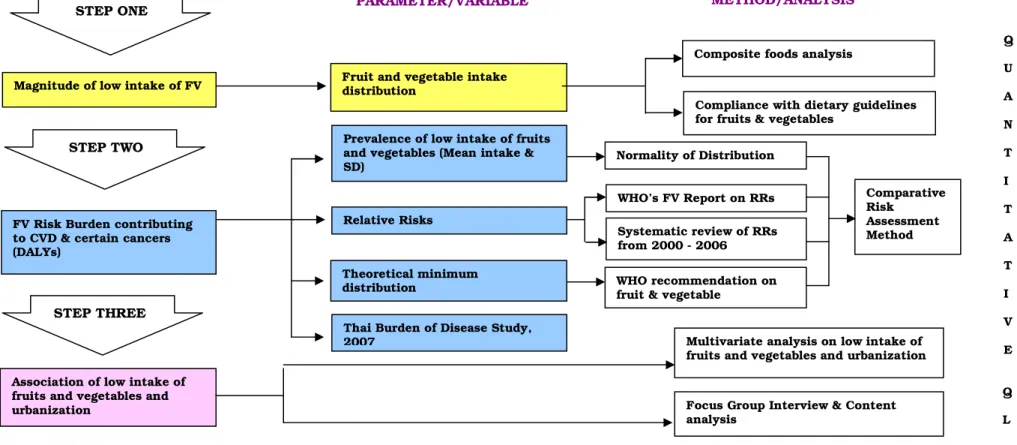
The study implementation covered 3 steps. (see Figure 3.2) Firstly, addressing the magnitude of low intake of fruits and vegetables involved assessing fruit and vegetable intake distribution derived from Thailand’s 2006 Fifth National Nutrition Survey (NNS V) (MOPH 2006). This step also included the investigations of the composite foods and compliance with the dietary guidelines for fruit and vegetable intakes.
Later, the specified fruit and vegetable intake distribution patterns from the step one were an input in the step of estimating the prevalence of low intake of fruit and vegetable risk factor among the study population.
However, in quantifying disease burden attributable to low intake of fruit and vegetable risk factor, data on DALYs from Thailand’s National Burden of Disease 2007 for the calculations, which technically adopted from the Comparative Risk Assessment Model (CRA) developed by the World Health Organization (Ezzati et al. 2004). (details in Chapter 2.2)
QUAN qual
QUAN Data Collection
QUAN Data Analysis
qual Data Collection
qual Data Analysis
Interpretation of Entire Analysis
Q U A N T I T A T I V E
Q
L Multivariate analysis on low intake of
fruits and vegetables and urbanization
Focus Group Interview & Content analysis
Association of low intake of fruits and vegetables and urbanization
Compliance with dietary guidelines for fruits & vegetables
Magnitude of low intake of FV
Composite foods analysis Fruit and vegetable intake
distribution
Thai Burden of Disease Study, 2007
Prevalence of low intake of fruits and vegetables (Mean intake &
SD)
Relative Risks
Theoretical minimum
distribution WHO recommendation on
fruit & vegetable consumption
WHO’s FV Report on RRs Systematic review of RRs from 2000 - 2006 Normality of Distribution rules
Comparative Risk
Assessment Method FV Risk Burden contributing
to CVD & certain cancers (DALYs)
Figure 3.2: Illustration of study framework, parameter/variables and method/analysis
Study Theme: Low fruit and vegetable consumption in Thailand, magnitude, disease burden and urbanization influence Hypotheses:
• Magnitude of low intake of fruit and vegetable risk in Thailand.
• Burden of low intake of fruit and vegetable risk contributes to cardiovascular diseases and certain cancers in Thailand.
• Those who live in urbanized areas are predisposed to low intake of fruits and vegetables.
Data source: Thailand’s 2006 fifth National Nutrition Survey (2004-5); Nationally representative survey; Urban & Rural; Methods: 2-day 24-HDR Strategy:
CVD = Cardiovascular diseases FV = Fruits and vegetables SD = Standard deviation
STEP TWO
STEP THREE
STEP ONE PARAMETER/VARIABLE METHOD/ANALYSIS
The final analytical step investigated the relationship between low intake of fruits and vegetables and urbanization. Combined with the quantitative data from the Thailand’s 2006 Fifth National Nutrition Survey (NNS 5) (MOPH 2006), analyses on the collected qualitative data assisted in explaining meaningful patterns of such an association.
3.3 Quantitative Approach
In the quantitative section, 2 main steps of investigations were included. The first step involved assessing fruit and vegetable intake distribution where data were derived from Thailand’s 2006 Fifth National Nutrition Survey (NNS V), provided by Division of Nutrition, Department of Health, Thailand’s Ministry of Public Health. This step also included the investigations of the composite foods and compliance with the dietary guidelines for fruit and vegetable intakes. Later, the daily mean intake of fruits and vegetables from the data source used in the previous step, together with data on burden of disease data from Thailand’s National Burden of Disease 2007, provided by International Health Policy Program, Thailand’s Ministry of Public Health, were inputs for the step of quantifying disease burden attributable to low intake of fruit and vegetable risk factor.
3.3.1 Data Sources
The following data source used for the assessment of fruit and vegetable
intake distribution, as well as for the estimation of low intake of fruit and
vegetable intake risk contributing to selected diseases, were explained in
more details below. For the risk estimation, additional data source used, the
Thailand’s National Burden of Disease 2007, were provided under its section (3.3.5).
The analyses were based on data collected from the Thailand’s 2006 Fifth National Nutrition Survey (NNS 5) (MOPH 2006), under the implementation of the Nutrition Division, Thailand’s Ministry of Public Health. For public health planning, health surveys are a prime data source with highly diverse use, providing national data on incidence and prevalence of diseases, occurrence of healthy and unhealthy behaviors, exposures to potential risk factors, dietary intake, physiologic measures of the population, or, even, cost and utilization of health-care services (Aday 1996, Korn and Graubard 1999).The NNS 5 survey was, in general, aimed at providing food and nutrient data to assist, as well as evaluate the implementation of Thailand’s Food and Nutrition Policy, and to contribute to the evidence base for future national healthy eating. Its specific objectives also included the provision of food and nutrient intake data in comparing with the dietary guidelines for Thais in general, and for those population groups at risk to health related to diet (MOPH, 2006).
The NNS 5 (MOPH 2006), a population-based, cross-sectional survey,
was conducted during 2003-2004. Targeted populations were designed to
cover 4 age-sex groups; namely, children aged 0-5 years, children (5-14
years), working age group (15-59 years), and the elderly (60 years and over)
both males and females. Specific population groups of interest additionally
included sexually active females (15-49 years), pregnant and lactating
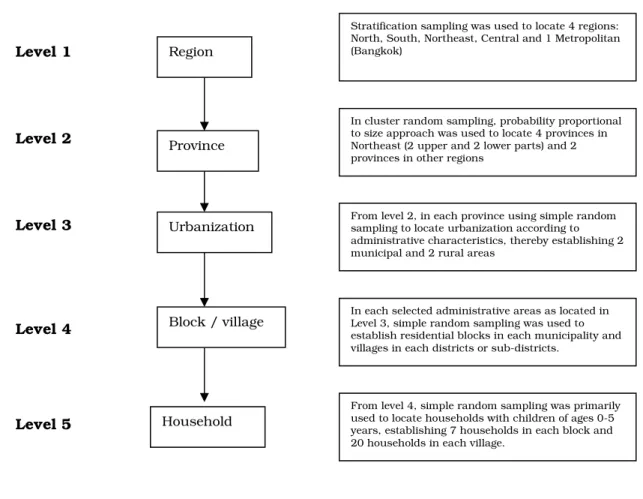
women. The sampling framework of the NNS 5 involving 5 selection steps is
presented in Figure 3.3. With the stratified multistage cluster sampling
procedure locating households with children of ages 0-5 years as the
sampling base, 36 strata nationwide were established and covered 4,040
households. The sample size formula was applied: SS =
2P(1-P) / C
2; where
= value (1.96 for 95% CI), P = Prevalence of malnutrition of children aged under 5 years in Thailand (31% expressed as decimal), and C = CI, expressed as decimal, as well as probability proportional to size approach, to determine the sample size in each aspect of investigation, such as clinical examination, anthropometry, food consumption behavior, biochemical investigation or food consumption level. By this, a total of 11,322 randomly selected participants from both urban and rural areas nationwide joined in the survey on a voluntary basis.
In assessing the food consumption level, after technical calculation in relation to availability of resources, the sample size of 3881 individuals or one third of the whole selected population was drawn and conducted with 2-day 24-hour dietary recall.
Figure 3.3: Sampling framework of the Thailand’s 2006 fifth National Nutrition Survey (NNS 5)
Level 1
Level 2
Level 3
Level 4
Level 5
Province
Urbanization Region
Block / village
Household
Stratification sampling was used to locate 4 regions:
North, South, Northeast, Central and 1 Metropolitan (Bangkok)
In cluster random sampling, probability proportional to size approach was used to locate 4 provinces in Northeast (2 upper and 2 lower parts) and 2 provinces in other regions
From level 2, in each province using simple random sampling to locate urbanization according to administrative characteristics, thereby establishing 2 municipal and 2 rural areas
In each selected administrative areas as located in Level 3, simple random sampling was used to establish residential blocks in each municipality and villages in each districts or sub-districts.
From level 4, simple random sampling was primarily used to locate households with children of ages 0-5 years, establishing 7 households in each block and 20 households in each village.
Assessment methods used in NNS 5 included:
Field work questionnaires were used to collect information on demographic and socio-economic characteristics and educational status.
Participants were also asked a series of questions on topics in relation to their dietary lifestyles, such as their usual type of diet, addition of salt to food and desired dietary changes.
Anthropometric measurements on individuals covered height and weight, waist and hip ratios (WHR), and Lange Skin-fold Caliper, together with blood pressure. All equipment was standardized before applications and conducted by trained public health personnel, followed by a validation of area-designated nutritionists or public health nurses.
The daily food consumption technique used as the main indicator of
food intake was a 2-day 24-hour food recall. The recall records given by the
informants included meals or consumptions counted at the last 48 hours
prior to the time of rendered interview. Since participants were asked to
report their food intake during the previous 2 days in the forms of detailed
meal-by meal recordings of types and quantities of foods and beverages
consumed, this allowed for a good precision level in the estimate of individual
nutrients and overall nutrient composition (Margetts and Nelson 1997, Willet
1998). All participants were individually interviewed by trained public health
personnel; interview data were then validated by area-designated responsible
nutritionists. Later, the INMUCAL software developed by the Nutrition
Research Institute, Mahidol University was used to compute individual
dietary intake, energy and nutrients consumed, and finalized into one–day
consumption (INMU 2002). The software included 1,680 food lists and 12
basic nutritional values. The program was used as a calorie and nutrient
calculator which was of use for dietetic and nutritional management.
Nutritional analysis could be presented in either MS Excel or SPSS/PCT formats (INMU 2002).
Additional measurements included clinical and biomedical assessment applied to those specified subpopulation groups. All equipment was standardized before applications and conducted by trained public health nurses. Public health nutrition physicians were assigned to standardize the diagnoses and validate the conduct. All blood samples were sent to the designated health provincial offices where laboratories were available.
Investigations included nutrient deficiencies or disorders, such as iron, iodine, vitamin A, thiamine, riboflavin, niacin and lipids.
3.3.2 Data features
The original database of the Thailand’s 2006 Fifth National Nutrition Survey (NNS 5), Department of Health, Ministry of Public Health (MOPH 2006) comprised 10 Excel
®-format demographic database working files (numbers of participants, sex, age and geographic areas), indicating 3881 respondents.
Additionally, dietary consumption data appeared in the 10 SPSS
®-format database working files. Each food was listed as consumed in conjunction with its descriptors identified through their identification number and sampling area in both file formats. A total of 1500 different food codes in 20 food categories were recorded as consumed in the survey (INMU, 2002). Food codes were identified both as discrete portions and as composite foods. Food codes 4 and 5 indicated food items in fruit and vegetable categories, respectively.
Composite foods indicated with codes 16, 17 and 18 referred to mixed
dishes or recipes that included fruits and vegetables with other food
components (INMU, 2002). Table 3.2 demonstrated examples of food details recorded on the 2-day 24-hour dietary recall. In this current analysis the major food groups of fruits and vegetables defined in accordance with the WCRF/AICR’s fruit and vegetable classification were of priority (WCRF/AICR 1997) (see Chapter 2.1.1). In order to generate best estimates of fruit and vegetable intake (William 1995, Kreb-Smith et al. 2001, O’Brien et al. 2003, Kim et al. 2003), it was decided to perform composition food analysis.
However, composite food estimations were carried out in response to information available. Details were demonstrated in the data preparation section.
At present, due to lack of recipe database, particularly collected during
the course of the survey; scant evidence on recipe details and manufactured
food products; as well as no nationally consensus agreement on the
standardized Thai food recipe, the estimation of composite foods was then
performed using the Internet-based recipes (Clay’s Kitchen: Dtum-Raa Ahaan
Thai 2007), combined with Recipes for Golden Age Women Cookbook (MOPH
2000). One hundred and sixty one recipes were identified as containing either
fruits or vegetables or both. The contents of individual vegetables and fruits
in those composite foods were proportionally estimated in terms of percentage
to the total contents, as listed in Appendix 1. This, therefore, allowed the
disaggregation of fruits and vegetables contributed to composite foods.
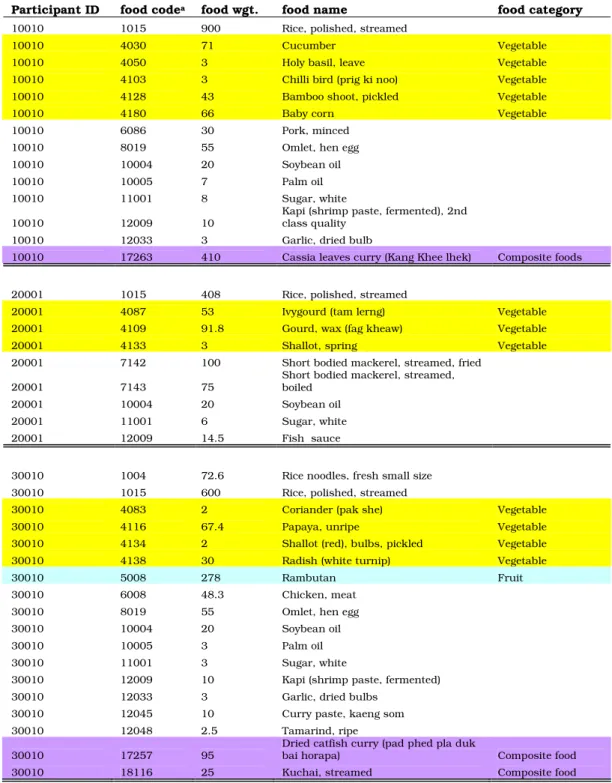
Table 3.2: Example of food consumed in each individual participant for a 2-day recall Participant ID food code
afood wgt. food name food category
10010 1015 900 Rice, polished, streamed
10010 4030 71 Cucumber Vegetable
10010 4050 3 Holy basil, leave Vegetable
10010 4103 3 Chilli bird (prig ki noo) Vegetable
10010 4128 43 Bamboo shoot, pickled Vegetable
10010 4180 66 Baby corn Vegetable
10010 6086 30 Pork, minced
10010 8019 55 Omlet, hen egg
10010 10004 20 Soybean oil
10010 10005 7 Palm oil
10010 11001 8 Sugar, white
10010 12009 10 Kapi (shrimp paste, fermented), 2nd
class quality
10010 12033 3 Garlic, dried bulb
10010 17263 410 Cassia leaves curry (Kang Khee lhek) Composite foods
20001 1015 408 Rice, polished, streamed
20001 4087 53 Ivygourd (tam lerng) Vegetable
20001 4109 91.8 Gourd, wax (fag kheaw) Vegetable
20001 4133 3 Shallot, spring Vegetable
20001 7142 100 Short bodied mackerel, streamed, fried
20001 7143 75 Short bodied mackerel, streamed,
boiled
20001 10004 20 Soybean oil
20001 11001 6 Sugar, white
20001 12009 14.5 Fish sauce
30010 1004 72.6 Rice noodles, fresh small size
30010 1015 600 Rice, polished, streamed
30010 4083 2 Coriander (pak she) Vegetable
30010 4116 67.4 Papaya, unripe Vegetable
30010 4134 2 Shallot (red), bulbs, pickled Vegetable
30010 4138 30 Radish (white turnip) Vegetable
30010 5008 278 Rambutan Fruit
30010 6008 48.3 Chicken, meat
30010 8019 55 Omlet, hen egg
30010 10004 20 Soybean oil
30010 10005 3 Palm oil
30010 11001 3 Sugar, white
30010 12009 10 Kapi (shrimp paste, fermented)
30010 12033 3 Garlic, dried bulbs
30010 12045 10 Curry paste, kaeng som
30010 12048 2.5 Tamarind, ripe
30010 17257 95 Dried catfish curry (pad phed pla duk
bai horapa) Composite food
30010 18116 25 Kuchai, streamed Composite food
Note:1.
aFood code identified according to Food code ND.2 --Thai-English (INMU 2002).
2. Composite foods refer to fast foods (codes 16), mixed dishes (codes 17) and disserts (codes 18)
In addition, apart from the key variable of the combined intake of fruits
and vegetable, two variables for each fruit and vegetable consumed are of
interest to reflect the consumption trend and to suggest policy guidance. The
predictive variables that would have influences upon intake of fruits and vegetables in this study included demographic variables; namely, sex, age group, place of residence (urban vs. rural) and country region (north, south, northeast and central).
3.3.3 Data preparation
1. Investigating the coded food items consumed by each individual participant randomly, as similarly indicated in Table 3.2, whether they were in accordance with those designated in fruit and vegetable categories (Food Code ND. 2, Institute of Nutrition, Mahidol University, 2002: ISBN: 974-04-1121-5), and also complied with the definitions given in the WCRF/AICR’s fruit and vegetable classifications (WCRF/AICR 1997).
2. Adopting the Internet-based recipes (Clay’s Kitchen: Dtum-Raa Ahaan
Thai 2007) and “Recipes for Golden Age Women Cookbook (MOPH
2000)” as a basis for performing estimated proportions in percentage of
fruit and vegetable contents contributed to composite foods, thereafter
allowing disassembling each content in grams/day. Table 3.3
illustrated an example of a recipe of which vegetable contents were
proportionally converted against the total ingredients/components,
generating percentage of contribution. However, the recipes from both
sources provided only half of the composite food lists. The remaining
was performed based on personal experience on Thai foods as well as
additional inquiries personally made to other resource persons in
Thailand, e.g. family, relatives, colleagues and friends who have more
experiences, especially on local mixed dishes. One hundred and sixty
one recipes identified as containing either fruits or vegetables or both, were demonstrated in Appendix 1.
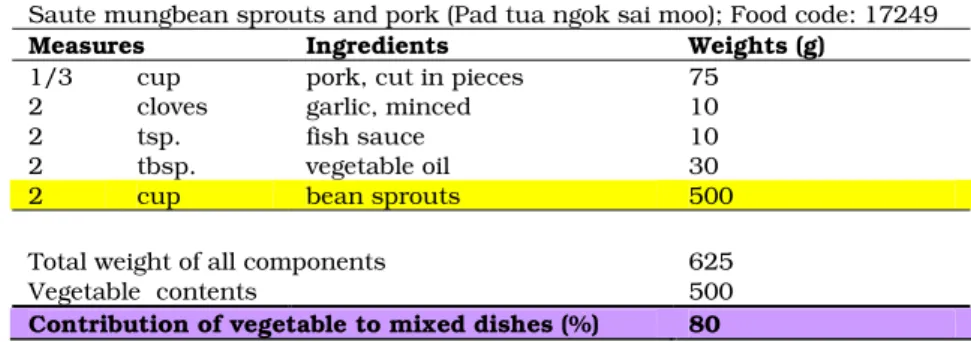
Table 3.3: Example of disaggregation of fruits or vegetables contributing to composite foods or mixed dishes.
Saute mungbean sprouts and pork (Pad tua ngok sai moo); Food code: 17249
Measures Ingredients Weights (g)
1/3 cup pork, cut in pieces 75
2 cloves garlic, minced 10
2 tsp. fish sauce 10
2 tbsp. vegetable oil 30
2 cup bean sprouts 500
Total weight of all components 625
Vegetable contents 500
Contribution of vegetable to mixed dishes (%) 80
3. Merging the demographic data in the Microsoft Excel
®format into the working files in the SPSS
®format for Windows
™version 12.0 (SPSS Inc., Chicago, IL, USA) to generate three variables for each fruit, vegetable, and fruit and vegetable compound consumed in each individual; that is, weight consumed as a discrete portion; weight consumed from composite foods; and total weight consumed (discrete portion plus composite foods). Such variables were thus combined to create total intake for fruit and vegetable categories for males and females by age, and also for those in geographical categories of urbanization and country region.
4. Cleaning the merged and restructured data of the original total of 3881
participants from 4 age-group data files (preschool, school, working-
age and ageing groups). Eight cases were re-assigned in accordance
with their logics, e.g. place of residence and age strata. Only 2 cases
were excluded due to logic errors of coding. The final number of total
participants for the final analysis was 3,879 persons.
5. Identifying variables for further analyses:
Dependent variables: total fruits, total vegetables, and total fruit and vegetable combined
Independent variables: sex (females, males), age groups (below 15 years, 15-29 years, 30-59 years, above 60 years), country region (north, south, northeast, central) and urbanization (urban, rural)
3.3.4 Statistical analysis
1. Determining central tendency indicators for the intakes in grams per day of each fruit or vegetable group. After construction of statistical visual check and test of normality indices (see Annex 1), indicating the violation of the distributional conditions for parametric methods (Normality of distribution), the median was used to reflect distribution of fruits and vegetables for males and females, by age, and also for those in different categories of area of residence and country region.
However, for other analyses, mean values were still used for various reasons, such as comparability in compliance with the international standard and technical requirements for risk estimation according to the CRA framework.
2. Applying the non-parametric Mann-Whitney test to investigate
differences in rank intakes of fruits, vegetables, and fruits and
vegetables between males and females, as well as among residents in
urbanization. Differences in rank intakes of fruits, vegetables, and
fruits and vegetables among age groups and country regions were
explored with non-parametric Kruskal-Wallis tests. P values for
statistical significance and the tests used were indicated in each table.
P values < 0.05, with a two-sided test, were taken as statistically significant.
3. Turning to use the mean daily intakes in grams per day and standard
deviation as a central tendency indicator with regard to compliance
with the dietary guidelines, both domestically and internationally, for
fruits and vegetables. Note that such guidelines were methodologically
based on the normal distribution rules, indicating the use of mean and
standard deviation; therefore, creating a sense of comparability. The
1997 WCRF/AICR’s recommendations, indicating a minimum intake of
fruits and vegetables at 400 g/day (or 5 servings of a portion size of 80
g), were used as international dietary standards. The dietary guidelines
issued by Thailand’s Ministry of Public Health (MOPH 2000) were used
as the national recommendation to identify the percentage of low
consumers. The guidelines suggest a minimum consumption of fruits
per person per day at 4 servings with an approximate portion size of
70-120 g. For the vegetable category, a minimum daily intake of 5
servings with a portion size of 40-50 g is advised. In this analysis, it
was decided to use a portion size of an average 95 g for fruits and of 40
g for vegetables, applied the same recommended serving quantities,
thereby corresponding to approximately 380 g and 200 g/day
respectively. The national guidelines were chosen as an additional
reference by reasons of Thai-population specific, apart from the
international recommendations. Based on these guidelines, the
percentages of individuals whose daily intake did not exceed the
recommended levels were assessed.
3. 3.5 Estimation of attributable fraction and disease burden
The comparative risk assessment method (CRA) was adopted to demonstrate adverse health effects of low intake of fruits and vegetables (Ezzati et al.
2002). Separate estimates of such adverse effects included ischemic heart disease, stroke, and cancers of lung, stomach, colon/rectum and esophagus (also see Chapter 2.3). In contrast with other risk exposures, fruit and vegetable consumption is uncommon in the sense that it provides the potential protective effect against diseases. When applied to this study, estimates, hence, were made against a theoretical maximum of the exposure level that would generate the lowest population risk for adverse health outcomes if greater consumption of fruit and vegetable was achieved (Ezzati et al. 2002, Ezzati et al. 2004).
3.3.5.1 Data Sources
Apart from the mean daily intake of fruits and vegetables technically obtained
from the previous step on fruit and vegetable consumption assessment,
burden of disease estimates (DALYs) were a main source for risk
quantification in this study. The DALYs estimates were gained from the
Thailand’s national burden of disease (NBD) study (Bundhamcharoen 2007),
which was the updated estimations from the ones previously conducted in
2002 (MOPH 2002a). Crucial features of the NBD study included the 2005
population figures for each region and the whole of the Kingdom, which were
used as a base for the study. Like the previous NBD study, The study aimed
to provide a comprehensive assessment of the burden of disease, injuries and
important risk factors for the population, which was used as a baseline for
assessing improvements in health and performance of Thai health system; as a comprehensive data source on health needs to support rational resource allocation and to address inequalities in health status across sub- populations; and as a basis for further development of cost-effectiveness studies considered for development and prioritization of public health interventions. The DALY estimates from the Thai NBD study included the sum of the years of life lost due to premature mortality (YLLs) in the population and the equivalent healthy years lost due to disability (YLDs) for incidences of the health conditions (Bundhamcharoen 2007).
To estimate YLLs, mortality data were a key parameter. The NBD study applied the Verbal Autopsy (VA) Study (MOPH 2003) as an interim measure to verify causes of death in the vital registration system, due to its poor quality despite its high coverage. The distribution of verbal autopsy diagnoses for each vital registration diagnosis was applied to vital registration data for the whole country to obtain cause-of-death estimation by age and sex. It was noted that in this updated version of NBD, the cause-of-death estimation applied was yet based on the previous findings. The updated verbal autopsy data are underway; therefore, affecting changes in death and YLL estimates in the future NBD study. The NBD study applied the International Classification of Diseases (ICD-10 codes) to define the mutually exclusive categories for more than 100 conditions and 400 disabling sequelae.
Mortality and morbidity were classified into a comprehensive list of 3 major
disease groups (Pre-transitional causes, i.e. communicable, maternal,
perinatal and nutritional conditions; Non-communicable causes; and
Intentional and unintentional injuries), 20 categories of disease and injuries,
and 96 specific conditions corresponding to the structure of the GBD list of
conditions
To estimate YLDs, data sources included disease notification report, injury surveillance, cancer registry, renal replacement treatment registry, blood donor from Thai Red Cross, hospital inpatient database, health and welfare survey, national health examination survey, national nutrition survey, mental health survey, national dental health survey, specific epidemiological studies, e.g. HIV/AIDS, GBD estimates and experts’ opinions.
This NBD study adopted the actual or derived disability weights from two sources: the GBD and the Dutch weights, applied in the Australian NBD study. These two reference weights, however, were estimated based on each independent condition, not including co-morbid (or coexisting) conditions. No attempt was made in this Thai NBD study. The discounted YLLs and YLDs without age weights were presented in the study.
The provided disease burden data of selected disease outcomes, i.e.
coronary heart disease, ischemic stroke, lung, stomach, colon-rectum and esophagus cancers, contributing to this current estimation of low intake of fruits and vegetable risk included deaths, YLLs, YLDs and DALYs estimates.
3.3.5.2 Step of analysis
1. Estimating mean and standard deviations of daily intake of fruits and
vegetables stratified by sex and specified age group (0-4, 5-14, 15-29,
30-44, 45-59, 60-69, 70-79, >=80). According to the CRA methodology
that requires exposure distribution by reason of extrapolation for
generalization as a whole (Ezzati et al. 2004), the distribution of fruit
and vegetable consumption in Thailand were, therefore, replicated in
feature of means and standard deviations (grams per day) using SPSS
®format for Windows
™version 12.0 (SPSS Inc., Chicago, IL, USA) in the same way as performed in 3.3.4.
2. Preparing worksheets for attributable fraction and burden of disease analyses by using Microsoft Office Excel
®for Window XP
™version 10.0 worksheets. All the worksheets performing risk quantification following the CRA framework were presented in Appendix 3.
3. Using daily mean intakes and standard deviation of fruits and vegetables stratified by sex and age group from step 1 to generate probability of values at each unit of serving change
1, under the Normality Distribution rule (Altman 1991 and Munro et al. 2005), applying NORMDIST function (x, mean, standard deviation, cumulative). Prevalence of low intake of fruits and vegetables at each specified age group and sex was derived from differences between observed and expected values at each unit of serving changed. Note that population aged below 15 years was excluded due to very rare occurrence of the diseases under study. Performing the estimation of prevalence of low intake of fruits and vegetables was presented in Appendix 3.1.
4. Calculating prevalence of the theoretical maximum distribution for fruit and vegetable intake by applying the same method in step 1 but using the international criterion for the theoretical maximum of fruit and vegetable intake in adult at 600 ± 50 grams per day for the theoretical optimum level and 400 ± 50 grams per day for the suggested minimum target level (WCRF/AICR 1997, WHO 2003).
Unit of serving change refers to a change per 80 grams per day increase of fruit and vegetable intake.
5. Computing population attributable fraction of low intake of fruits and vegetables (AF
FV) in specified disease outcomes. Relative risks
2applied to this study were, as discussed in Chapter 2.3, basically derived from the WHO’s CRA report (Ezzati et al. 2004) (see Table 2.9). Relative risks included ischemic heart disease, stroke and cancers of the lung, stomach, esophagus and colon/rectum. Since increased fruit and vegetable intake is considered generating the protective effect, inverted relative risks were used in calculating the adverse effect of decreased consumption levels. It was assumed that a linear relationship between logarithm of the relative risk for each age stratum was associated with an 80-gram increase in daily fruit and vegetable intake (Ezzati et al.
2004), and the level of 600 g/day intake was defined as base line of no risk (RR = 1); consequently, lowering intake of fruit and vegetable indicated an increase in risk to disease; namely, an exponential increase of inverted RR according to unit of serving changes. This amount corresponded to a recognized standard serving size increment in intake scale in the same way as estimates to apply to an 80 g/day comparison difference (WCRF/AICR 1997, Ezzati 2002, Ezzati et al.
2004). It was also assumed that the same proportional increase was applied in both sexes (Ezzati 2002 and Ezzati et al. 2004). The worksheets of conducting this step were presented in Appendix 3.2.
4. Applying the formula for Attributable Fraction (AF
FV) with the current distribution of exposure to low fruit and vegetable intake across population subgroups at different levels of consumption (stratified by age group and sex), theoretical maximum distribution, relative risks
2
The basic requirements of relative risks for the comparative risk assessment (CRA) framework for low
intake of fruit and vegetable intake risk factor are that relative risks allow being converted into the unit of
change in relative risks along with changes in each 80-gram-increment in fruits and vegetables (Ezzati et
al. 2004).
(RRs) of the specified diseases. The formula for calculation were indicated as follows:
n n
P
iRR
i- P
’iRR
ii = 1 i = 1
;
n
P
iRR
i i = 1where
AF
FV= Attributable fraction of low fruit and vegetable intake among the exposed;
P
i= Prevalence of the actual (estimated) exposure in Thailand;
P
i’ = Prevalence in reference population (target level of fruit and vegetable consumption established by CRA);
RR
i= Relative Risk for a specified disease outcomes;
i = Fruit and vegetable consumption level
5. Calculating the burden of disease attributable to low intake of fruits and vegetables was performed following the formula below after obtaining AF
FVestimates. In this study, a prime data source in providing disease burden estimates of deaths, years of life lost (YLLs), years living with disability (YLDs) and disability-adjusted life years (DALYs) for the disease of interest was the updated analytical figures from the Thailand’s national burden of disease (NBD) study (Bundhamcharoen 2007) by age group and sex.
YLL from low intake of fruits and vegetables = AF
FVx YLL (age-sex-disease groups)
YLD from low intakes of fruit and vegetables = AF
FVx YLD (age-sex-disease groups)
DALYs from low intake of fruits and vegetables
= YLL from low intake of fruits and vegetables + YLD from low intake of fruits
and vegetables
Performing the estimation of attributable deaths, YLLs, YLDs and DALYs was also illustrated in Appendix 3.3.
6. Performing sensitivity analysis to characterize variations of the risk burden of low intake of fruits and vegetables associated with its input parameters. Due to restriction of access to other input data, this study only applied upper and lower confidence limits of relative risks for the selected disease outcomes provided by the CRA report (Ezzati et al.
2004), to provide alternative possibilities.
3.3.6 Multivariate analysis
In response to the study’s hypothesis on influence of urbanization and other factors (see page 107), multivariate linear regression modeling was applied to determine whether people living in urbanized areas are predisposed to low intake of fruits and vegetables. The model postulated a continuous amount of the total fruit and vegetable consumed, as predicted by a series of categorical demographic covariates, i.e. sex, age group (below 15 years, 15-29 years, 30- 59 years, above 60 years), country region (north, south, northeast, central), with the observed indicator of urbanization (rural, urban).
As mentioned in the initial descriptive statistical analysis in 3.3.4, due
to the extremely positive skewed distribution of data (see appendix 1),
applying logarithmic transformation log10(1+x) approach was selected, after
attempts of other alternatives, e.g. square root and natural log (ln)
transformations, to produce the best normalized distribution. Dummy
variables for the categorical predictor variables were generated. Coefficient of
determination (Adjusted R
2) and F-test from analysis of variance for
determining the model fitting were also provided. Alternatively, the age
adjustment (age + age square) method was also included in the models (Adjusted model II) to explore the effect of urbanization towards total consumption of fruits and vegetables. However, it was decided to conduct regression analysis on both data sets (total fruits and vegetables and log- transformed total fruits and vegetables) and compare the results since the transformed data still had non-normalized features (see Appendix 2).
Regression coefficients (Betas) were presented with 95% confidence interval while two-tailed P-values at 0.05 were considered statistically different.
Statistical analyses were performed by using SPSS
®format for Windows
™version 12.0 (SPSS Inc., Chicago, IL, USA). Note that since the produced results from both data sets mainly provided similar patterns, it was decided to present results from the original data distribution where the nature of allometric relationship among data still remains (Voordouw 2001)
To conclude, this quantitative part indicated magnitude of low intake of fruit and vegetable risk factor, its contributing disease burden of cardiovascular diseases and cancers presented in the unit of disability- adjusted life years (DALYs) and its associated determinants, specifically urbanization.
3. 4 Qualitative Approach
After the quantitative analytic investigations, the qualitative approach was
adopted in expanding an understanding how urbanization affects intake of
fruits and vegetables. If the urbanization or residing in the city is one of the
key determinants affecting amounts of fruit and vegetable consumption, it is
important to be able to demonstrate the phenomena as well as their potential
related factors. In addition, it is worthwhile to gain further information on
awareness of or views on the promotion of fruit and vegetable consumption.
Given this, such information will be of great benefit to extending insights into the best effective interventions to promote a higher consumption of fruits and vegetables.
3.4.1 Interview method and sample characteristics
Focus group interviews, coupled with personal interviews, for in-depth probing were used in exploring the issues that were of concern to the groups as well as in response to the study hypothesis. The strength of this method includes meaningfulness derived from data interpretation, which represent reality of the people, places and events (Denzin and Lincoln 2000).
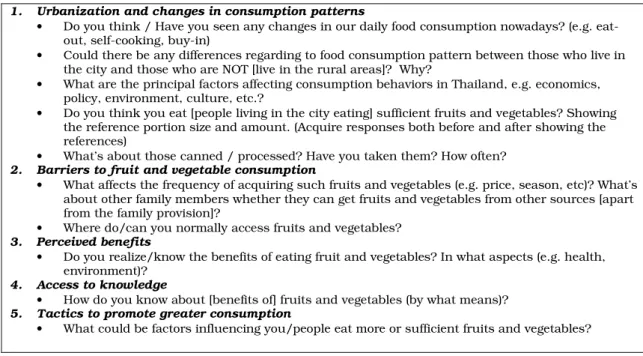
Table 3.4: Focus group interview questions
1. Urbanization and changes in consumption patterns
• Do you think / Have you seen any changes in our daily food consumption nowadays? (e.g. eat- out, self-cooking, buy-in)
• Could there be any differences regarding to food consumption pattern between those who live in the city and those who are NOT [live in the rural areas]? Why?
• What are the principal factors affecting consumption behaviors in Thailand, e.g. economics, policy, environment, culture, etc.?
• Do you think you eat [people living in the city eating] sufficient fruits and vegetables? Showing the reference portion size and amount. (Acquire responses both before and after showing the references)
• What’s about those canned / processed? Have you taken them? How often?
2. Barriers to fruit and vegetable consumption
• What affects the frequency of acquiring such fruits and vegetables (e.g. price, season, etc)? What’s about other family members whether they can get fruits and vegetables from other sources [apart from the family provision]?
• Where do/can you normally access fruits and vegetables?
3. Perceived benefits
• Do you realize/know the benefits of eating fruit and vegetables? In what aspects (e.g. health, environment)?
4. Access to knowledge
• How do you know about [benefits of] fruits and vegetables (by what means)?
5. Tactics to promote greater consumption
• What could be factors influencing you/people eat more or sufficient fruits and vegetables?
In formulating question lists for focus group interviews, a full list of
questions was built upon the opinion or attitude concepts, attached with field
notes. Due to body of evidence in this field available in English, all questions
were primarily created in English and then translated into Thai for pretest
and actual conduct (see Table 3.4). Prudent attention had been paid to the clarity of words, phases and sentences. By the researcher of this study and a policy expert in areas of policy formulation, back-translation was performed for assuring meaning precision (Esposito 2001, Winslow et al. 2002). Pretest was only rendered with respondents in Thai settings.
Pretest was used to obtain insights about audient reactions towards messages or words probed. A group of 7 participants, employees working in the Ministry of Public Health and residing in the urban areas, i.e. Bangkok Metropolitan, were recruited to the pre-test session. The interview session was conducted in a meeting room in Bureau of Policy and Strategy, Ministry of Public Health, and lasted 45 minutes. A flip chart was used to carry all the key discussion points and summarize main issues during and at the end of the session. All crucial issues from the pretest were used to adjust the question lists and probing strategies before performing the actual study.
Qualitative studies essentially involve only a small number of participants by reason of their focus on detail and depth of information (MacDougall and Fudge 2001). To confer a best representation, each province from each region was selected on the basis of GDP, population density and urban being defined by the Thailand’s Ministry of Interior. Recruitment for focus groups applied purposive sampling through contact with Provincial Health Offices, as well as the University Faculties, i.e. Payap College of Business and Sciences, and Mahidol University in the designated provinces.
This, finally, led to focus groups of six to nine voluntary urban residents of general public at each site in 4 geographic areas of the Kingdom of Thailand;
that is, Chiang Mai (North), Khon Khen (Northeast), Samut Sakorn (Central),
Song Khla (South), and one Metropolitan: Bangkok.
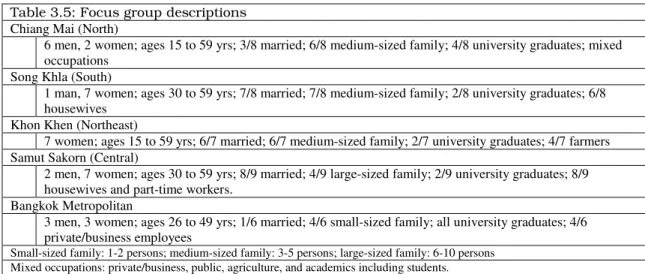
There were five focus groups involving 38 mixes of male and female participants aged between 15 and 59, except for Khon Khen province where only females participated. The focus groups’ descriptions were outlined in Table 3.5, together with some of the demographic characteristics of each group.
Table 3.5: Focus group descriptions Chiang Mai (North)
6 men, 2 women; ages 15 to 59 yrs; 3/8 married; 6/8 medium-sized family; 4/8 university graduates; mixed occupations
Song Khla (South)
1 man, 7 women; ages 30 to 59 yrs; 7/8 married; 7/8 medium-sized family; 2/8 university graduates; 6/8 housewives
Khon Khen (Northeast)
7 women; ages 15 to 59 yrs; 6/7 married; 6/7 medium-sized family; 2/7 university graduates; 4/7 farmers Samut Sakorn (Central)
2 men, 7 women; ages 30 to 59 yrs; 8/9 married; 4/9 large-sized family; 2/9 university graduates; 8/9 housewives and part-time workers.
Bangkok Metropolitan
3 men, 3 women; ages 26 to 49 yrs; 1/6 married; 4/6 small-sized family; all university graduates; 4/6 private/business employees
Small-sized family: 1-2 persons; medium-sized family: 3-5 persons; large-sized family: 6-10 persons Mixed occupations: private/business, public, agriculture, and academics including students.
3.4.2 Conducting focus group interviews
Focus groups were carried out in Thai language. Each group was held in a room provided by the key contacts or facilitators in the designated provinces.
Focus group interviews were conducted between September 15 and October
20, 2005. At the site, the conduct was held in a round-table format. The
content of the focus group discussions was related to participants’ perception
to fruit and vegetable consumption, as well as associated key issues. The
participants sat together with the principal investigator and a facilitator in a
circular shape facing to each other. At the beginning of each session,
participants individually completed a half-page questionnaire on their socio-
demographic characteristics; namely, age, sex, education level, family status,
number of household/family members. In addition, an MP3/WMA
player
3used to record during the interviews was notified to the participants to be aware that the provided information was recorded and treated in confidence. Sessions lasted approximately between 70 and 110 minutes and were wholly audio-recorded.
The focus group team comprised the principal investigator, who worked as a group moderator. A focus group facilitator was recruited from the local area at the site; namely, through the contacted provincial health office. As recommended by the key contact, the facilitators had a former good experience in focus group techniques facilitating communications rendered in the group. One or two assistants were also recruited and trained to help in the interview sessions, such as recording, and note taking after the session were finished.
During the group dialogue discussions, the principal investigator posed the questions and managed the conversations while the facilitator, as well as recruited assistants, took notes and, on some occasions, helped translate the discourse into local dialect, especially in the northeastern and southern regions where dialects were relatively strong. At the end of the session, the principle investigator wrote up an on-the-site summary, which was enhanced using field notes taken by a designated on-site facilitator and field assistants.
With such, in each site the research team had a track-record, field note takings and an on-the-site summary. Later, the audio-tracks, as well as the written on-the-site summaries originally in Thai language were translated and transcribed into English.
3