Emotion dynamics and
tinnitus: Daily life data from the
“TrackYourTinnitus” application
Thomas Probst1,2, Rüdiger Pryss3, Berthold Langguth4 & Winfried Schlee4
It is well established that emotions influence tinnitus, but the role of emotion dynamics remains unclear. The present study investigated emotion dynamics in N = 306 users of the “TrackYourTinnitus”
application who completed the Mini-Tinnitus Questionnaire (Mini-TQ) at one assessment point and provided complete data on at least five assessment points for the following state variables: tinnitus loudness, tinnitus distress, arousal, valence. The repeated arousal and valence ratings were used for two operationalizations of emotion dynamics: intra-individual variability of affect intensity (pulse) as well as intra-individual variability of affect quality (spin). Pearson correlation coefficients showed that the Mini-TQ was positively correlated with pulse (r = 0.19; p < 0.05) as well as with spin (r = 0.12;
p < 0.05). Multilevel models revealed the following results: increases in tinnitus loudness were more strongly associated with increases in tinnitus distress at higher levels of pulse as well as at higher levels of spin (both p < 0.05), whereby increases in tinnitus loudness correlated even stronger with increases in tinnitus distress when both pulse as well as spin were high (p < 0.05). Moreover, increases in spin were associated with a less favorable time course of tinnitus loudness (p < 0.05). To conclude, equilibrating emotion dynamics might be a potential target in the prevention and treatment of tinnitus.
Tinnitus, the perception of sound in the absence of a corresponding physical sound source, has prevalence rates ranging from 2 to 26%1–4 and the prevalence rates appear to increase over time5. The social and economic costs of tinnitus are enormous. In the Netherlands, for example, the societal costs were estimated to amount to €6.8 billion with €1.9 billion related to health care costs6. Costs were found to be even higher in tinnitus patients with depression6. Depression is frequent among tinnitus patients7 and is stronger associated with tinnitus distress than with tinnitus loudness8. Loudness and distress are two components of tinnitus processed in different but inter- connected brain networks9,10. The results that different variables (e. g., depression, brain networks) are differently associated with tinnitus loudness and tinnitus distress fit to the moderate statistical correlations between these two tinnitus components (r = 0.45–0.52) found in large surveys8,11. A deeper understanding of the psychological processes that put patients at-risk of being distressed by the sensation of tinnitus loudness is of utmost impor- tance as it may provide a framework for the development of specific therapeutic interventions12. Moderation and mediation analyses are promising statistical methods to identify psychological and psychopathological mecha- nisms underlying the loudness-distress relationship. Weise and colleagues analyzed whether depressed mood, anxiety, and tinnitus acceptance mediate the relationship between tinnitus loudness and tinnitus distress13. They found that anxiety and tinnitus acceptance explain a significant proportion of the effect tinnitus loudness exerts on tinnitus distress. Depressed mood, however, had no significant mediating effect in their study. This is in con- trast to the result that “not feeling low/depressed” was strongly associated with low distress despite high loudness in a large survey11. A recent study used ecological momentary assessments of the “TrackYourTinnitus” smart- phone application and found that the emotional state “stress” and the two components of emotional states–“va- lence” and “arousal”–mediate the loudness-distress relationship14. Variations of emotional states were also shown to be associated with tinnitus onset and cochlear sensitivity in another study15. Although this highlights the role of emotional states in tinnitus, it remains unclear how an individual’s tinnitus is related to her/his emotion dynamics (i. e., variability of emotional states over time16,17). Despite the high relevance of emotion dynamics (see for example the special section in Emotion Review17), psychopathology research and behavioral science in general
1Department of Psychology, Regensburg University, Germany. 2Department of Psychology and Psychotherapy, Witten/Herdecke University, Germany. 3Institute of Databases and Information System, Ulm University, Germany.
Received: 03 March 2016 accepted: 13 July 2016 Published: 04 August 2016
OPEN
have for a long time neglected dynamic emotional processes because traditional assessment approaches are not well suited to capture dynamic processes18. Newer technologies such as smartphone-based applications that allow ambulatory assessments are promising methods to overcome these historical limitations18. One example is the
“TrackYourTinnitus” (TYT) smartphone application that was used in the study at hand in ecologically valid envi- ronments to explore interactions between two dynamic intra-individual processes, emotion dynamics16,17 and tinnitus19–21. The following three research questions were addressed with the TYT daily life data. First, whether emotion dynamics are associated with tinnitus-related psychological problems. Second, whether emotion dynam- ics moderate the effect current tinnitus loudness exerts on current tinnitus distress. The third research question addressed whether emotion dynamics affect the time course of tinnitus. Identifying factors that contribute to a more positive or more negative prognosis of tinnitus is important to develop preventive and therapeutic strate- gies. Although previous studies already explored psychological factors influencing the time course of tinnitus22–24, these studies focused on treatment-seeking patients, did not use ecological momentary assessments, and did not take emotion dynamics into consideration. In the current study, we had the following three directed hypotheses, since previous research found positive associations between emotion dynamics and psychopathology16. (1) Emotion dynamics are positively correlated with tinnitus-related psychological problems.
(2) Emotion dynamics moderate the effect of tinnitus loudness on tinnitus distress in a way that tinnitus loudness affects tinnitus distress more strongly in tinnitus sufferers with more emotion dynamics.
(3) Increased emotion dynamics are associated with a less favorable time course of tinnitus.
Methods
The material and the methods were approved by the Ethics Committee of the University Clinic of Regensburg and were carried out in accordance with the approved guidelines. Information that the TYT data will be used for scientific analyses is included in the mobile applications of the “TrackYourTinnitus” as well as on the
“TrackYourTinnitus” website and, therefore, the TYT users were informed that the data will be used for scientific purposes. Written consent, however, was not possible to obtain given the nature of the study.
Material. Self-Assessment Manikin (SAM). The SAM25 assesses three components shown to be relevant for the measurement of emotions: 1) arousal, 2) valence, and 3) dominance. In this study, only the arousal and valence components were included to operationalize emotion dynamics (see below). Arousal and valence are con- sidered the two components of emotional states in the circumplex of affect26. The component arousal describes the emotional state on a continuum between calm and excitement, whereas the component valence describes the emotional state on an evaluative continuum varying from positive to negative. In the SAM, higher arousal ratings reflect a more excited emotional state, whereas higher valence ratings indicate a more positive emotional state.
In the current study, the TYT users completed the arousal and valence ratings repeatedly at different time points during their daily life.
Mini-Tinnitus Questionnaire (Mini-TQ). The Mini-TQ27 is a psychometrically sound self-report questionnaire comprising 12 items to rapidly measure tinnitus-related psychological distress. The items are rated on a 3-point Likert-scale and the sum of these 12 items represents the global scale. Higher values indicate more tinnitus-related psychological distress on the items as well as on the global scale. The Mini-TQ is a valid instrument that corre- lates strongly with the full TQ (r > 0.90) and has a high test-retest reliability (r = 0.89). The use of the following cut-off scores was recommended by Hiller and Goebel27: 0–7 = no clinically relevant distress due to the tinnitus;
8–12 = moderately distressed; 13–18 = severely distressed; 19–24 = most severely distressed. In the present study, the Mini-TQ was assessed once per user during the TYT registration process and only those TYT users who completed all 12 items were analyzed.
“TrackYourTinnitus” platform. The TYT platform (www.trackyourtinnitus.org)28 comprises a website for regis- tration, two mobile applications (for iOS and Android), and a SQL database for the central storage of the collected data. During the registration process, the users are asked to fill out several questionnaires (e. g., the Mini-TQ).
After the registration process is finished, the users receive notifications in their daily life to provide “state assess- ments” that relate to the current moment (see below). In the “standard settings”, these notifications appear on a random basis between 8 a.m. and 10 p.m. In the “custom” settings, however, the users can define their individual schedule. Every time a notification appears, the users were asked to give the following “state assessments”: 1) con- scious perception of tinnitus at this moment (subjective rating: yes/no), 2) current tinnitus loudness (subjective rating of current tinnitus loudness on a visual analogue scale, VAS, including a zero value for moments without loudness), 3) current tinnitus distress (subjective rating of current tinnitus distress on a VAS including a zero value for moments without distress), 4) current emotional valence (SAM), 5) current emotional arousal (SAM), 6) current stress level (subjective rating of current stress level on a VAS), 7) current level of concentration (subjec- tive rating of current concentration on a VAS), and 8) an individualized question reflecting the current status of the symptom the user rated to be her/his worst during the registration process. While giving these “state assess- ments”, the background sound level is measured using the built-in microphone of the smartphone (users could disable this function in the settings). Of all the variables measured by the TYT, only tinnitus loudness, tinnitus distress, valence, arousal, and the Mini-TQ were statistically analyzed in the present study. The data set used for the current study was exported in February 2016.
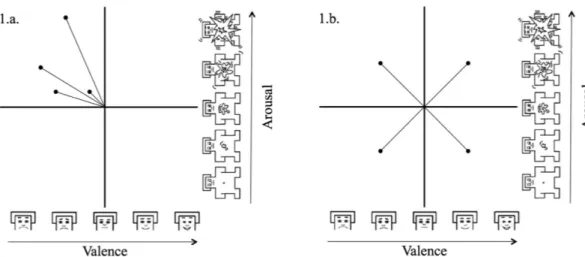
Operationalization of emotion dynamics. Various operationalizations of emotion dynamics were sug- gested in the research literature16,29. The study at hand used a relatively new approach to define emotion dynamics that was introduced by Kuppens and colleagues30. Building on the work of Moskowitz, and Zuroff 31, they pro- posed two intra-individual measures of emotion dynamics depending on how an individual moves within the circumplex of affect that is defined by the dimensions arousal and valence26. Using repeated arousal and valence ratings of one individual, “variability of affect intensity” (pulse, see Fig. 1) as well as “variability of affect quality”
(spin, see Fig. 1) can be calculated for this given individual30. While pulse defines the degree of variation between experiencing more or less intensive affect, spin reflects the degree of variation between different directions in the affective circumplex. As such, spin operationalizes the extent of qualitatively different feelings regardless of their intensity, whereas pulse stands for the extent how feelings differ in their intensity regardless of the quality of the affective circumplex (i.e., higher or lower valence, higher or lower arousal).
A detailed description for the statistical calculation of pulse and spin can be found in the relevant literature30,32. Statistical analyses. The statistical analyses were performed with SPSS 23.
Means (M), standard deviations (SD), frequencies (n), and percentages (%) were calculated for the sample description.
Pearson’s correlation coefficients were calculated between the Mini-TQ and the intra-individual pulse as well as between the Mini-TQ and the intra-individual spin. Pulse and spin were correlated with the Mini-TQ global scale as well as with each of the 12 Mini-TQ items to investigate our first research question (i. e., whether emotion dynamics are associated with tinnitus-related psychological problems).
To address the second research question (i. e., whether emotion dynamics moderate the effect of tinnitus loudness on tinnitus distress), a multilevel model was performed. The multilevel model included two levels: “state assessments” as level-1 nested within TYT users as level-2. Current tinnitus distress was the dependent variable and current tinnitus loudness was entered as time-varying level-1 covariate. The z-standardized pulse and the z-standardized spin were added as time-invariant level-2 covariates. Regarding the fixed effects, all main and interaction effects were analyzed. The full maximum-likelihood method was used and the intercept was allowed to vary randomly (random intercept model). A moderation model was applied instead of a mediation model for this research question, because, in a mediation model, current tinnitus loudness would function as the antecedent of the potential mediator emotion dynamics which in turn would be expected to influence the outcome varia- ble current tinnitus distress. This appeared inappropriate for the current analysis, since emotion dynamics were operationalized on the user-level (level-2) in the study at hand (the repeated arousal and valence assessments of a TYT user were used to calculate one pulse value and one spin value per user; see “operationalization of emotion dynamics”), whereas current tinnitus loudness as well as current tinnitus distress were measured repeatedly on the assessment-level (level-1), which was nested within the user-level.
For the third research question (i. e., whether emotion dynamics are relevant for the time course of tinnitus), two multilevel models were performed. The multilevel models again included two levels: “state assessments” as level-1 nested within TYT users as level-2. One of these multilevel models evaluated the effect of emotion dynam- ics on the time course of current tinnitus distress. Therefore, current tinnitus distress was entered as dependent variable, the measurement point of the “state assessment” (set equal to 0 at the first assessment: 0, 1, 2, … ) was added as predictor (time course; “slope”) and the z-standardized pulse as well as the z-standardized spin were entered as time-invariant level-2 covariates. The other multilevel model explored the effect of emotion dynamics on the time course of current tinnitus loudness. Hence, current tinnitus loudness was the dependent variable, the measurement point of the “state assessment” (set equal to 0 at the first assessment: 0, 1, 2, … ) was the predictor (time course; “slope”), and the z-standardized pulse as well as the z-standardized spin were level-2 covariates.
Figure 1. 1.a. pulse (affect intensity variability) and 1.b. spin (affect quality variability) according to Kuppens and colleagues30. Valence and arousal manikins modified from M. M. Bradley, & P. J. Lang, Measuring emotion: the self-assessment manikin and the semantic differential, Journal of Behavior Therapy and Experimental Psychiatry, 25, 49–59, Elsevier, 199425.
the slope were allowed to vary randomly (random intercept random slope models). For the random effects, an unstructured variance-covariance matrix was selected. For the fixed effects, all main and interaction effects were investigated.
All statistical analyses were performed two-tailed, no statistical corrections for multiple tests were applied, and the significance value was set to p ≤ 0.05.
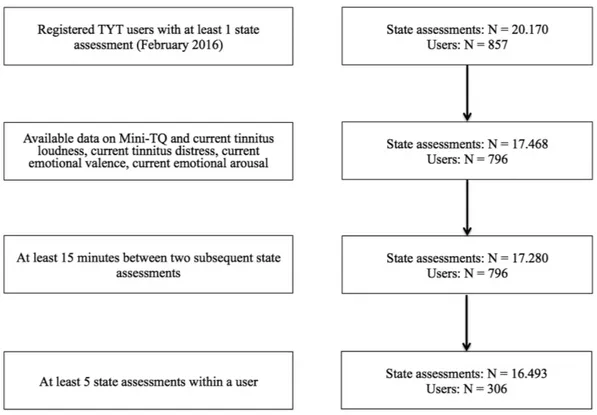
Participants. To investigate our research questions, the following three exclusion criteria were applied to select the sample for the statistical analyses: 1) assessments with a missing value on any of the statistically ana- lyzed variables were excluded. Hence, all users not completing all 12 items of the Mini-TQ were excluded as well as all users not providing a “state assessment” with complete data on tinnitus loudness, tinnitus distress, valence, and arousal. This criterion was applied to have the same sample for the research questions. 2) Every “state assessment” given within a 15 minutes time interval following the previous “state assessment” was excluded. This criterion ensured that there are at least 15 minutes between two assessments as intended in the TYT28. 3) Users with less than five “state assessments” were excluded. We determined for this study that at least five observations of the state variables are necessary within a user to meaningfully operationalize her/his intra-individual emotion dynamics (i. e., pulse and spin). It should be kept in mind, however, that the effect of pulse and spin on tinnitus could be more or less strong when using a sample that would result from a different minimum of “state assess- ments” (e. g., four or six).
After the criteria 1–3) were applied, N = 306 tinnitus sufferers of the TYT platform remained available for the statistical analyses. They provided 16.493 “state assessments”. Figure 2 illustrates how many assessments and how many TYT users had to be excluded due to each of the above described exclusion criteria. It can be seen that most of the users had to be excluded because they provided less than five “state assessments” (i. e., due to criterion 3).
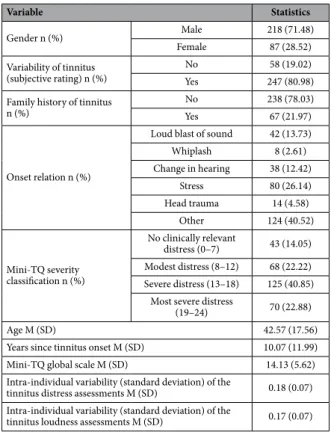
The sample description of the TYT users included in this study is shown in Table 1.
Results
The N = 306 TYT users included in this study provided on average M = 54 “state assessments” (SD = 99). The mean time interval between the users’ first and last assessment point amounted to M = 2 months (SD = 3; range:
min = 8 hours; max = 19 months). Across all “state assessments”, the average time interval between one “state assessment” and the subsequent “state assessment” amounted to M = 29 hours (SD = 230; range: min = 15 min;
max = 9930 hours). Regarding emotion dynamics, the average pulse was M = 0.12 (SD = 0.04) and the average spin amounted to M = 0.80 (SD = 0.48).
Table 2 shows the results for research question 1, the correlations between tinnitus-related psychological problems measured with the Mini-TQ and intra-individual pulse as well as intra-individual spin. The correla- tional analyses revealed very low to low but statistically significant positive correlations between tinnitus-related Figure 2. Flow-chart illustrating the amount of excluded “state assessments” and TYT users. TYT = “Track Your Tinnitus” application; Mini-TQ = Mini-Tinnitus Questionnaire.
psychological problems and pulse (r = 0.19; p < 0.05) and spin (r = 0.12; p < 0.05), respectively. On the item-level of the Mini-TQ, more significant correlations emerged for pulse than for spin (8 vs. 2).
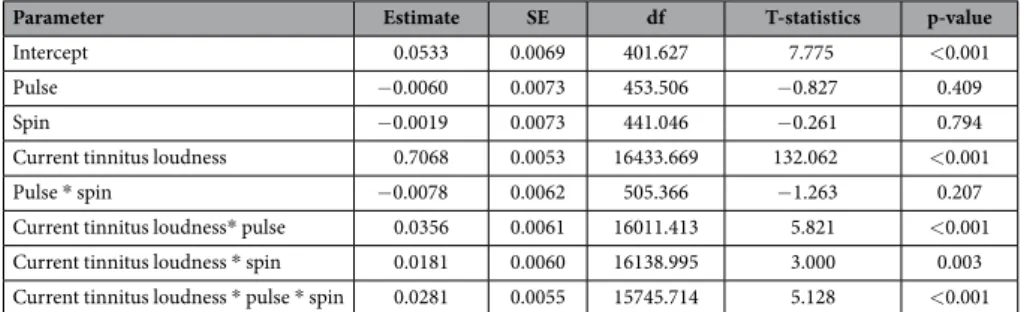
The fixed effects of the multilevel model addressing research question 2 are displayed in Table 3 (the results of the random effects are in the supplementary material). It can be seen that pulse as well as spin both moderated the effect of tinnitus loudness on tinnitus distress independently from each other: increases in tinnitus loudness correlated significantly stronger with increases in tinnitus distress at higher levels of pulse when statistically hold- ing spin constant (γ = 0.0356; p < 0.01) as well as at higher levels of spin when statistically controlling for pulse (γ = 0.0181; p = 0.01). Compared to these independent effects, increases in tinnitus loudness were even more strongly associated with increases in tinnitus distress when both, pulse and spin, increased (γ = 0.0281; p < 0.01).
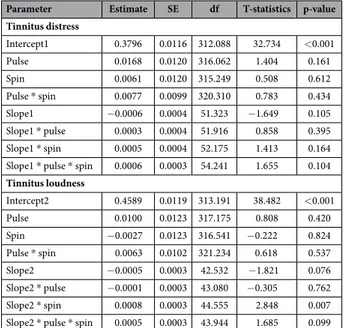
The fixed effects of the two multilevel models that were performed in the context of research question 3 are presented in Table 4 (see the supplementary material for the results of the random effects). Table 4 shows that neither pulse nor spin had a significant effect on the time course of tinnitus distress. The time course of tinnitus loudness, however, was significantly influenced by spin (γ = 0.0008; p < 0.01). That means, the higher the affect quality variability, the more the tinnitus loudness increased over time.
Discussion
This study investigated associations between emotion dynamics and tinnitus in the daily life of tinnitus sufferers using the “TrackYourTinnitus” (TYT) smartphone application. The TYT users received random notifications in their daily life to fill out questionnaires on current tinnitus and current emotions via their mobile phone.
Although the attention is directed towards the tinnitus by such notifications, Henry and colleagues could show that the tinnitus does not deteriorate when tinnitus patients receive notifications to assess tinnitus-related and emotional variables in daily life19. In the study at hand, emotion dynamics were operationalized by two concepts introduced by Kuppens and co-workers: intra-individual pulse and intra-individual spin. While pulse reflects variability of affect intensity, spin stands for variability of affect quality30.
We found that pulse as well as spin are positively correlated with tinnitus-related psychological problems (Mini-TQ) and that pulse as well as spin moderate the effect of tinnitus loudness on tinnitus distress: increases in tinnitus loudness were more strongly associated with increases in tinnitus distress at higher levels of pulse as well as at higher levels of spin, whereby higher pulse in combination with higher spin was most detrimental regarding the loudness-distress relationship. In other words: patients who experience both affect intensity variability and affect quality variability are more severely distressed when tinnitus loudness increases than patients showing either variability of affect intensity or variability of affect quality, whereas patients without emotion dynamics are those with the lowest distress levels related to tinnitus loudness. Another result indicates that higher spin was associated with a less favorable time course of tinnitus loudness, i. e., tinnitus loudness increased over time in patients experiencing more qualitatively different emotions (e. g., sadness, anger, happiness, relaxation). Our results fit to the finding of a recent meta-analysis that emotion dynamics are negatively correlated with psycho-
Variable Statistics
Gender n (%) Male 218 (71.48)
Female 87 (28.52)
Variability of tinnitus (subjective rating) n (%)
No 58 (19.02)
Yes 247 (80.98)
Family history of tinnitus n (%)
No 238 (78.03)
Yes 67 (21.97)
Onset relation n (%)
Loud blast of sound 42 (13.73)
Whiplash 8 (2.61)
Change in hearing 38 (12.42)
Stress 80 (26.14)
Head trauma 14 (4.58)
Other 124 (40.52)
Mini-TQ severity classification n (%)
No clinically relevant
distress (0–7) 43 (14.05) Modest distress (8–12) 68 (22.22) Severe distress (13–18) 125 (40.85)
Most severe distress
(19–24) 70 (22.88)
Age M (SD) 42.57 (17.56)
Years since tinnitus onset M (SD) 10.07 (11.99)
Mini-TQ global scale M (SD) 14.13 (5.62)
Intra-individual variability (standard deviation) of the
tinnitus distress assessments M (SD) 0.18 (0.07) Intra-individual variability (standard deviation) of the
tinnitus loudness assessments M (SD) 0.17 (0.07)
Table 1. Sample description. Note: M = Mean; SD = Standard Deviation.
dynamics and psychological well-being were found in the meta-analysis16, only very low to low correlations between emotion dynamics and tinnitus-related psychological distress emerged in the present study. The lower correlations could be at least partially attributed to the fact that our tinnitus sample might be quite healthy with regard to psychopathologies because we recruited via a smartphone application and, thus, the sample consisted not only of treatment seeking patients. Adding screenings for depression, anxiety, and other mental health prob- lems to the TYT would allow a more detailed investigation of the psychopathological characteristics. However, administering too many questionnaires could limit the usability of the app in daily life. Therefore, at the time of the current study, only the Mini-TQ is integrated in the TYT as a measure of tinnitus-related psychological problems and only 14% of the investigated app users reported no clinically relevant psychological distress (see Table 1). This indicates that psychological problems are common even among tinnitus sufferers recruited via a smartphone app.
Because no study has yet investigated associations between emotion dynamics and tinnitus distress, our results can only be embedded in research on correlations between emotion dynamics and other psychopatholo- gies. We focus thereby on depression and neuroticism, since these dimensions were shown to be relevant in tin- nitus3,7,33,34 and were analyzed in previous studies with students (n = 58/12730; n = 6335) that also used pulse and spin as measures of emotion dynamics. These previous studies could have selected university students to obtain a population of different personality traits and psychological adjustment abilities. One of these studies found a sig- nificant medium correlation between spin and depression (r = 0.49) but no significant association between pulse and depression emerged (r = − 0.17)30. Both studies reported correlations between spin and neuroticism (r = 0.20
Mini-TQ Pulse r Spin r
Global scale 0.192 (p = 0.001) 0.120 (p = 0.035)
Item 1: I am aware of the noises from the
moment I get up to the moment I sleep 0.057 (p = 0.320) 0.044 (p = 0.447) Item 2: Because of the noises I worry that there
is something seriously wrong with my body 0.140 (p = 0.014) 0.065 (p = 0.259) Item 3: If the noises continue my life will not
be worth living 0.080 (p = 0.164) 0.006 (p = 0.919)
Item 4: I am more irritable with my family and
friends because of the noises 0.092 (p = 0.109) 0.091 (p = 0.113) Item 5: I worry that the noises might damage
my physical health 0.119 (p = 0.037) 0.112 (p = 0.050) Item 6: I find it harder to relax because of the
noises 0.130 (p = 0.023) 0.118 (p = 0.038)
Item 7: My noises are often so bad that I cannot
ignore them 0.117 (p = 0.041) 0.071 (p = 0.212)
Item 8: It takes me longer to get to sleep
because of the noises 0.110 (p = 0.054) 0.075 (p = 0.193) Item 9: I am more liable to feel low because of
the noises 0.157 (p = 0.006) 0.053 (p = 0.360)
Item 10: I often think about whether the noises
will ever go away 0.134 (p = 0.019) 0.083 (p = 0.149)
Item 11: I am a victim of my noises 0.190 (p = 0.001) 0.108 (p = 0.059) Item 12: The noises have affected my
concentration 0.143 (p = 0.013) 0.099 (p = 0.085)
Table 2. Correlations between emotion dynamics (pulse and spin) and tinnitus-related psychological distress measured with the Mini-Tinnitus-Questionnaire (Mini-TQ). Note: r = Pearson correlation coefficient.
Parameter Estimate SE df T-statistics p-value
Intercept 0.0533 0.0069 401.627 7.775 < 0.001
Pulse − 0.0060 0.0073 453.506 − 0.827 0.409
Spin − 0.0019 0.0073 441.046 − 0.261 0.794
Current tinnitus loudness 0.7068 0.0053 16433.669 132.062 < 0.001
Pulse * spin − 0.0078 0.0062 505.366 − 1.263 0.207
Current tinnitus loudness* pulse 0.0356 0.0061 16011.413 5.821 < 0.001
Current tinnitus loudness * spin 0.0181 0.0060 16138.995 3.000 0.003
Current tinnitus loudness * pulse * spin 0.0281 0.0055 15745.714 5.128 < 0.001
Table 3. Fixed effects of the multilevel model investigating pulse and spin as moderators of the relationship between current tinnitus loudness on current tinnitus distress. Note: Intercept = Current tinnitus distress when statistically controlling for pulse, spin and current tinnitus loudness; SE = Standard Error;
df = degrees of freedom. Pulse and spin were z-standardized on level-2 for this analysis. See the supplementary material for the random effects.
to 0.37) as well as between pulse and neuroticism (r = − 0.13 to r = 0.11)30,35. While the correlations between pulse and depression as well as neuroticism did not attain statistical significance in the cited studies, pulse was signif- icantly associated with tinnitus-related psychological problems in the study at hand and pulse even correlated with more items of the Mini-TQ (used to measure tinnitus-related psychological problems) than spin. Pulse and spin, therefore, could be differentially relevant depending on the sample (e. g., students vs. tinnitus patients) or the clinical phenomenon (e. g., depression vs. tinnitus distress) under investigation. In this context, the already cited meta-analysis failed to find relevant differences regarding the effect of emotion dynamics on psychological well-being when clinical and non-clinical samples were compared16. Furthermore, this meta-analysis revealed only subtle differences between specific kinds of psychopathologies16. However, the research question whether pulse and spin are differentially associated with different psychopathologies has not yet been scrutinized and needs to be addressed in future research.
Moreover, it is crucial to determine whether emotion dynamics are causes of psychopathologies or vice versa16. The lack of causality can be seen as a limitation of the present study: emotion dynamics could lead to tinnitus loudness/tinnitus distress or tinnitus loudness/tinnitus distress could be causes of emotion dynamics.
Although our results do not allow drawing causal inferences, they could implicate that targeting emotion dynam- ics might be an option in the prevention and treatment of tinnitus. However, it should be kept in mind that emotional inertia (experiencing more self-predictive emotions) should not be the aim of these interventions, because higher emotional inertia has been shown to be associated with lower psychological well-being16. When targeting emotion dynamics, one should try to achieve “an adaptive pattern of emotional change characterized by emotions that have less extreme deviations from their mean level (located around 0) and make smaller con- secutive jumps from one point to the next, but at the same time are not very self-predictive, as evidenced by less lingering emotions around the same intensity levels and a strong homeostasis toward a baseline level”16 page 922. Besides the lack of causality, the fact that our results rely solely on self-ratings can be considered as a further limi- tation of this study. In addition to self-ratings future research might use affect detection systems that could rely on brain activity, physiology, speech, face and body language36 for a broader operationalization of emotion dynam- ics. Moreover, psychophysiological measurements of tinnitus loudness such as tinnitus-matching tests could be applied for complementary assessments of tinnitus loudness, even if the reliability and validity of these measures of tinnitus loudness is an ongoing matter of debate37,38. Tinnitus loudness is usually measured quantitatively on a low-high dimension; a recent study, however, provided evidence that the quality of the tinnitus loudness sen- sation should also be taken into account. Moring and colleagues found that tinnitus sufferers with a specific type of tinnitus loudness sensation (e. g., ringing, buzzing, hissing, or whooshing) show less functional impairment and less avoidant behavior than tinnitus sufferers with a combination of different types of tinnitus loudness sen- sations39. Therefore, emotional variables such as emotional states and emotion dynamics could be differentially relevant in the loudness-distress relationship depending on the type of tinnitus loudness sensation(s). Due to the fact that each user can provide “state assessments” in the TYT whenever he/she wants to, the range of the time
Parameter Estimate SE df T-statistics p-value
Tinnitus distress
Intercept1 0.3796 0.0116 312.088 32.734 < 0.001
Pulse 0.0168 0.0120 316.062 1.404 0.161
Spin 0.0061 0.0120 315.249 0.508 0.612
Pulse * spin 0.0077 0.0099 320.310 0.783 0.434
Slope1 − 0.0006 0.0004 51.323 − 1.649 0.105
Slope1 * pulse 0.0003 0.0004 51.916 0.858 0.395
Slope1 * spin 0.0005 0.0004 52.175 1.413 0.164
Slope1 * pulse * spin 0.0006 0.0003 54.241 1.655 0.104 Tinnitus loudness
Intercept2 0.4589 0.0119 313.191 38.482 < 0.001
Pulse 0.0100 0.0123 317.175 0.808 0.420
Spin − 0.0027 0.0123 316.541 − 0.222 0.824
Pulse * spin 0.0063 0.0102 321.234 0.618 0.537
Slope2 − 0.0005 0.0003 42.532 − 1.821 0.076
Slope2 * pulse − 0.0001 0.0003 43.080 − 0.305 0.762
Slope2 * spin 0.0008 0.0003 44.555 2.848 0.007
Slope2 * pulse * spin 0.0005 0.0003 43.944 1.685 0.099
Table 4. Fixed effects of the multilevel models on the effects of pulse and spin on the time course of tinnitus. Note: Intercept1 = Current tinnitus distress at the first “state assessment” when statistically controlling for pulse and spin; Intercept2 = Current tinnitus loudness at the first “state assessment” when statistically controlling for pulse and spin; Slope1 = Changes of current tinnitus distress over time when statistically controlling for pulse and spin; Slope2 = Changes of current tinnitus loudness over time when statistically controlling for pulse and spin; SE = Standard Error; df = degrees of freedom. Pulse and spin were z-standardized on level-2 for these analyses. See the supplementary material for the random effects.
protocol (e. g., event-contingent or time-contingent) can be seen as another shortcoming of our study. Finally, a main shortcoming of the study at hand is that–as with any online data collection–the robustness/accuracy of the data is difficult to verify. Recent technical developments involving sophisticated plausibility checks for testing data quality might be promising in this context.
Despite these limitations, the study has also several strengths: using pulse and spin instead of a single-dimension measure has been considered to capture the essence of emotion dynamics30. Moreover, ecological momentary assessments by a smartphone application provide results of high ecological validity. Scientifically sound mobile health apps have recently been discussed as innovative and promising research strategies in clinical science40,41.
In summary, we provide first evidence that higher emotion dynamics are associated with more tinnitus-related psychological distress in daily life, that emotion dynamics put tinnitus sufferers at risk of being more distressed by the tinnitus loudness, and that qualitative emotion dynamics are correlated with a less favorable time course of tinnitus loudness. The questions whether equilibrating emotion dynamics can enrich the prevention and treat- ment of tinnitus or whether equilibrating emotion dynamics is a potential change mechanism in the treatment of tinnitus needs to be evaluated in future clinical studies.
References
1. Shargorodsky, J., Curhan, G. C. & Farwell, W. R. Prevalence and characteristics of tinnitus among US adults. Am. J. Med. 123, 711–718, doi: 10.1016/j.amjmed.2010.02.015 (2010).
2. Møller, A. R. Epidemiology of tinnitus in adults in Textbook of Tinnitus (eds. Møller, A. R., Langguth, B., De Ridder, D. & Kleinjung, T.) 29–37 (Springer, 2011).
3. McCormack, A. et al. The prevalence of tinnitus and the relationship with neuroticism in a middle-aged UK population. Psychosom.
Res. 76, 56–60, doi: 10.1016/j.jpsychores.2013.08.018 (2014).
4. Gallus, S. et al. Prevalence and determinants of tinnitus in the Italian adult population. Neuroepidemiology 45, 12–19, doi:
10.1159/000431376 (2015).
5. Nondahl, D. M. et al. Generational differences in the reporting of tinnitus. Ear. Hear. 33, 640–644, doi: 10.1097/AUD.0b013e31825069e8 (2012).
6. Maes, I. H., Cima, R. F., Vlaeyen, J. W., Anteunis, L. J. & Joore, M. A. Tinnitus: A cost study. Ear. Hear. 34, 508–514, doi: 10.1097/
AUD.0b013e31827d113a (2013).
7. Langguth, B., Landgrebe, M., Kleinjung, T., Sand, G. P. & Hajak, G. Tinnitus and depression. World J. Biol. Psychiatry 7, 489–500, doi: 10.3109/15622975.2011.575178 (2011).
8. Wallhäusser-Franke, E. et al. Tinnitus: Distinguishing between subjectively perceived loudness and tinnitus-related distress. PLoS One 7, e34583, doi: 10.1371/journal.pone.0034583 (2012).
9. De Ridder, D., Elgoyhen, A. B., Romo, R. & Langguth, B. Phantom percepts: Tinnitus and pain as persisting aversive memory networks. Proc. Natl. Acad. Sci. USA 108, 8075–8080, doi: 10.1073/pnas.1018466108 (2011).
10. Vanneste, S., Congedo, M. & De Ridder, D. Pinpointing a highly specific pathological functional connection that turns phantom sound into distress. Cereb. Cortex 24, 2268–2282, doi: 10.1093/cercor/bht068 (2014).
11. Hiller, W. & Goebel, G. When tinnitus loudness and annoyance are discrepant: Audiological characteristics and psychological profile. Audiol. Neurootol. 12, 391–400, doi: 10.1159/000106482 (2007).
12. McKenna, L., Handscom, L., Hoare, D. J. & Hall, D. A. A scientific cognitive-behavioral model of tinnitus: Novel conceptualizations of tinnitus distress. Front. Neurol. 5, 196, doi: 10.3389/fneur.2014.00196 (2014).
13. Weise, C., Kleinstäuber, M., Hesser, H., Westin, V. Z. & Andersson, G. Acceptance of tinnitus: Validation of the tinnitus acceptance questionnaire. Cogn. Behav. Ther. 42, 100–115, doi: 10.1080/16506073.2013.781670 (2013).
14. Probst, T., Pryss, R., Langguth, B. & Schlee, W. Emotional states as mediators between tinnitus loudness and tinnitus distress in daily life: Results from the “TrackYourTinnitus” application. Sci. Rep. 6: 20382, doi: 10.1038/srep20382 (2016).
15. Job, A. et al. Moderate variations of mood/emotional states related to alterations in cochlear otoacoustic emissions and tinnitus onset in young normal hearing subjects exposed to gun impulse noise. Hear. Res. 193, 31–38, doi: 10.1016/j.heares.2004.02.010 (2004).
16. Houben, M., Van Den Noortgate, W. & Kuppens, P. The relation between short-term emotion dynamics and psychological well- being: A meta-analysis. Psychol. Bull. 141, 901–930, doi: 10.1037/a0038822 (2015).
17. Kuppens, P. It’s about time: A special section on affect dynamics. Emot. Rev. 7, 297–300, doi: 10.1177/1754073915590947 (2015).
18. Trull, T. J. & Ebner-Priemer, U. W. Ambulatory assessment. Annu. Rev. Clin. Psychol. 9, 151–176, doi: 10.1146/annurev- clinpsy-050212-185510 (2013).
19. Henry, J. A. et al. Pilot study to evaluate ecological momentary assessment of tinnitus. Ear. Hear. 32, 179–290, doi: 10.1097/
AUD.0b013e31822f6740 (2012).
20. Dauman, N., Erlandsson, S., Lundlin, L. & Dauman, R. Intra-individual variability in tinnitus patients: Current thoughts and perspectives. HNO 63, 302–306, doi: 10.1007/s00106-014-2978-2 (2015).
21. Wilson, M. B. et al. Ecological momentary assessment of tinnitus using smartphone technology. A pilot study. Otolaryngol. Head.
Neck. Surg. 152, 897–903, doi: 10.1177/0194599815569692 (2015).
22. Bleich, T., Lamprecht, F., Lamm, H. & Jäger, B. Der Langzeitverlauf des chronischen Tinnitus aurium. Zeitschrift für Medizinische Psychologie 10, 79–86 (2001).
23. Holgers, K.-M., Erlandsson, S. I. & Barrenäs, M.-L. Predictive factors for the severity of tinnitus. Audiology 39, 284–291, doi:
10.3109/00206090009073093 (2000).
24. Erlandsson, S. I. & Hallberg, L. R.-M. Prediction of quality of life in patients with tinnitus. Br. J. Audiol. 34, 11–19, doi:
10.3109/03005364000000114 (2000).
25. Bradley, M. M. & Lang, P. J. Measuring emotion: The self-assessment manikin and the semantic differential. J. Behav. Ther. Exp.
Psychiatry 25, 49–59 doi:10.1016/0005-7916(94)90063-9 (1994).
26. Russel, J. A. A circumplex model of affect. J. Pers. Soc. Psychol. 39, 1161–1178, doi: 10.1037/h0077714 (1980).
27. Hiller, W. & Goebel, G. Rapid assessment of tinnitus-related psychological distress using the Mini-TQ. Int. J. Audiol. 43, 600–604 (2004).
28. Pryss, R., Reichert, M., Langguth, B. & Schlee, W. Mobile crowd sensing services for tinnitus assessment, therapy and research. IEEE 4th International Conference on Mobile Services (MS 2015), New York, June 27–July 2, 2015, IEEE Computer Society Press, pp.
352-359 (2015). Available at: http://dbis.eprints.uni-ulm.de/1152/1/ms2015rpmrblws.pdf (Accessed: 23th February 2016).
29. Ebner-Priemer, U. W., Eid, M., Kleindienst, N., Stabenow, S. & Trull, T. J. Analytic strategies for understanding affective (in)stability and other dynamic processes in psychopathology. J. Abnorm. Psychol. 118, 195–202, doi: 10.1037/a0014868 (2009).
30. Kuppens, P., Van Mechelen, I., Nezlek, J. B., Dossche, D. & Timmermans, T. Individual differences in core affect variability and their relationship to personality and psychological adjustment. Emotion 7, 262–274, doi: 10.1037/1528-3542.7.2.262 (2007).
31. Moskowitz, D. S. & Zuroff, D. C. Flux, pulse, and spin: Dynamic additions to the personality lexicon. J. Pers. Soc. Psychol. 86, 880–893, doi: 10.1037/0022-3514.86.6.880 (2004).
32. Nezlek, J. B. Diary methods for social and personality psychology in The SAGE Library in Social and Personality Psychology Methods (ed. Nezlek, J. B.). (Sage Publications), doi: 10.4135/9781446287903 (2012).
33. Milerová, J. et al. The influence of psychological factors on tinnitus severity. Gen. Hosp. Psychiatry 35, 412–416, doi: 10.1016/j.
genhosppsych.2013.02.008 (2013).
34. Langguth, B. et al. Tinnitus severity, depression, and the big five personality traits. Prog. Brain. Res. 166, 221–225, doi: 10.1016/
S0079-6123(07)66020-8 (2007).
35. Timmermans, T., Van Mechelen, I. & Kuppens, P. The relationship between individual differences in intraindividual variability in core affect and interpersonal behavior. Eur. J. Pers. 24, 623–638, doi: 10.1002/per.756 (2010).
36. Calvo, R. & D’Mello, S. Affect detection: An interdisciplinary review of models, methods, and their applications. IEEE. T. Affect.
Comp. 1, 18–37, doi: 10.1109/T-AFFC.2010.1 (2010).
37. Hoare, D. J., Edmondson-Jones, M., Gander, P. E. & Hall, D. A. Agreement and reliability of tinnitus loudness matching and pitch likeness rating. PLoS One 9, e114553, doi: 10.1371/journal.pone.0114553 (2014).
38. De Ridder, D., Congedo, M. & Vanneste, S. The neural correlates of subjectively perceived and passively matched loudness perception in auditory phantom perception. Brain Behav. 5(5), e00331, doi: 10.1002/brb3.331 (2015).
39. Moring, J., Bowen, A., Thomas, J. & Bira, L. The emotional and functional impact of the type of tinnitus sensation. J. Clin. Psychol.
Med. Settings epub ahead of print, doi: 10.1007/s10880-015-9444-5 (2015).
40. Hayden, E. C. Mobile-phone health apps deliver data bounty. Nature 531, 422–423, doi: 10.1038/531422a (2016).
41. Anthes, E. Mental health: there’s an app for that. Nature 532, 20–23, doi: 10.1038/532020a (2016).
Acknowledgements
This work was supported by the German Research Foundation (DFG) within the funding programme Open Access Publishing.
Author Contributions
T.P. and W.S. designed the study; R.P., B.L. and W.S. contributed to the data generation by developing the
“TrackYourTinnitus” platform; T.P. performed the statistical analyses; T.P. and W.S. drafted the manuscript; All authors revised the manuscript and approved its final version.
Additional Information
Supplementary information accompanies this paper at http://www.nature.com/srep Competing financial interests: The authors declare no competing financial interests.
How to cite this article: Probst, T. et al. Emotion dynamics and tinnitus: Daily life data from the
“TrackYourTinnitus” application. Sci. Rep. 6, 31166; doi: 10.1038/srep31166 (2016).
This work is licensed under a Creative Commons Attribution 4.0 International License. The images or other third party material in this article are included in the article’s Creative Commons license, unless indicated otherwise in the credit line; if the material is not included under the Creative Commons license, users will need to obtain permission from the license holder to reproduce the material. To view a copy of this license, visit http://creativecommons.org/licenses/by/4.0/
© The Author(s) 2016