https://doi.org/10.1140/epjc/s10052-020-7943-5
Regular Article - Experimental Physics
New limits on the resonant absorption of solar axions obtained with a 169 Tm-containing cryogenic detector
A. H. Abdelhameed
1, S. V. Bakhlanov
2, P. Bauer
1, A. Bento
1,7, E. Bertoldo
1, L. Canonica
1, A. V. Derbin
2, I. S. Drachnev
2, N. Ferreiro Iachellini
1, D. Fuchs
1, D. Hauff
1, M. Laubenstein
3, D. A. Lis
4, I. S. Lomskaya
2, M. Mancuso
1, V. N. Muratova
2, S. Nagorny
5, S. Nisi
3, F. Petricca
1, F. Proebst
1, J. Rothe
1, V. V. Ryabchenkov
6, S. E. Sarkisov
6, D. A. Semenov
2, K. A. Subbotin
4, M. V. Trushin
2, E. V. Unzhakov
2,a, E. V. Zharikov
41Max-Planck-Institut für Physik, 80805 Munich, Germany
2NRC Kurchatov Institute, Petersburg Nuclear Physics Institute, 188309 Gatchina, Russia
3INFN, Laboratori Nazionali del Gran Sasso, 67010 Assergi, Italy
4Prokhorov General Physics Institute of the Russian Academy of Sciences, 119991 Moscow, Russia
5Physics Department, Queen’s University, Kingston, ON K7L 3N6, Canada
6NRC Kurchatov Institute, 123182 Moscow, Russia
7Departamento de Fisica, Universidade de Coimbra, P3004 516 Coimbra, Portugal
Received: 5 February 2020 / Accepted: 17 April 2020 / Published online: 7 May 2020
© The Author(s) 2020
Abstract A search for resonant absorption of solar axions by
169Tm nuclei was carried out. A newly developed approach involving low-background cryogenic bolometer based on Tm
3Al
5O
12crystal was used that allowed for sig- nificant improvement of sensitivity in comparison with previ- ous
169Tm based experiments. The measurements performed with 8.18 g crystal during 6.6 days exposure yielded the following limits on axion couplings: | g
Aγ( g
0AN+ g
3AN) ≤ 1.44 ×10
−14GeV
−1and |g
Ae(g
0AN+g
3AN) ≤ 2.81 ×10
−16.
1 Introduction
Originally, axions were introduced as hypothetical bosons produced by a spontaneous breaking of newly introduced chiral symmetry at some energy scale f
A[1–3]. The ini- tial model of “standard” axion assumed the symmetry- breaking scale f
Ato be similar to the electro-weak inter- actions scale, but subsequently it was excluded by a series of experiments (the extensive list can be found in correspond- ing section of [4]). Afterwards, the initial axion model has been expanded into two classes of “invisible” axion models:
hadronic (KSVZ) axion [5,6] and GUT (DFSZ) axion [7,8].
These models allow f
Ato be arbitrary large, therefore reduc- ing the expected axion mass and suppressing the axion inter- actions with ordinary matter, effectively rendering it “invis- ible”.
ae-mail:unzhakov_ev@pnpi.nrcki.ru(corresponding author)
The limit on the axion mass m
Ais obtained as a conse- quence of the experimental limits on the effective coupling constants of axion with photons (g
Aγ), electrons (g
Ae) and nucleons (g
AN). Axion coupling constants appear to be sig- nificantly model-dependent, so in principle it is possible to consider more general class of axion-like particles (ALPs) with their masses and coupling constants being independent parameters. Axions and ALPs remain suitable dark matter candidates, motivating the experimental effort to search for these particles.
The axion mass m
Acan be expressed through the proper- ties of π
0-meson [9]:
m
A= m
πf
πf
Az
(1 + z)(1 + z + w)
1/2, (1)
where m
πand f
πare respectively the pion mass and decay constant, while z = m
u/m
dand w = m
u/m
sare the quark mass ratios.
In a laboratory environment axions could be potentially
observed via various processes with different axion cou-
plings. The Primakoff effect allows the conversion of axion
into a detectable photon inside strong magnetic fields (g
Aγ)
or the axion decay into 2 γ -quanta. Axion interaction with
electrons of atomic shells (g
Ae) can cause axio-electric effect
(similarly to the photo-ionization) or Compton-like pro-
cesses. Finally, since the axion is a pseudoscalar boson it
can undergo resonant absorption or emission in nuclear tran-
sitions of magnetic type (g
AN).
The resonant absorption can be used for detection of solar axions in experimental setup with a target contain- ing a nuclide with magnetic type transition to the ground state. The general idea behind this approach is that, due to the presence of g
ANcoupling, the axions could be res- onantly absorbed by the target nucleus N possessing the rel- evant excited state. After the absorption, the excited nucleus N
∗will consequently discharge, emitting the γ -quantum:
A + N → N
∗→ N + γ . The proposals for experiments aimed for registration of monochromatic solar axions pro- duced by
57Fe,
7Li,
83Kr and
169Tm nuclei were originally made in [10–13], correspondingly.
The main benefit of g
AN-based detection technique comes from the resonant nature of the absorption process, which provides high reaction cross-section and, therefore, a possi- bility of achieving competitive sensitivity even with a rela- tively small-scale experimental setup. A “solid target + semi- conductor detector” layout has been successfully employed for previous axion searches with various targets (
7Li [14],
169
Tm [15],
57Fe [16]). On the other hand,
57Fe and
169Tm nuclei have low-energy excited states with significant conver- sion ratios (η ∼ 10
−3), so the most transitions would actually produce conversion or Auger electrons and characteristic X- rays, instead of nuclear γ -quanta. Intensive self absorption of these particles inside the target material effectively limits the usable target mass by several grams, thus constraining the potentially achievable sensitivity of this approach.
A natural solution for this problem would be the intro- duction of the target material inside the active volume of the detector. This approach was implemented in experiments with gaseous
83Kr target and proportional counter located at the underground facility of Baksan Neutrino Observa- tory [17,18].
In this paper we aim to detect solar axions via the resonant absorption by
169Tm target, similarly to a series of previous axion searches with
169Tm targets performed at Petersburg Nuclear Physics Institute [13,15,19]. The measurement pre- sented here uses the recently developed approach with cryo- genic bolometer based on Tm-containing crystal of a garnet family (Tm
3Al
5O
12) [20]. We show a significant improve- ment of the experimental sensitivity thanks to the inclusion of
169Tm inside the active volume of the detector and demon- strate the potential feasibility of this approach for a kg-scale installation.
2 Axion rate estimation
The most intense source of axions for an experiment based on Earth is constituted by the Sun. There are several expected mechanisms of axion production that can take place inside stars. Axions can be produced as a result of Primakoff effect due to the axion–photon coupling (g
Aγ). The axion–
electron coupling (g
Ae) allows for several axion-yielding reactions: atomic de-excitation and recombination, electron–
nucleus and electron–electron bremsstrahlung and Compton- like scattering. Finally, stellar cores possess high enough tem- peratures for the thermal excitation of low-energy nuclear levels of magnetic type (∼ 1 keV scale), which could emit axions during the de-excitation (g
ANcoupling).
2.1 Solar axion flux
The axion-photon coupling is determined by the following expression [21,22]:
g
Aγ= α 2π f
AE
N − 2(4 + z) 3(1 + z)
= α 2π f
AC
Aγ(2) where α ≈ 1/137 is the fine structure constant and E /N is the ratio between electromagnetic and color anomalies. The value of E / N depends on the particular axion model: in case of DFSZ-axion E /N = 8/3 while in the original KSVZ model E /N = 0 [21].
The differential energy spectrum of Primakoff axions is calculated [23–25] based on the radial distributions of tem- perature and electron density provided by the standard solar model (SSM). The shape of Primakoff axion spectrum cal- culated for nominal value g
Aγ= 10
−10GeV
−1is presented in Fig. 1. The continuous flux has a maximum at ∼ 4keV and becomes negligible at energies beyond 20keV. In case of
169Tm as a target, the axion flux at 8.41 keV would remain relatively significant at about ∼ 10% of its maximum value.
The axion–electron coupling depends significantly on the type of axion model. In case of DFSZ axion the direct cou- pling to leptons is allowed and the constant g
Aedepends on electron mass m
eas:
g
Ae= 1
3 cos
2β · m
ef
A(3) where β is an arbitrary angle.
In KSVZ model axions can not interact with leptons directly, but the coupling via the radiative loops remains pos- sible [22]:
g
Ae= 3α
2nm
e2π f
AE N ln f
Am
e− 2
3 · 4 + z + w 1 + z + w ln Λ
m
e(4) where the QCD cutoff scale Λ ≈ 1GeV. Consequently, in this case the axion–electron coupling is suppressed by a fac- tor α
2.
The expected flux of axions produced in the Sun via
the axion-electron coupling (g
Ae) is calculated using cross-
sections for Compton processes [26,27] and bremsstrah-
lung [28], SSM data on the electron gas density, temperature
distribution and concentrations of various elements [19,29].
Fig. 1 The calculated energy spectra of solar axions produced due to the axion–photon [25] and axion–electron couplings [30]. The spectra are calculated in assumption of massless axion (mA=0) for nominal gAγ andgAevalues relevant to the range of experimental sensitivity
A recent work [30] also includes the axion production via the processes of atomic recombination and de-excitation, which adds additional linear structure on top of the continu- ous Compton/bremsstrahlung spectra.
The shape of total g
Ae-related axion spectrum (together with Compton and bremsstrahlung components) calculated for the nominal value of g
Ae= 10
−11is given in Fig. 1. At lower energies below ∼ 5 keV bremsstrahlung axions con- stitute the most part of g
Aeaxion flux, while above ∼ 5 keV Compton axions become dominant.
It is important to note that for both axion couplings the value of solar flux Φ
Aat a given axion energy E
Aappears to be proportional to the square of the relevant coupling con- stant:
Φ
Ax(E
A) ∝ C
Ax· g
2Ax(5)
where C
Axis a constant determined for a given axion cou- pling g
Ax.
2.2 Resonant absorption of axions by atomic nuclei The cross-section for the resonant absorption of incident solar axions with energy E
Ais expressed in a similar fashion as the conventional γ -ray absorption, corrected by emission prob- ability ω
A/ω
γ. The axion absorption rate for
169Tm can be presented as [13]:
R
A= πσ
0γΓ d Φ
Ad E
A(E
A= 8.41 keV) ω
Aω
γ(6) where σ
0γis the maximum cross-section of γ-ray absorption, Γ is the width of energy level, ω
Aand ω
γare respectively the probabilities of axion or photon emission.
The probability ratio ω
A/ω
γwas calculated in [31,32]
using the long wave approximation:
ω
Aω
γ= 1 2 πα
1 1 + δ
2g
0ANβ + g
3AN(μ
0− 0 . 5 )β + μ
3− η
2p
Ap
γ 3(7)
where p
γand p
Aare respectively the photon and axion momenta; μ
0= μ
p+μ
n≈ 0.88 and μ
3= μ
p− μ
n≈ 4.71 are the isoscalar and isovector nuclear magnetic momenta, β and η are parameters derived from the nuclear matrix elements of a particular target isotope. In case of
169Tm, using the one-particle approximation, these parameters can be approximated as β ≈ 1.0 and η ≈ 0.5, yielding the expression for ω
A/ω
γas [13]:
ω
Aω
γ= 1 . 03 ( g
0AN+ g
3AN)
2( p
A/ p
γ)
3. (8) In the framework of KSVZ axion model, the axion–
nucleon coupling g
ANconsisting of the isoscalar g
0ANand isovector g
3ANterms can be expressed through the f
Avalue [21,22]:
g
0AN= − m
N6 f
A2S + (3F − D) 1 + z + 2w 1 + z + w
(9) and
g
3AN= − m
N2 f
A(F + D) 1 − z 1 + z + w
(10) where m
N≈ 939MeV is the nucleon mass, z and w are quark mass ratios, and F , D, S are axial and singlet coupling param- eters. The values of F and D are experimentally obtained from the observations of hyperon semi-leptonic decays [33]:
F = 0.462 ± 0.011 and D = 0.808 ± 0.006, for various solar axion fluxes.
The singlet coupling parameter S represents the contribu- tion of quarks to the polarization of the nucleon. The experi- mental restrictions on the value of S, obtained in [34,35], are (0.27 ≤ S ≤ 0.41). Nevertheless, in further calculations we assume S = 0 . 5 for convenience of result comparison, since this value is commonly used in previous works and in other experiments.
The model independent expression for the rate of axion absorption by
169Tm nucleus (6) then can be derived from flux expression (5) and ω
A/ω
γratio (8):
R
A= C
Ax· g
2Ax· (g
0AN+ g
3AN)
2· (p
A/p
γ)
3(11)
where counting rate R
Ais expressed here in atom
−1· s
−1units. The constant C
Axhas a cumulative value defined by
axion model parameters, properties of target nucleus, etc.
– in case of
169Tm target C
Aγ= 104 and C
Ae= 2.76 × 10
5[13,30].
Then, using the relations between axion mass m
Aand axion–nuclei coupling g
AN(9, 10) it becomes possible to express the absorption rate as a function of axion coupling g
Axand m
A(in eV units):
R
A= C
Ax· g
2Ax· m
2A· (p
A/ p
γ)
3(C
Aγ= 4.08 × 10
−13, C
Ae= 1.03 × 10
−9) (12) Finally, by employing expressions for m
A(1), g
Aγ(2) and g
Ae(3, 4) we obtain the dependence of axion absorption rate R
Adirectly on the axion mass m
A(in eV units):
R
A= C
Ax· m
4A· (p
A/ p
γ)
3(C
Aγ= 6.64 × 10
−32, C
Ae= 8.08 × 10
−31) (13) The total number of expected “axion” events is determined by the target mass (i.e. number of
169Tm nuclei), detector efficiency and total live time of the measurement. The detec- tion probability of the resulting “axion” peak depends on the background level and on the energy resolution of the exper- iment.
3 Cryogenic bolometer and experimental setup
In a recent work [20], we demonstrated the possibility to oper- ate a cryogenic bolometer based on the thulium-containing crystal Tm
3Al
5O
12. This first prototype showed promising results, but the energy threshold achieved was rather far from meeting the minimum benchmark to be sensitive to the res- onant absorption of solar axions in
169Tm.
In order to improve the energy threshold and the energy resolution of a cryogenic bolometer based on a Tm
3Al
5O
12crystal the type of phonon sensor has been changed, replac- ing the Neutron Transmutation Doped (NTD) sensor with a Transition Edge Sensor (TES). First, the same Tm
3Al
5O
12crystal used in [20] has been processed with dichloromethane (CH
2Cl
2) in order to remove the glue and the NTD sensor.
After that, a CRESST-like TES [36] has been evaporated on the crystal surface.
The TES is constituted by a thin strip of tungsten with two large aluminum pads partially overlapping the tungsten layer. These aluminum pads have two different features: they serve as phonon collectors and bond pads. These pads are connected via a pair of 25μm aluminum bond wires through which the bias current is injected. The tungsten film is also connected by a long and thin strip of gold to a thicker gold bond pad on which a 25 μm gold wire is bonded. This bond serves as thermal link between the sensor and the heat bath at ∼ 10mK.
On the same surface, but separated from the TES, we also evaporate a heater. The heater is made of a thin strip of gold
Fig. 2 LeftTm3Al5O12crystal after the TES deposition. It is possible to see two large aluminum phonon collectors (light gray) evaporated on top of a darker strip of tungsten. Closer to the upper edge of the crystal surface there is the heater made of a thin strip of gold with two aluminum pads deposited on top.RightA sketch of a similar TES design [37]
with two aluminum pads deposited on top. These pads are also bonded with a pair of 25 μm aluminum bond wires through which a tunable current can be injected to main- tain the TES at the desired temperature. The heater is also used to inject artificial pulses in order to monitor the detector response over time and to refine the energy calibration during the data analysis.
We would like to highlight that this is the first time a TES is directly evaporated on a crystal containing
169Tm. In Fig. 2 we show the crystal after the TES deposition along with a sketch of the TES design.
After the TES deposition, the crystal was placed inside a copper holder where it was held in position by a pair of CuBe clamps. Inside the holder, we place a
55Fe X-ray source with activity of ∼ 0.4Bq at a distance of ∼ 1mm from one of the crystal surfaces. This X-ray source is used for the energy calibration of the detector. Finally, the holder is mechanically coupled to the coldest stage of a Leiden Cryogenics dilution refrigerator located in an above-ground laboratory at the Max Planck Institute for Physics (MPP) in Munich, Germany. It has to be noted that in this laboratory there is no shielding against environmental and cosmic radiation.
A temperature of ∼ 10mK has been maintained over the course of the whole run at the coldest stage of the dilution refrigerator. The TES has a critical temperature T
C= 23m K , thus the operating point is stabilized around this value inject- ing an appropriate current through the heater. The readout of the TES is obtained with a commercial SQUID system,
11 Applied Physics System model 581 DC SQUID.
combined with a CRESST-like detector control system [38].
The start of the run has been reserved for a first energy cal- ibration with a
57Co source placed outside of the dilution refrigerator. After this initial calibration, we have collected background data for solar axion search.
4 Data analysis and results
The background data acquisition has lasted for 6.60 days of total measurement time. To precisely evaluate the effec- tive measurement time in the region of interest we created a copy of the data where we blindly inject simulated pulses of 8 . 41 keV with a rate of 1.6 mBq, ∼ 1000 times smaller than the total rate observed from environmental radioactiv- ity. The data with the simulated pulses were triggered and analyzed in the same way as the background data collected, hence the fraction of survived simulated pulses corresponds to the survival probability of a hypothetical signal.After the trigger, the effective measurement time in the energy region of interest is 3.89 days, with a significant reduction to the respect of the total measurement time. This is due to the trig- ger dead time, which is naturally high in an above-ground experimental setup.
One stability cut and two quality cuts are applied to the data, with the effective measurement time further reduced to 3 . 86 days. The stability cut rejects the periods of time when the detector is not in the desired working point, while the quality cuts reject pile-up events and artifacts in the data. The quality cuts are based on two different pulse shape parame- ters. The overall exposure is equal to 31.6g· day with a
169Tm exposure of 19.2g· day.
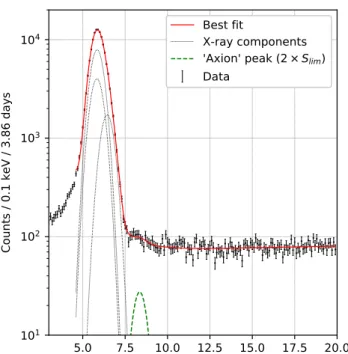
The acquired spectrum of events in 3 − 20 keV energy interval is presented in Fig. 3.
The energy calibration has been performed using a com- bination of the injected heater pulses and the characteristic peak induced by the presence of the
55Fe source. The injected heater pulses have three different amplitudes and are continu- ally sent throughout the data acquisition. Using this informa- tion we can monitor the stability of the detector and correct for any unwanted drift of the operating point. The energy res- olution of the detector is not sufficient to resolve K
α1, K
α2and K
β1+3characteristic X-ray lines of Mn induced by the
55
Fe source, thus in the spectrum only a single peak centered around 5.895 keV is visible.
There is no significant excess of events in the vicinity of 8.41 keV. Hence, in order to determine the upper limit on the number of events in the “axion peak” a maximum likelihood method has been employed. The fit function is chosen as a sum of exponential background, three Gaussians describing K
α1, K
α2, K
βX-rays of Mn and the expected “axion” peak, all with the same energy resolution σ :
Fig. 3 Spectrum of events obtained during the live time of 3.9 days by Tm3Al5O12bolometer in 3−20 keV energy interval with 0.1 keV binning. The result of fitting by model (14) is presented by solid line.
The presumed “axion” peak with areaS =2×Sli mis shown by the dashed line (the area is increased to improve visibility)
N ( E ) = a + b · E + c · e
−(E−d4)+
4i=1
S
ie
−(Ei−E)2
2σ2
(14)
The shape of the unresolved Mn X-ray peak is described by sum of three Gaussians, representing K
α1, K
α2and K
βlines. All Gaussian positions, including the axion peak, are set relative to the position of the brightest K
α1line ( E
α1).
The intensities of K
α1, K
βand axion peak are free, while the intensity of the K
α2is set relatively to S
α1. In total, there are 9 free fit parameters: 4 background coefficients (a, b, c, d) and 5 peak parameters (σ, E
α1, S
α1, S
β, S
A). The exponen- tial model of the background fails below t5 keV, so in order to avoid the introduction of additional parameters we chose to raise the lower border of fit interval to 4.6 keV, since this non-linear background should not make any significant con- tribution at 8.31 keV. The best fit with reduced chi-squared criterion χ
2/ N
DoF= 171.1/(154 − 9) = 1.18 is presented in Fig. 3 by a solid line. The determined energy resolution amounted to σ = 0.370 keV.
In order to determine the upper limit on the 8.41 keV peak intensity a standard approach of χ
2-profiling was employed.
The value of χ
2is determined for different fixed values of
S
Awhile the other parameters remain unconstrained. The
obtained probability function P(χ
2) is normalized to unity
for S
A≥ 0. The upper limit estimated in this manner is
S
li m= 128 at 90 % confidence level.
The upper limit on the amount of measured “axion” events S
li mdepends on the detection efficiency , the number of
169
Tm nuclei N
T m, the measurement time T , and axion res- onant absorption rate R
Acalculated in Sect. 2.2:
· N
T m· T · R
A≤ S
li m(15)
In case of Tm
3Al
5O
12crystal the detection efficiency is ≈ 1 since the target material is located inside the active volume of the detector. The number of target
169Tm nuclei in 8.18 g Tm
3Al
5O
12crystal is N
T m= 1.77 × 10
22. The exposure time left after the application of data selection cuts is equal to T = 3.86 days and R
Ais the axion resonant absorption rate for
169Tm defined earlier by expressions (11, 12, 13).
In accordance with these equations and in assumption that (p
A/ p
γ)
3≈ 1, which holds for axion masses below ∼ 2keV, our measurement yields the following limits on axion-photon coupling:
g
Aγ· ( g
0AN+ g
3AN) ≤ 1 . 44 × 10
−14GeV
−1g
Aγm
A≤ 2.31 × 10
−7(16) and axion–electron coupling:
g
Ae· (g
0AN+ g
3AN) ≤ 2.81 × 10
−16|g
Aem
A| ≤ 4.59 × 10
−9eV (17) The axion mass m
Ahere is expressed in eV units and g
Aγis expressed in GeV
−1units, while g
Aeand g
ANare dimen- sionless.
The exclusion plots for the axion parameter space are given in Figs. 4 and 5 along with comparison with other experiments and astrophysical bounds. The limit obtained in this work significantly exceeds the best previous result achieved with
169Tm target [15]. The g
Aγlimit obtained with
83
Kr [18] still remains unsurpassed, although the current lim- its achieved with only 8.18 g crystal and 3.86 days of live time are competitive, and show potential due to the scalability of the experiment.
It should also be noted that the particular values of
169Tm nuclear matrix elements make it a favorable axion target, since the probability ratio ω
A/ω
γnever vanishes for any combination of model parameters, unlike the case of
57Fe and
83Kr nuclei [16].
5 Conclusions
In this work we present the first successful investigation of the resonant absorption of solar axions in
169Tm employing a cryogenic bolometer. The cryogenic bolometer is constituted
Fig. 4 Axion–photon couplinggAγlimits obtained in current work in comparison with other experiments (DAMA [39], EDELWEISS [40], CAST [41],169Tm-Si(Li) [15],83Kr-gas counter [18]) and astrophysi- cal bounds (horizontal branch stars lifetime [42])
Fig. 5 Axion–electron couplinggAe limits obtained in current work in comparison with other experiments (axio-electric effect on Si [43], LUX [44]) and astrophysical bounds (red giant cooling rate [45])
by a 8.18 g Tm
3Al
5O
12crystal with a TES directly evapo-
rated on the crystal surface. We have collected data for 3.86
days of effective measurement time with a
169Tm exposure
equal to 19.2 g · day. From the data acquired, we set compet-
itive limits on the axion coupling constants to electrons and
photons.
The technology presented in this paper allows for a straightforward scaling of the experiment which would enable a drastic increase of the collected exposure. Further- more, the reduction of the background rate in the region of interest would translate into a considerable improvement on the sensitivity to solar axion absorption. Since the back- ground rate reduction can be effectively achieved with a dedicated underground experiment, we are confident in an improvement of the presented results in the near future.
Acknowledgements This work was supported by Russian Foundation for Basic Research (Grant Numbers #19-02-00097 and #20-02-00571).
The authors also express gratitude to the support from NRC “Kurchatov Institute” provided by administrative order #1808 of 14.08.2019.
Data Availability StatementThis manuscript has no associated data or the data will not be deposited. [Authors’ comment: According to internal institution regulations data is not deposited, but can be provided upon request to the corresponding author.]
Open Access This article is licensed under a Creative Commons Attri- bution 4.0 International License, which permits use, sharing, adaptation, distribution and reproduction in any medium or format, as long as you give appropriate credit to the original author(s) and the source, pro- vide a link to the Creative Commons licence, and indicate if changes were made. The images or other third party material in this article are included in the article’s Creative Commons licence, unless indi- cated otherwise in a credit line to the material. If material is not included in the article’s Creative Commons licence and your intended use is not permitted by statutory regulation or exceeds the permit- ted use, you will need to obtain permission directly from the copy- right holder. To view a copy of this licence, visithttp://creativecomm ons.org/licenses/by/4.0/.
Funded by SCOAP3.
References
1. R.D. Peccei, H.R. Quinn, Phys. Rev. Lett.38, 1440 (1977) 2. S. Weinberg, Phys. Rev. Lett.40, 223 (1978)
3. F. Wilczek, Phys. Rev. Lett.40, 279 (1978)
4. M. Tanabashi et al., Phys. Rev. D Part. Fields. Gravit. Cosmol.98, (2018)
5. J.E. Kim, Phys. Rev. Lett.43, 103 (1979)
6. M. Shifman, A. Vainshtein, V. Zakharov, Nucl. Phys. B166, 493 (1980)
7. M. Dine, W. Fischler, M. Srednicki, Phys. Lett. B104, 199 (1981) 8. A. Zhitnitskii, Sov. J. Nucl. Phys. Engl. Transl. U. S31, 2 (1980) 9. W.A. Bardeen, S.-H. Tye, Phys. Lett. B74, 229 (1978)
10. S. Moriyama, Phys. Rev. Lett.75, 3222 (1995)
11. M. Krˇcmar, Z. Kreˇcak, A. Ljubiˇci´c, M. Stipˇcevi´c, D.A. Bradley, Phys. Rev. D64, 115016 (2001)
12. K. Jakovci´c, Z. Krecak, M. Krcmar, A. Ljubici´c, Radiation Physics and Chemistry71, 793 (2004), 9th International Symposium on Radiation Physics (ISRP-9)
13. A. Derbin, A. Egorov, I. Mitropolskii, V. Muratova, Bulletin of the Russian Academy of Sciences: Physics71, 832 (2007)
14. P. Belli et al., Phys. Lett. B711, 41 (2012)
15. A. Derbin et al., Bull. Russian Acad. Sci. Phys.74, 481 (2010) 16. A.V. Derbin, V.N. Muratova, D.A. Semenov, E.V. Unzhakov, Phys.
Atom. Nucl.74, 596 (2011)
17. A.V. Derbin et al., J. Phys: Conf. Ser.934, 012018 (2017) 18. Y.M. Gavrilyuk et al., JETP Lett.107, 589 (2018)
19. A.V. Derbin, A.S. Kayunov, V.V. Muratova, D.A. Semenov, E.V.
Unzhakov, Phys. Rev. D83, 023505 (2011)
20. E. Bertoldo et al., Nuclear instruments and methods in physics research section a: accelerators. Spectrom. Detect. Associat. Equip.
949, 162924 (2020)
21. D.B. Kaplan, Nucl. Phys. B260, 215 (1985) 22. M. Srednicki, Nucl. Phys. B260, 689 (1985)
23. K. van Bibber, P.M. McIntyre, D.E. Morris, G.G. Raffelt, Phys.
Rev. D39, 2089 (1989)
24. R. Creswick et al., Phys. Lett. B427, 235 (1998)
25. C.A.S.T. Collaboration, K. Zioutas et al., Phys. Rev. Lett.94, 121301 (2005)
26. M. Pospelov, A. Ritz, M. Voloshin, Phys. Rev. D78, 115012 (2008) 27. P. Gondolo, G.G. Raffelt, Phys. Rev. D79, 107301 (2009) 28. A.R. Zhitnitskij, Y.I. Skovpen, Sov. J. Nucl. Phys.29, (1979) 29. D. Kekez, A. Ljubiˇci´c, Z. Kreˇcak, M. Krˇcmar, Phys. Lett. B671,
345 (2009)
30. J. Redondo, J. Cosmol. Astropart. Phys.2013, 008 (2013) 31. T.W. Donnelly, S.J. Freedman, R.S. Lytel, R.D. Peccei, M.
Schwartz, Phys. Rev. D18, 1607 (1978)
32. F.T. Avignone III et al., Phys. Rev. D37, 618 (1988) 33. V. Mateu, A. Pich, J. High Energy Phys.2005, 041 (2005) 34. HERMES Collaboration, A. Airapetian et al., Phys. Rev. D75,
011103 (2007)
35. V. Alexakhin et al., Phys. Lett. B647, 8 (2007) 36. J. Rothe et al., J. Low Temp. Phys. (2018)
37. A. Tanzke, Low-Threshold Detectors for Low-Mass Direct Dark Matter Search with CRESST-III. Dissertation, Technische Univer- sität München, München (2017)
38. G. Angloher et al., Astropart. Phys.31, 270 (2009) 39. R. Bernabei et al., Phys. Lett. B515, 6 (2001)
40. E. Armengaud et al., J. Cosmol. Astropart. Phys.2013, 067 (2013) 41. V. Anastassopoulos et al., Nat. Phys.13, 584 (2017)
42. A. Ayala, I. Domínguez, M. Giannotti, A. Mirizzi, O. Straniero, Phys. Rev. Lett.113, 191302 (2014)
43. A.V. Derbin, I.S. Drachnev, A.S. Kayunov, V.N. Muratova, JETP Lett.95, 339 (2012)
44. L.U.X. Collaboration, D.S. Akerib et al., Phys. Rev. Lett.118, 261301 (2017)
45. G. Raffelt, A. Weiss, Phys. Rev. D51, 1495 (1995)
![Fig. 1 The calculated energy spectra of solar axions produced due to the axion–photon [25] and axion–electron couplings [30]](https://thumb-eu.123doks.com/thumbv2/1library_info/3996713.1540181/3.892.81.429.77.325/calculated-energy-spectra-axions-produced-photon-electron-couplings.webp)

![Fig. 4 Axion–photon coupling g A γ limits obtained in current work in comparison with other experiments (DAMA [39], EDELWEISS [40], CAST [41], 169 Tm-Si(Li) [15], 83 Kr-gas counter [18]) and astrophysi-cal bounds (horizontal branch stars lifetime [42])](https://thumb-eu.123doks.com/thumbv2/1library_info/3996713.1540181/6.892.465.808.78.436/coupling-obtained-comparison-experiments-edelweiss-astrophysi-horizontal-lifetime.webp)
