SFB 649 Discussion Paper 2006-024
e-Learning Statistics - A Selective Review
Wolfgang Härdle* **
Sigbert Klinke*
Uwe Ziegenhagen* **
* Institute for Statistics and Econometrics, Humboldt-Universität zu Berlin, Germany
** C.A.S.E. – Center for Applied Statistics and Economics, Humboldt-Universität zu Berlin, Germany
This research was supported by the Deutsche
Forschungsgemeinschaft through the SFB 649 "Economic Risk".
http://sfb649.wiwi.hu-berlin.de ISSN 1860-5664
SFB 649, Humboldt-Universität zu Berlin Spandauer Straße 1, D-10178 Berlin
S FB
6 4 9
E C O N O M I C
R I S K
B E R L I N
Wolfgang H¨ardle1, Sigbert Klinke2, and Uwe Ziegenhagen3
1 Institute for Statistics and Econometrics, Center for Applied Statistics and Economicshaerdle@wiwi.hu-berlin.de
2 Institute for Statistics and Econometrics,sigbert@wiwi.hu-berlin.de
3 Institute for Statistics and Econometrics, Center for Applied Statistics and Economicsziegenhagen@wiwi.hu-berlin.de
Modern computing equipment is present at schools and universities at all levels of education.4In the statistical sciences computers offer great opportunities to enrich the learning process by the means of e.g. animations, software integration or on-the-fly computations.
A personal review of different e-learning platforms for statistics is done in this paper. This review reveals facts that could be taken into account for future e-learning platforms in statistics. One of the most striking discoveries of our analysis is that students of statistics actually donot use electronic media in the desired frequency and actually rely more on print media such as books, copies of slides, etc.
Keywords
e-learning, electronic books, hypertext courseware, statistical software
1 Introduction
There has been a plethora of approaches to find the ’holy grail’ of e-learning statistics, satisfying the needs of teachers and students as well. In fact the demand of students and teachers for e-learning must be correctly balanced as the following example illustrates.
The aim of a student, for example, is to get immediate and fast access to media which aid him or her in the acquisition of knowledge to pass the exam. The teacher on the other hand is interested in improving his classes and providing the student with knowledge for sophisticated data analyses under
4 This research was supported by the Deutsche Forschungsgemeinschaft through the SFB 649 ’Economic Risk’.
different conditions. These aims are generally conflicting and hardly mappable into a single e-learning system.
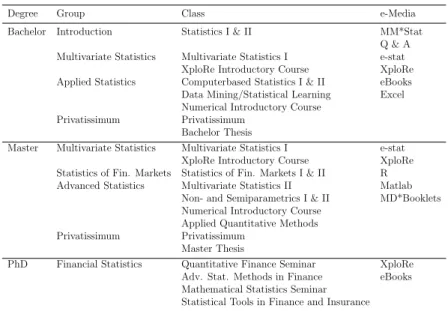
In addition each course level requires its special e-learning architecture since the degree of computer literacy and the willingness to perform interactive statistical learning tasks is, of course, a function of this level. At ISE/CASE the education is based on the following elements: introductory statistics and probability theory in the first year, multivariate statistics and first computa- tional steps in the second year and specialisation in a theoretical or applied field (e.g. finance, insurance) and research seminars in the third year. An overview about the course structure is given in Table 1.
Table 1.Overview of the course structure at ISE
1244-1253
Mori, Y., Yamamoto, Y. and Yadohisa, H. (2003). Data-oriented Learning System of Statistics based on Analysis Scenario/Story (DoLStat). Bulletin of the International Statistical Institute (ISI).
M¨uller, M., R¨onz, B., Ziegenhagen, U.(2000). The Multimedia Project MM*Stat for Teaching Statistics, In: COMPSTAT. Proceedings in Computational Statistics, Physica Verlag
Degree Group Class e-Media
Bachelor Introduction Statistics I & II MM*Stat
Q & A Multivariate Statistics Multivariate Statistics I e-stat
XploRe Introductory Course XploRe Applied Statistics Computerbased Statistics I & II eBooks Data Mining/Statistical Learning Excel Numerical Introductory Course
Privatissimum Privatissimum Bachelor Thesis
Master Multivariate Statistics Multivariate Statistics I e-stat XploRe Introductory Course XploRe Statistics of Fin. Markets Statistics of Fin. Markets I & II R Advanced Statistics Multivariate Statistics II Matlab
Non- and Semiparametrics I & II MD*Booklets Numerical Introductory Course
Applied Quantitative Methods Privatissimum Privatissimum
Master Thesis
PhD Financial Statistics Quantitative Finance Seminar XploRe Adv. Stat. Methods in Finance eBooks Mathematical Statistics Seminar
Statistical Tools in Finance and Insurance
13
During the last ten years we have developed several systems on our own, in addition we have been involved in a variety of e-learning projects. Based on our experience with these projects we observed that:
1. Interactivity is not appreciated or understood.
2. HTML pages and screenshots of interactive examples are often printed out for take home studies.
3. Discussion groups are rarely used.
4. Feedback through uploading of e.g. homework is often refused.
This might all be a consequence of technical issues (internet browser, operating system), we do believe though that e-learning in statistics should not invest too much optimism but rather provide a thoughtful set of really integrable e-learning examples.
This paper is organized as follows. In Section 2 we describe a variety of e- learning systems, in Section 3 we report our main findings. Section 4 concludes the findings with a recommendation on future e-learning architectures.
2 Modern e-learning materials
2.1 MM*Stat
A first-year student learning statistics needs to be introduced into descrip- tive statistics and the basic concepts of probability theory and estimation.
The highschool training puts him on a level of knowledge which typically incorporates the judgement of roulette or lottery outcomes but not the test- ing of hypotheses and the graphical display of data. The idea of MM*Stat (http://www.quantlet.com/mdstat/mmstat.html) was to directly pick up the highschool knowledge and then to go on with basic concepts of graphical data analysis.
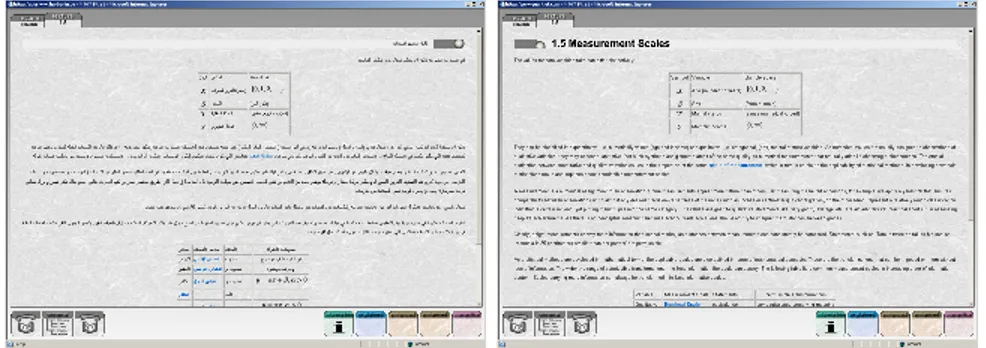
The screenshot in Figure 1 shows screenshots for the Arab and English edition of MM*Stat and depicts the HTML-based filing card structure: Each
’lecture’ filing card provides basic concepts of methods considered together with definitions, important formulas and graphics. ’Fully explained’, ’Enhanced’ and
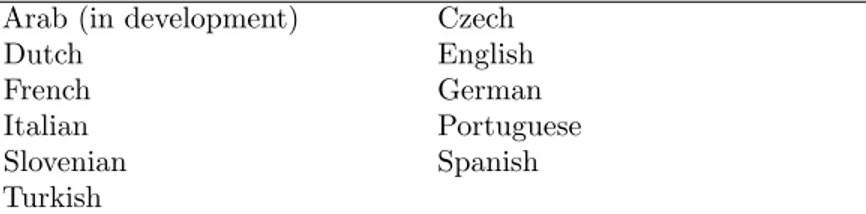
’Interactive’ examples are linked to the lecture card and show how the formulas can be applied. ThisMD*Booklet structure was implemented manually for the German edition, for other languages (see Table 2) an automatic conversion utility [KW2002] had been developed on the basis of LaTeX2HTML.
Fig. 1. Screenshot of MM*Stat, Arab and English version
Table 2.Languages covered by MM*Stat
Arab (in development) Czech
Dutch English
French German
Italian Portuguese
Slovenian Spanish
Turkish
For the integration of interactive examples a combination of an embedded XploRe Quantlet Client [BHL2005] and a local or remote XploRe Quantlet Server (XQS) is used. Thus MM*Stat enables the student to compute distri- bution functions, draw histograms or derive results for statistical tests in the web browser.
In our opinion MM*Stat provides certain advantages compared with text- books. On the one hand printed books are usually restricted to small datasets since it is exhausting to compute e.g. a regression line for a dataset of 100 value pairs, on the other hand the effects of of a parameter change can only be depicted as a sequence of graphs and tables. With MM*Stat, real-world datasets can be used, effects of parameter changes are shown in real-time.
One of the cornerstones of teaching, the repetition of earlier introduced concepts and methods is implemented in two different ways: To see or recall the definition of a used term, a glossary has been written, important words within the different lectures are linked to this glossary. In addition each chapter contains multiple choice questions, via JavaScript these questions are evaluated on-the-fly, the results are shown to the student.
2.2 Electronic Books
To generate an added value for print media the XQS technology used for MM*Stat has been successfully applied to books, which have been designed for 2nd year and above students. In the current implementation each book (see http://www.xplore-stat.de/ebooks/ebooks.html), its HTML version and the corresponding set of slides contain references to web pages on a webserver.
These HTML pages show the XploRe source code and allow to run the example in a Java applet. In addition to MM*Stat there is an additional mode which allows the student to completely modify the source code of the example.
Figure 2 depicts two screenshots from the bookApplied Multivariate Anal- ysis [HS2003]. On the left hand side the ’run’ version of the quantlet is shown, on the right the ’edit’ version.
Fig. 2. execute andedit versions of an ’Applied Multivariate Statistics’ example
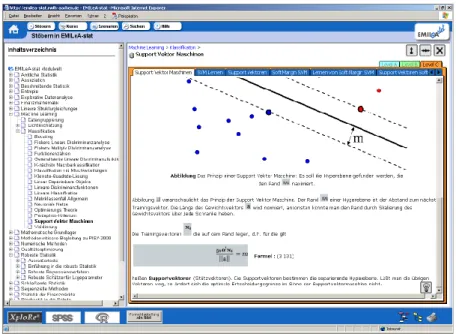
Fig. 3. e-stat: navigation toolbar and SVM example
2.3 e-stat
The aim of the e-stat project (http://emilea-stat.rwth-aachen.de/) was to deliver a significant contribution for the improvement of the practical statistical education. The content modules were provided as XML by the project partners, a consortium of nine German universities. The XML code was then equipped with dedicated views and scenarios. The targeted user
groups were not only students but also people with a general interest in statistics.
The various views and scenarios, which are linked to real-world applications include [CCK2002]:
• Method-based: Learning of methods along a predefined way of modules with terms, examples and exercises
• Problem-based: Based on a simplified description of the problem, a con- sulting component then proposes a suitable solution
• View-based: Problem description from specific areas serve as examples to deal with the underlying terms
To provide suitable information for different groups of users the e-stat system offers three levels (introductory, applied, advanced) of abstraction with increasing degrees of difficulty. Figure 3 shows a screenshot of the e-stat web site: On the left there is a list of all available modules which are then displayed in the right frame.
2.4 Q&A
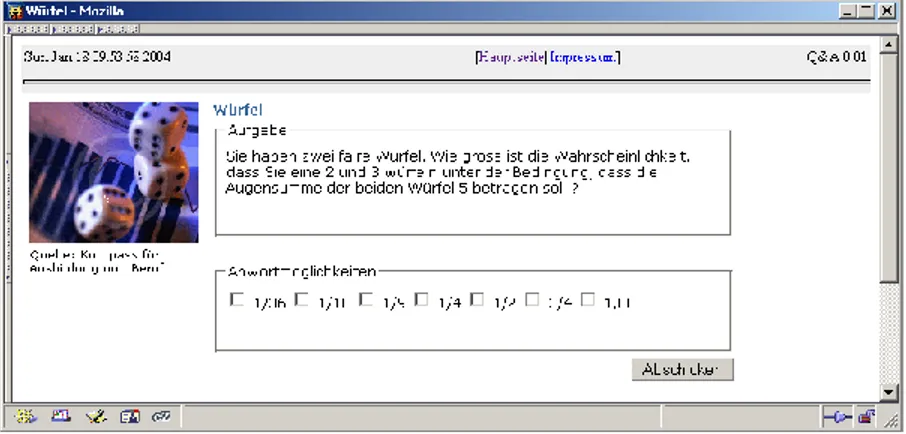
Fig. 4. A ’simple’ Q&A exercise: Throwing two dices.
The Q&A system [K2004] provides an interactive environment for the exam preparation in undergraduate courses of statistics. The platform handles two types of exercises: ’simple’ and ’variable’ exercises. For both types of exercises a problem is presented to the student with multiple choice answers, see Figure 4).
The homepage of the project ishttp://stirner.wiwi.hu-berlin.de/qa/.
Q&A allows to check for common student mistakes. Let us consider for example a simple exercise, shown in Figure 4. Assume two dices are thrown.
What is the probability that one dice shows ’2’ and the other ’3’ under the condition that the sum of both dices is ’5’ ?
Typically the students make two mistakes. They do not recognize that they have a) to compute a conditional probability and b) take into account that there are two elementary events.
Depending on the answers the student chooses, one can trace back what kind of mistakes they usually make. We categorized the answers of 215 students in seven classes:
1. a) wrong, b) wrong 23%,
2. a) wrong, b) correct 39%,
3. a) correct, b) wrong 6%,
4. a) correct, b) correct 16%,
5. not answered at all/other answers 11%,
6. an answer, which belongs to the other version 5%, As a reply to the first four groups of errors different web pages with hints on the correct solution are given.
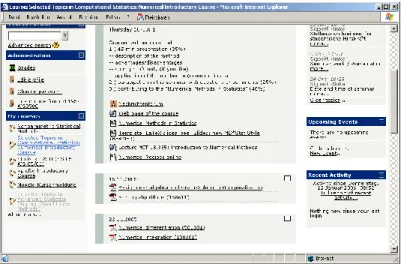
2.5 Moodle
Fig. 5. Numerical Introductory Course in the Moodle system
Moodle [K2005] is a course management system (CMS) - a free, Open Source software package designed using sound pedagogical principles, to help lecturers create effective online learning communities. Moodle has a large and diverse user community with over 75,000 registered users at http://moodle.org, covering 70 languages in 138 countries.
At Humboldt-Universit¨at zu Berlin the Moodle system is maintained by the ’Multimedia Lern- and Lehrzentrum’ from the computing center of the university. At ISE/CASE the work with Moodle started at the beginning of 2005; since that time it has been used for several courses at Bachelor and Master level.
Moodle allows to
1. structure lectures according to a set of topics or a time table,
2. maintain a class forum and forums related to each topic or date of the time table,
3. group students to solve different tasks or exercises,
4. upload and manage documents for lecturers, e.g. lecture slides, and students, e.g. solutions for exercises and
5. generate online exercises with direct evaluation.
The Moodle system, a screenshot is depicted in Figure 5, provides many more features, yet only a few have been used by the ISE. The first question that each lecturer should answer is: Why should one of their student use such a system? Our answer is that we have moved the teaching materials, e.g. slides, information about the grading process from the web pages of the institute to the Moodle system. Thus to download the formulary, the exercise collections or the slides the students have to enter the Moodle system. To receive an account the students have to provide a valid e-mail address, this allows us, together with the email features of Moodle, to make important announcements to the whole class.
2.6 Other Packages
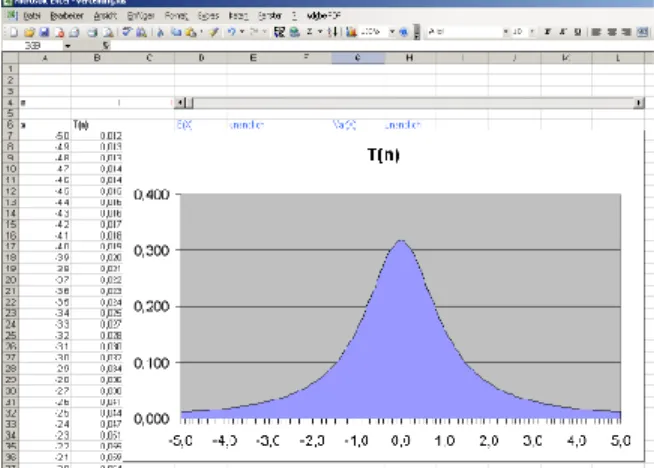
Although spreadsheet software such as Excel may not be the optimal choice for data analysis [MW2005], they are suitable tools for the statistics educa- tion. They are available on almost every computer and the majority of the students knows how to operate them. At ISE Excel sheets are mainly used in the education of undergraduate students, e.g. to visualize the Central Limit Theorem or parameter changes of distribution functions. The built-in functions are easily accessible, without knowing a high-level programming language such as Java or C++ formulas may be edited or graphical user interface components such as sliders, radiobuttons and pull-down menus be used. Figure 6 displays a screenshot of a spreadsheet to visualize eight different probability density functions, via sliders the parameters can be modified.
Fig. 6. Visualisation of parameter changes with Excel
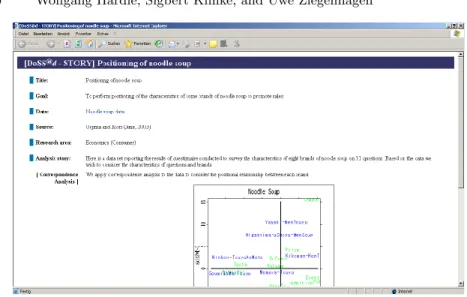
DoLStat@d [MYY2003] has been developed at Okayama University, Japan by Yuichi Mori and colleagues. This web based learning system, available on- line at http://mo161.soci.ous.ac.jp/@d/DoLStat/index.html, provides various courses which are classified into major categories such as ’General statistics’, ’Research field’ and ’Statistical method’. Each course contains real world data with their analysis stories, see Figure 7, which are from a data- oriented statistical database system. The provided data sets are designed for the learning purpose of the course and are ordered in educational perspective.
’Neue Statistik’ (http://www.neuestatistik.de/) is a multimedial teach- ing platform for statistics for German universities. The aim [G2002] was to replace the formal and mathematical way in the education of undergraduate students by a problem-oriented and practical approach. This includes the usage of animations, diagrams and video sequences. Part of the system is the free teaching software ’Statistiklabor’, which is based onR.
3 Evaluation
There are four different aspects in the work with e-learning environments, the technical, the content and the attitudes from lecturers and students.
For MM*Stat the issues arose mostly from the technical side. When MM*Stat was developed, the two leading web browsers were the partly in- compatible Netscape 4 and Internet Explorer 5, therefore the work focused on these two programs. Incompatibilities with newer browsers such as Internet Explorer 6 and Mozilla Firebird prevented the successful usage of MM*Stat
Fig. 7. Screenshot of a DoLStat story
inside the lectures and exercise classes. For languages such as Arab the La- TeX/LaTeX2HTML software does not provide enough support, here a huge load of manual work is necessary.
A statistical analysis of questionnaires among students revealed that MM*Stat partially replaced traditional media such as books for a signifi- cant proportion of students but did not lead to better grades.
The electronic books are HTML versions of printed books, enriched with interactive examples. These examples require the Java Runtime Environment which is an additional barrier for the usage. There were no further adjustments paying tribute to special requirements of electronic media. The quality of the content largely depends on the authors. Since the students prefer to have a printed copy of the book, the eBooks mainly serve as easily searchable encyclopedia.
The e-stat project mainly suffered from technical and content issues. The complicated structure of modules requires a certain amount of knowledge, especially of XML. Furthermore the different modules are diverse, in their quality and amount. For some modules there are extensive descriptions at all levels, for a large proportion of modules there are only information at one of three levels.
The basic idea of Q&A was that the student invests time on thinking about the correct answer for an exercise, however an analysis of the generated log files revealed an opposite behavior. Instead of carefully selecting an answer, the student usually click on the first solution, then the second,. . . until he or she has found the correct solution. Q&A also requires a significant amount
of work from the lecturer. For each common error a web page with hints and comments has to be written.
Specialized systems such as Moodle may provide advantages especially in terms of options for the multiple choice questions. However, the use of a standard software limits the flexibility in comparison with self-developed solutions, e.g. in the design of the answer pages.
Moodle differs from the other environments since its main purpose is to manage contents for lectures and to provide forums, chats and content storage for various types of lectures. However the complexity of Moodle requires an initial investment from the lecturer as they are forced to structure their lectures, either on topics or a time schedule. Furthermore they have to investigate which of the offered functionality is useful for their classes, as not each class may, e.g. require a student forum.
The use of electronic media for courses also requires adjustments in the way how students learn, they only accept such a technology if they have real advantages. From our experience students rarely use forums; even in lectures with a large audience, e.g. the introductory courses in statistics with nearly 500 students, more than 99% of the entries came from the lecturer himself, a test with anonymous accounts provided same results. Most students prefer to send their questions via email or consult the lecturer personally, but even the number of emails was considerably low. In our opinion the students are afraid of asking a ’foolish’ question and rather prefer the direct interaction from face to face. The use of forums even seems to cause, especially when anonymous accounts or webmailer account are enabled, a tendency to use inappropriate language. Several forums had to be closed at ISE due to insulting postings from the students.
4 Conclusion
A few years ago, e-learning in statistics was considered to be an absolute must have for the modern education of students. The experience has shown that the goals, which are connected with e-learning elements, are different for students, lecturers and developers. The developers were interested in the technically most sophisticated solutions, the lecturers in the proliferation of their materials and the students in an easy way to achieve enough knowledge to pass the exam.
Nowadays we see e-learning as valuable support tool to aid the learning process, but the problems which may arise in the work with e-learning tools are still manyfold. Besides technical problems such as the limitation to specific web browsers there are pedagogical issues and side effects as well.
Therefore our conclusion is that:
1. e-learning cannot replace the interaction of student, teacher and blackboard 2. e-learning tools can only be successful if they satisfy the need of all
participants of the system
The requirements for excellent electronic media in education are manyfold:
Robust and reliable technology, high-quality contents and the willingness to adjust the own behavior from both, the students and the lecturers.
References
[HS2003] H¨ardle, W., Simar, L. (2003): Applied multivariate statistical analysis, Springer Verlag, Heidelberg
[BHL2005] Borak, S., H¨ardle, W., Lehmann, H. (2005): Working with the XQC. In:
Cizek, P., H¨ardle, W., Weron, R. (eds) Statistical Tools for Finance and Insurance, Springer Verlag, Heidelberg
[CCK2002] Cramer, E., Cramer, C., Kamps, U. (2002): e-stat: A web-based learning environment in applied statistics. In: H¨ardle, W., R¨onz, B. (eds) COMP- STAT. Proceedings in Computational Statistics - 15th Symposium held in Berlin, Physika Verlag, Heidelberg, p. 309-315
[G2002] Grune, C. (2002): Neue Statistik, Talk at Learntec 2002, Karlsruhe [K2004] Klinke, S. (2004): Q&A - Variable multiple choice exercises with com-
mented answers. In: Antoch, J. (ed.) COMPSTAT. Proceedings in Computational Statistics - 16th Symposium held in Prague, Physika Verlag, Heidelberg, p. 1299-1304
[KW2002] Klinke, S., Witzel, R. (2002): MD*Book online - A tool for creating interactive documents. In: COMPSTAT. Proceedings in Computational Statistics - 15th Symposium held in Berlin, Physika Verlag, Heidelberg, p. 98-99
[MW2005] McCullogh, B.D., Wilson, B. (2005): On the accuracy of statistical procedures in Microsoft Excel 2003. In: Computational Statistics and Data Analysis, Volume 49, Number 4, p. 1244-1253
[MYY2003] Mori, Y., Yamamoto, Y. and Yadohisa, H. (2003): Data-oriented Learn- ing System of Statistics based on Analysis Scenario/Story (DoLStat).
Bulletin of the International Statistical Institute (ISI).
[K2005] Krist¨ofl, R. (2005): Evaluation von Lernplattformen: Verfahren, Ergeb- nisse und Empfehlungen, Report of the Austrian ministry for Education, Science and Culture,http://moodle.de/mod/resource/view.php?id=
706
SFB 649 Discussion Paper Series 2006
For a complete list of Discussion Papers published by the SFB 649, please visit http://sfb649.wiwi.hu-berlin.de.
001 "Calibration Risk for Exotic Options" by Kai Detlefsen and Wolfgang K.
Härdle, January 2006.
002 "Calibration Design of Implied Volatility Surfaces" by Kai Detlefsen and Wolfgang K. Härdle, January 2006.
003 "On the Appropriateness of Inappropriate VaR Models" by Wolfgang Härdle, Zdeněk Hlávka and Gerhard Stahl, January 2006.
004 "Regional Labor Markets, Network Externalities and Migration: The Case of German Reunification" by Harald Uhlig, January/February 2006.
005 "British Interest Rate Convergence between the US and Europe: A Recursive Cointegration Analysis" by Enzo Weber, January 2006.
006 "A Combined Approach for Segment-Specific Analysis of Market Basket Data" by Yasemin Boztuğ and Thomas Reutterer, January 2006.
007 "Robust utility maximization in a stochastic factor model" by Daniel Hernández–Hernández and Alexander Schied, January 2006.
008 "Economic Growth of Agglomerations and Geographic Concentration of Industries - Evidence for Germany" by Kurt Geppert, Martin Gornig and Axel Werwatz, January 2006.
009 "Institutions, Bargaining Power and Labor Shares" by Benjamin Bental and Dominique Demougin, January 2006.
010 "Common Functional Principal Components" by Michal Benko, Wolfgang Härdle and Alois Kneip, Jauary 2006.
011 "VAR Modeling for Dynamic Semiparametric Factors of Volatility Strings"
by Ralf Brüggemann, Wolfgang Härdle, Julius Mungo and Carsten Trenkler, February 2006.
012 "Bootstrapping Systems Cointegration Tests with a Prior Adjustment for Deterministic Terms" by Carsten Trenkler, February 2006.
013 "Penalties and Optimality in Financial Contracts: Taking Stock" by Michel A. Robe, Eva-Maria Steiger and Pierre-Armand Michel, February 2006.
014 "Core Labour Standards and FDI: Friends or Foes? The Case of Child Labour" by Sebastian Braun, February 2006.
015 "Graphical Data Representation in Bankruptcy Analysis" by Wolfgang Härdle, Rouslan Moro and Dorothea Schäfer, February 2006.
016 "Fiscal Policy Effects in the European Union" by Andreas Thams, February 2006.
017 "Estimation with the Nested Logit Model: Specifications and Software Particularities" by Nadja Silberhorn, Yasemin Boztuğ and Lutz Hildebrandt, March 2006.
018 "The Bologna Process: How student mobility affects multi-cultural skills and educational quality" by Lydia Mechtenberg and Roland Strausz, March 2006.
019 "Cheap Talk in the Classroom" by Lydia Mechtenberg, March 2006.
020 "Time Dependent Relative Risk Aversion" by Enzo Giacomini, Michael Handel and Wolfgang Härdle, March 2006.
021 "Finite Sample Properties of Impulse Response Intervals in SVECMs with Long-Run Identifying Restrictions" by Ralf Brüggemann, March 2006.
022 "Barrier Option Hedging under Constraints: A Viscosity Approach" by Imen Bentahar and Bruno Bouchard, March 2006.
SFB 649, Spandauer Straße 1, D-10178 Berlin http://sfb649.wiwi.hu-berlin.de
This research was supported by the Deutsche
Forschungsgemeinschaft through the SFB 649 "Economic Risk".
by Mathias Trabandt and Harald Uhlig, April 2006.
024 "e-Learning Statistics – A Selective Review" by Wolfgang Härdle, Sigbert Klinke and Uwe Ziegenhagen, April 2006.
SFB 649, Spandauer Straße 1, D-10178 Berlin http://sfb649.wiwi.hu-berlin.de
This research was supported by the Deutsche
Forschungsgemeinschaft through the SFB 649 "Economic Risk".