Download free articles on
HOW DO I FIND RELEVANT ARTICLES?
Alternative 1: Search by topic
If you are looking for articles regarding a specific topic, please go to “kostenfreie Artikel” (i.e. free articles, in the top right corner of our homepage). Take a look on the left-hand side. Here you find a complete list of the general terms in alphabetical order. Most of them are further divided into sub-themes. Just click on your topic of interest, and you will find the available relevant articles with their bibliographical data. In order to open and download the article, click on the articles title.
Alternative 2: Search by conference
If you are looking for articles regarding a specific conference/congress or book, please go to “Fachbücher” (i.e. reference books, in the top right corner of our homepage). Take a look on the left-hand side. Here you find a list of the themes, which are covered by our publications. Choose your field of interest. You will then see all relevant books listed in the order of their release date, starting with the latest publication. Once you find the right book, follow the link “Inhaltsverzeichnis” (i.e. table of content). In order to open and download an article published in the book, click on the articles title.
Alternative 3: Search by author
If you are looking for articles from a specific author, please go to the search field “Suchen…” (in the top right corner of our homepage). Enter the name of the author and you get a list of relevant results. Free, downloadable articles can be recognized by the [PDF] mark (on the left-hand side).
The database is still being worked on.
If you have problems finding your article, please contact us.
In case you are interested in more than one article of the same book, you might as well just order the book from us.
Dorfstraße 51
www. .de
Publisher: TK Verlag Karl Thomé-Kozmiensky, Nietwerder
34
0 1 1 2 3 3 18
28 33 37 39 41 44 51 54 57 63 65 73 75 77 79 79 82 84 85 87 99
0 2 50 24
35 42 52 49 35
52 36
33 34
17 16 20 16 2
20 20 10 9 0 1 10 0 1 0 0 0
50 57
7 42
65 57 47 50 62
45 47 39 34 46 45 38 40
47 27 24 27 26 27 25
13 21 21 18 16 16 13
1
50 40 42
0 10 20 30 40 50 60 70 80 90 100 percentage
%
Recycled and composted Incinerated Landfilled
waste generation • waste incineration • flue gas treatment • balancing and evaluation • bio waste • biogas • biomass • soil • steam generator • dismantling • landfill • emission trading • pyrolysis • solid recovered fuels • district heating, district cooling, process steam • odour • sewage sludge • corrosion and materials • logistics • mechanical-biological treatment • mechanical treatment • mineral by-products and wastes • co-incineration • electricity grids • photovoltaic • physical-chemical treatment • planning • legislation • recycling • residues • solar thermal energy • energy storage • drying • turbine and generator • underground storage and backfilling of mines • fan and stack • gasification • wind power • profitability
Pyrolysis/Gasification
Shaft Furnace Type Gasification and Direct Melting System
– Technology, Input Flexibility, Operational Characteristics and Emissions –
Nobuhiro Tanigaki, Ryo Makishi and Toshimi Nagata
1. Introduction ...440
2. Materials and methods ...441
2.1. Process description ...441
2.2. Plant description ...441
2.3. Feedstock property...442
3. Results and discussion ...442
3.1. Operational characteristics ...442
3.2. Effects of the equivalent ratios (ERs) ...444
3.3. Emissions ...445
3.4. Slag quality ...446
3.5. Heavy metal distribution ...447
4. Conclusions ...449
5. References ...449 Gasification of municipal solid waste has been widely researched all over the world and is recognized as an alternative thermal technology for waste treatment. The Direct Melting System is shaft-furnace type gasification and melting technology for various kinds of wastes. It has more than 40 references and has been operated for 36 years.
This gasification technology is employed to treat municipal solid waste, but can also treat various kinds of wastes together and can achieve both the energy and material recovery from waste in one process.
This paper reported about the waste flexibility of this gasification and melting techno- logy. The operating data and environmental impacts in the co-gasification of munici- pal solid waste with clinical waste, bottom ash, sewage sludge and landfill waste were reported. Despite of the waste processed, the co-gasification of municipal solid waste with other waste was stably operated and did not affect the operating conditions such as utilities, the temperature and compositions of the syngas produced. The environmental impacts of the flue gas discharged were also significantly low. These results indicate that this gasification system has possibilities to process municipal solid waste with waste to be difficult to process conventionally and recover energy and material from waste.
Pyrolysis/Gasification
1. Introduction
Gasification is the conversion of any carbonaceous fuel to a gaseous product with a useable heating value [5] and is widely used for energy conversion from coal and biomass. Gasification as an energy recovery method has been widely researched all over the world. There are many research papers especially on gasification of biomass [1, 2, 9].
Gasification of municipal solid waste (MSW) has been well-researched in Japan.
The development of MSW gasification technology was started in the 1970s in Japan.
Because of oil crisis in the 1970s, MSW into energy and recycling of MSW generated became a great interest. The Direct Melting System (DMS), which is the gasification and melting technology developed by Nippon Steel & Sumikin Engineering Co., Ltd., was introduced for commercial use in Kamaishi City, Japan in 1979. There were other gasification technologies developed for commercial use. Andco-Torrax system and Purox system were also employed as a gasification and melting technology for MSW. They were introduced in Hamamatsu City in 1980, and in Chichibu City in 1981, respectively. Dual fluidized bed gasifiers, was introduced in Funabashi City in 1979. However, only the DMS is still under operation.
The waste gasification technology with direct melting is a shaft-furnace type gasifi- cation and melting process and is classified as an atmospheric fixed bed gasifier. The gasification technology is in commercial operation at more than 40 plants in Japan and South Korea [8, 12 –15].
Waste to Energy (WtE), which indicates a power generation during waste processing, is a major interest especially in Europe. On the other hand, material recovery from wastes such as MSW and bottom ash is also becoming a major interest. Particularly, material recovery from MSW bottom ash is concerned [3] as well as reclamation waste from a landfill site, because it contains some valuable material and heavy metals such as gold, copper and ferrous and non-ferrous materials. Sewage sludge contains a lot of phosphorus which can be utilized as a fertilizer of agriculture. From the viewpoint of material recovery, energy recovery and final landfill amount reduction, co-treatment of many kinds of wastes with MSW could be one of the possibilities to solve these issues simultaneously. The gasification technology with direct melting can achieve these issues together. Bottom ash from incineration plants, reclamation waste from landfill site, and sewage sludge can be processed together with MSW in the gasification technology. Combustibles in these wastes are converted into energy via a steam boiler system and incombustibles are converted into recyclables such as slag and metal, which can facilitate minimizing the final landfill amount. This indi- cates that waste gasification with direct melting has a possibility to achieve both the energy and material recovery simultaneously.
In this study, waste gasification with direct melting for energy and material recovery, especially focused on the waste flexibility, were reported. The possibility of energy and material recovery from waste and the effects of co-gasification of MSW with other waste, such as incineration bottom ash, reclamation waste, sewage sludge,
Pyrolysis/Gasification
and clinical waste are evaluated. The equivalent ratio (ER), the mixing ratio of other wastes, syngas compositions and temperatures, slag qualities and the environmental impact of the flue gas are also reported.
2. Materials and methods 2.1. Process description
A detailed description of the DMS has already been given previously [14, 15]. Waste is charged into the gasifier without any pre-treatment, which is different from other gasi- fication technologies, such as fluidized bed gasifiers. Waste is directly charged into the gasifier from the top with coke and limestone. Waste is gradually dried and preheated in the upper section. Combustible waste is thermally decomposed in the second zone and syngas is transferred to the combustion chamber located downstream of the gasifier and completely burned. Incombustible waste descends to the combustion and melting zone at the bottom and is melted with the heat generated by coke burning. Molten materials are intermittently discharged from a tap hole, quenched with water and magnetically separated into slag and metal. The sensible heat in the flue gas discharged from the combustion chamber is recovered by a boiler and power is generated by a steam turbine.
2.2. Plant description
Table 1 shows the overview of the plants which conduct co-gasification of MSW with other other wastes. In Plant A, processing waste is only MSW and the capacity is 10 t/h.
Plant B process four kinds of waste, which are MSW, combustible waste, incombustible waste and bottom ash from other incinerators. Due to the strict regulation of bottom ash from incinerators in Japan (no recycling of bottom ash), this plant B processes bottom ash from other incinerators with MSW and minimizes final landfill amount recycling materials as slag and metal. Plant C has a small capacity of 2.1 t/h, where co-gasification of reclamation waste from landfill site is conducted. Sewage sludge and incombustible residues are processed with MSW in Plant D with the capacity of 8.3 t/h, 2 lines. Plant E has a capacity of 3.1 t/h and clinical waste with MSW is pro- cessed. Clinical waste is dumped in the waste pit and directly charged into the gasifier without any pre-treatment. All plants are under operation in Japan. A combustible dust collection and injection system is also applied except plant C and E [8, 15].
Table 1: Overview of the plants
The Plant A The Plant B The Plant C The Plant D The Plant E Capacity 10 t/h, 3 lines 11 t/h, 2 lines 2.1 t/h, 2 lines 8.3 t/h, 2 lines 3.1 t/h, 2 lines
Municipal Solid
Waste
Processing Municipal Solid Combustible Municipal Solid Municipal Solid Municipal Solid
Waste Waste Residues, Waste, Waste, Waste,
Incombustible Reclamation Sewage Sludge, Clinical Waste
Residues, Waste Incombustible
Bottom Ash Residues
Pyrolysis/Gasification
2.3. Feedstock property
Feedstock properties are shown in Table 2. Bottom ash processed in Plant B contains a high ash content of 76.4 %a.r.. This is quite higher than that of processing MSW in Japan [15]. Combustible residue in Plant B has a high net calorific value (NCV) of 27.3 MJ/kga.r., because its main physical component is vinyl and plastics. Incombustible residue in Plant B has a higher ash content of 47.2 %a.r., and the chlorine content is also high. Reclamation waste in Plant C consists mainly of moisture and ash, and contains few combustibles which leads a very low NCV of 1.1 MJ/kga.r.. Sewage sludge in Plant D consists mainly of moisture. This causes a low NCV of 1.1 MJ/kga.r.. The incombustible residue in Plant D contains 61.7 % of ash and 31.5 % of moisture and differs from the incombustible residue in Plant B. Plant E processed clinical waste but the analysis data is not available, due to the confidentiality of the hospital.
Table 2: Feedstock properties
Plant B Plant C Plant D
Bottom Com- Incom- Recla- Sewage Incom-
Ash bustible bustible mation Sludge bustible
Residue Residue Waste Residue
Proximate
Moisture %a.r. 17.9 11.8 12.5 31.0 80.2 31.5
Analysis Combustibles %a.r. 5.8 68.9 40.3 11.0 15.3 6.8
Ash %a.r. 76.4 19.3 47.2 58.0 4.5 61.7
C %a.r. 1.1 58.9 27.1 4.6 3.8 4.5
H %a.r. 0.0 9.8 3.6 0.3 0.5 1.1
Ultimate N %a.r. 0.0 0.4 0.4 0.2 0.0 < 0.1
Analysis O %a.r. 38.3 14.5 26.3 5.7 4.9 50.2
Cl %a.r. 0.53 0.51 0.66 0.0 0.1 10.7
S %a.r. 0.12 0.10 0.13 0.1 0.0 1.9
Paper %d.b. 0.0 14.6 1.0 1.3 – –
Vinyl and Plastics %d.b. 0.1 66.4 31.9 6.5 – –
Physical Wood %d.b. 0.0 3.8 2.5 0.3 – –
Compo- Biowaste %d.b. 0.0 0.0 0.0 0.2 – –
nents
Incombustibles %d.b. 42.9 10.1 19.4 16.1 – –
Others %d.b. 57.1 5.2 45.2 75.6 – –
Net Calorific Value MJ/kga.r. 0.0 27.3 11.3 1.1 1.1 < 0.2
3. Results and discussion 3.1. Operational characteristics
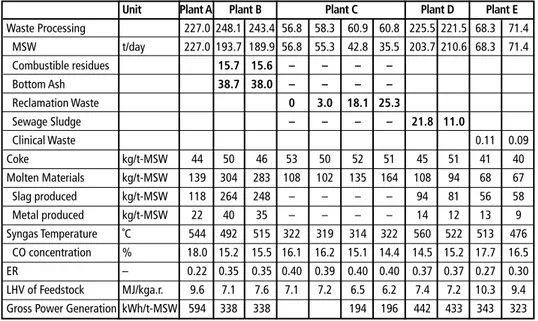
Table 3 shows the operation results of processing MSW with other waste. In all plant, waste including MSW and other waste was processed stably. In each plant, the pro- cessing amount of waste was set to be almost constant. When the mixing ratio of the other waste increased, the processing amount of the MSW decreased in order to keep the total processing waste amount constant. In all plants, the total processing amount was almost kept constant even when the mixing ratio of the other waste increased.
Pyrolysis/Gasification
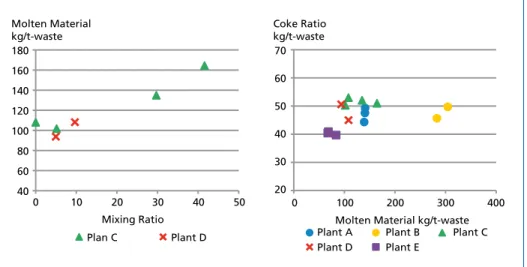
Figure 1 shows the relationship between the mixing ratios and the molten material amount. Plant A processed only MSW and Plant B always processed MSW with bottom ash, incombustible residues and combustible residues and Plant E always processed MSW with clinical waste with the same ratio. Therefore, the relationship in Plant C and D are shown in this left figure. In Plant C, the molten material amount increased with the mixing ratio increasing. Plant C processed reclamation waste, which contained 58 % of ash and small amount of combustibles. This gasification technology can con- vert most of inert materials in the processing waste into recyclable molten materials.
Because of this specification, the linier relationship, between the mixing ratio and the molten material amount, can be seen in the plant C. On the other hand, in Plant D, molten material amount was fluctuated and no relationship between mixing ratios and molten material amounts can be seen. As shown in Table 2, sewage sludge processed in Plant D contains only 4.5 % of ash. Major component of sewage sludge is moisture of 80.2 %. In this gasification technology, molten materials depend on the amount of inert materials such as slag and metal. Therefore, the mixing ratio of sewage sludge in Plant D didn’t affect the molten material amount from the gasifier.
Table 3: Operation results
Unit Plant A Plant B Plant C Plant D Plant E Waste Processing 227.0 248.1 243.4 56.8 58.3 60.9 60.8 225.5 221.5 68.3 71.4 MSW t/day 227.0 193.7 189.9 56.8 55.3 42.8 35.5 203.7 210.6 68.3 71.4
Combustible residues 15.7 15.6 – – – –
Bottom Ash 38.7 38.0 – – – –
Reclamation Waste 0 3.0 18.1 25.3
Sewage Sludge – – – – 21.8 11.0
Clinical Waste 0.11 0.09
Coke kg/t-MSW 44 50 46 53 50 52 51 45 51 41 40
Molten Materials kg/t-MSW 139 304 283 108 102 135 164 108 94 68 67 Slag produced kg/t-MSW 118 264 248 – – – – 94 81 56 58
Metal produced kg/t-MSW 22 40 35 – – – – 14 12 13 9
Syngas Temperature ˚C 544 492 515 322 319 314 322 560 522 513 476 CO concentration % 18.0 15.2 15.5 16.1 16.2 15.1 14.4 14.5 15.2 17.7 16.5 ER – 0.22 0.35 0.35 0.40 0.39 0.40 0.40 0.37 0.37 0.27 0.30 LHV of Feedstock MJ/kga.r. 9.6 7.1 7.6 7.1 7.2 6.5 6.2 7.4 7.2 10.3 9.4 Gross Power Generation kWh/t-MSW 594 338 338 194 196 442 433 343 323
Figure 1 also shows the relationship between the molten material amount and coke ratios (right figure). In this gasification technology, most of the ash are converted to slag and metal, and discharged as molten materials. The highest molten materials discharge was seen in Plant B because it processed bottom ash and other residues, which has high ash content. No linier relationship between molten materials and coke amount was seen. These results clarified that the coke ratios for this gasification technology has no relationship with an ash content of feedstock. In other words, the coke ratios are not affected to the mixing ratio of other waste.
Pyrolysis/Gasification
Figure 2 shows the relationship between LHVs of the waste processed and gross po- wer generation. The higher LHVs increased, the higher gross power generations were achieved. The linier relationship between LHVs and gross power generation can be seen. On the other hand, several liner relationships can be seen in this figure. The power
Molten Material kg/t-waste
Mixing Ratio
Coke Ratio kg/t-waste
Molten Material kg/t-waste 180
160 140 120 100 80 60 40
70 60 50 40 30 20
Plan C Plant D
0 10 20 30 40 50 0 100 200 300 400
Plant A Plant D
Plant B Plant E
Plant C
Figure 1: Effects of molten materials on mixing ratios and coke ratios
Power Generation kWh/t-gross
LHV 700
600 500 400 300 200 100
05 06 07 08 09 10 11
Plant A Plant D
Plant B Plant E
Plant C
Figure 2: Relationship between LHV and gross power generation
generation of Plant C and E is lower than that of Plant A, B and D. This can be ex- plained by the steam condition of the boiler system. The steam condition of the Plant C and E are 25 bar, 300 degrees com- pared to 40 bar, 400 degrees of the Plant A, B and D. In addition, the gross power generation in Plant B is lower than Plant A and D. This can be explained by the type of flue gas cleaning system. Plant B employs the wet scrubber system instead of the dry system which is employed in other plants.
Furthermore, Plant A showed the highest gross power generation due to the higher steam parameter with water-cooled con- denser system.
3.2. Effects of the equivalent ratios (ERs)
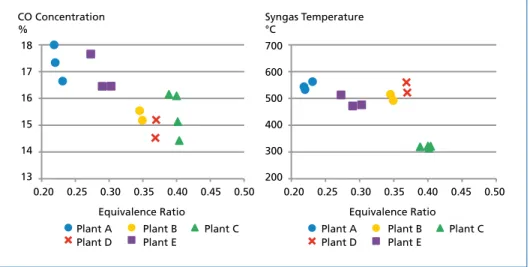
The left figure of Figure 3 shows that the relationship between the equivalence ratios (ERs) and carbon monoxide (CO) concentrations in the syngas produced from the gasifier. The ER is defined as a ratio of total injected oxygen amount against the stoichi- ometric oxygen amount of feedstock, shown in Eq. (1) [15].
Pyrolysis/Gasification ER[%] = (Total injected oxygen amount)/Stoichiometric oxygen amount of feedstock × 100 (1) The ERs ranged from 0.22 to 0.40. The CO concentrations in the syngas decreased with the ERs increasing. This tendency is explained by partial oxidation reactions. With the ERs increasing, syngas and char are partially oxidized in the gasification and melting furnace and this leads to the increase of CO2. The similar tendencies have been seen in previous studies [2, 6, 9].
Figure 3 also shows the relationship between the ERs and syngas temperatures (right figure). No relationship between the ERs and the syngas temperatures could be seen.
Theoretically, due to the partial combustion of the syngas produced, the syngas tem- perature increases with the ER increasing. However, the syngas temperatures are the results of various reactions and parameters in the gasifier, no relationship between the ERs and the syngas temperatures can be seen in this study.
CO Concentration
%
Equivalence Ratio
Syngas Temperature
°C
Equivalence Ratio Plant A
Plant D
Plant B Plant E
Plant C Plant A
Plant D
Plant B Plant E
Plant C 18
17 16 15 14 13
700 600 500 400 300 200
0.20 0.25 0.30 0.35 0.40 0.45 0.50 0.20 0.25 0.30 0.35 0.40 0.45 0.50
Figure 3: Effects of ERs on CO and syngas temperatures
3.3. Emissions
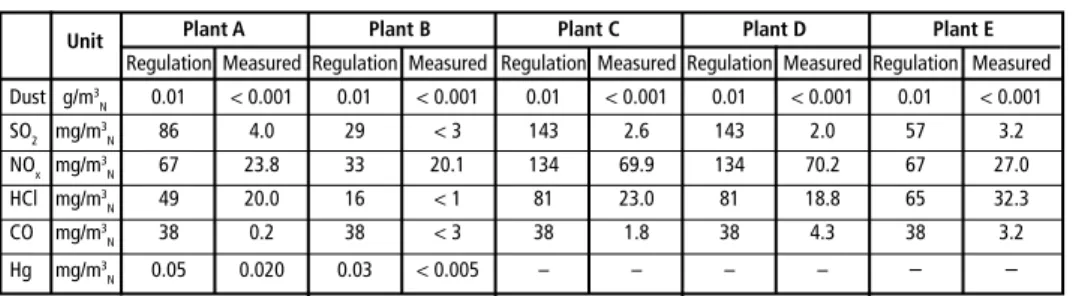
Table 4 shows the results of emissions of the flue gas. Depend on the plants, the required regulation is varied. Among these plants, Plant B is required the most severe regulations.
On the other hand, required upper limits of hydrogen chloride (HCl) and Nitrogen oxides (NOx) in Plant D are 81 mg/m3N and 134 mg/m3N, respectively.
In all plants, dust concentrations in the flue gas were less than 1 mg/m3N and much lower than the regulation. Sulfur dioxide (SO2) concentration ranged from 2.0 mg/m3N to 4.0 mg/m3N. NOx concentration widely ranged between 20.1 mg/m3N and 70.2 mg/m3N due to its regulated values. HCl concentration in Plant B was less than 1 mg/m3N, which was much lower than other plants. Plant B applies a wet-scrubber system for the flue gas cleaning because of its regulation. Other plants employ dry flue gas cleaning systems, which is an injection of slaked lime before a baghouse.
Pyrolysis/Gasification
Therefore, Plant B achieved much lower HCl concentration in the flue gas. Carbon monoxide (CO) ranged from 0.2 to 4.3 and much lower than the required values in every plant. The mercury concentrations analyzed in Plant A and B were low, especially in Plant B. This result was caused by the application of a wet-scrubber in the flue gas cleaning system, which removed mercury.
As shown in Table 4, in every plant, the emissions of the flue gas were significantly lower than the regulation values. These results indicate that co-gasification of MSW with various kinds of other wastes such as bottom ash, reclamation waste, sewage sludge or clinical waste causes no negative impacts on the emissions from the system to the environment.
Table 4: Emissions of the flue gas
Unit Plant A Plant B Plant C Plant D Plant E
Regulation Measured Regulation Measured Regulation Measured Regulation Measured Regulation Measured Dust g/m3N 0.01 < 0.001 0.01 < 0.001 0.01 < 0.001 0.01 < 0.001 0.01 < 0.001
SO2 mg/m3N 86 4.0 29 < 3 143 2.6 143 2.0 57 3.2
NOx mg/m3N 67 23.8 33 20.1 134 69.9 134 70.2 67 27.0
HCl mg/m3N 49 20.0 16 < 1 81 23.0 81 18.8 65 32.3
CO mg/m3N 38 0.2 38 < 3 38 1.8 38 4.3 38 3.2
Hg mg/m3N 0.05 0.020 0.03 < 0.005 – – – – – –
*The regulations in Plant A to E are SO2: 10 to 50 ppm, NOx: 50 to 100 ppm, HCl: 10 to 50 ppm, CO: 30 ppm
3.4. Slag quality
Table 5 shows the results of the slag leaching tests (in compliance with JIS K0058).
These results show that the slag produced contains almost no harmful heavy metals such as lead. The value of lead resulting from the slag leaching tests was less than 0.005
Pb mg/kg
mixing ratio % 160
140 120 100 80 60 40 20 0
Plant C regulation
0 5 10 15 20
Figure 4: Relationship between mixing ratio and Pb acid-extraction amount
mg/l, which was remarkably lower than the target reference (less than 0.01 mg/l).
According to a thermodynamics calcula- tion, lead and zinc in the form of sulfide or oxide are moved to slag and it is showed [10], [7] that a high temperature reducing atmosphere is effective in preventing the formation of lead and zinc sulfide or oxide.
Because of these reactions, the slag con- tains little lead and zinc.
Figure 4 shows the relationship between the mixing ratio of the other waste and the Pb acid-extraction amount. Only the result of Plant C, which processes recla- mation waste with MSW, is shown in the figure. The Pb acid-extraction amount was 5, 26, 33 mg/kg when the mixing ratio was
Pyrolysis/Gasification Table 5: Result of slag leaching test
Target reference Plant A Plant B Plant C Plant D Plant E Cd mg/l < 0.01 < 0.005 < 0.001 < 0.001 < 0.001 < 0.001 Pb mg/l < 0.01 < 0.005 < 0.005 < 0.001 < 0.005 < 0.005 Cr+6 mg/l < 0.05 < 0.02 < 0.01 < 0.01 < 0.01 < 0.02 Leaching As mg/l < 0.01 < 0.005 < 0.005 < 0.001 < 0.005 < 0.005 test Hg mg/l < 0.0005 < 0.0005 < 0.0005 < 0.0005 < 0.0005 < 0.0005
Se mg/l < 0.01 < 0.005 < 0.002 < 0.001 < 0.002 < 0.002
F mg/l 0.1 0.11 < 0.08 < 0.08 < 0.08
B mg/l < 0.1 < 0.02 < 0.1 < 0.1 < 0.1 Cd mg/kg < 150 < 1.5 < 5 < 1 < 1 < 10
Pb mg/kg < 150 11 14 5 3 < 15
Acid- Cr+6 mg/kg < 250 < 2.5 < 2 < 5 < 2 < 10 extraction As mg/kg < 150 < 1.5 < 0.5 < 1 < 1 < 10 test Hg mg/kg < 15 < 0.15 < 0.05 < 0.5 < 0.1 < 1
Se mg/kg < 50 < 1.5 < 0.5 < 1 < 1 < 10
F mg/kg < 4000 120 98 130 140 < 400
B mg/kg < 4000 170 320 210 170 < 400
1.2, 8.0, 18.1 %, respectively. The linier relationship can be seen in the figure. However, even when the mixing ratio of the reclamation waste increased, the leaching amount was still remarkably lower than the Japanese regulation.
These results indicate that co-gasification of MSW with various kinds of other wastes such as bottom ash, reclamation waste, sewage sludge or clinical waste causes no nega- tive impacts on the quality of slag and can be recycled. In other words, this gasification technology can contribute to material recovery not only with the MSW but also with other waste.
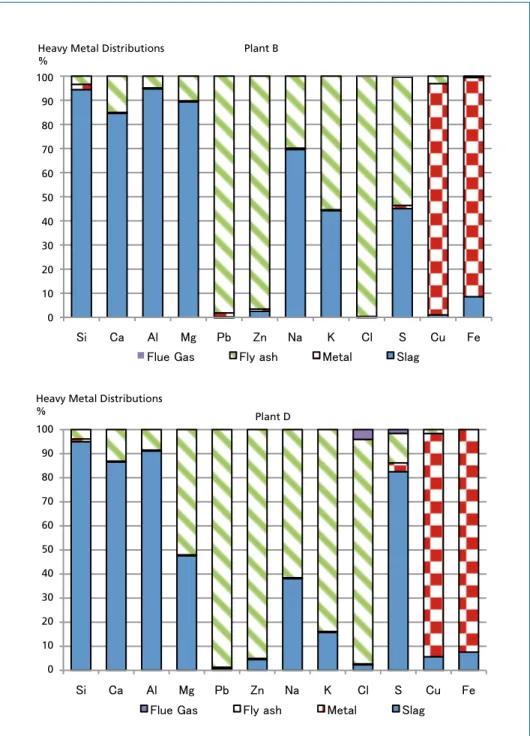
3.5. Heavy metal distribution
Heavy metal distribution is one of the important factors in the waste processing, es- pecially in the co-gasification of MSW with other wastes. Fig. 5 shows the result of the heavy metal distribution in Plant B and D.
Most of the low-boiling point heavy metals, such as lead and zinc, were distributed in fly ash. The distribution ratio of lead in fly ash in plant B and D were 98.1 % and 98.7 %, respectively. Those of zinc were 96.5 % and 97.4 %, respectively. Most high-boiling point heavy metals such as iron and copper are distributed in metal, at respective distribution rates 90.9 % and 95.9 % in Plant B, and 91.0 % and 88.0 %, respectively, in Plant D. Most silicon, calcium, aluminum and magnesium were distributed to slag in both plants.
According to the European Commission [4], lead and zinc are distributed to fly ash with values of 28 % (± 5 %) and 54 % (± 5 %), respectively. However, 72 % of lead and 46 % of zinc is distributed to bottom ash. Similar results were reported previously [11]. Compared with incineration systems, significant difference were found in the distribution ratios of lead and zinc to fly ash.
Pyrolysis/Gasification
These results indicate that toxic heavy metals, such as lead and zinc, are distributed to fly ash and few heavy metals remains in slag and metal, regardless of the pro- cessing waste.
Heavy Metal Distributions
%
Heavy Metal Distributions
% Plant D
Plant B 100
90 80 70 60 50 40 30 20 10 0
100 90 80 70 60 50 40 30 20 10 0
Figure 5: Heavy metal distribution
Pyrolysis/Gasification
4. Conclusions
This paper reported a waste gasification technology with direct melting, which has the world largest gasification references and achieve the energy and material recovery simultaneously. The first waste gasification technology has been operated since 1979.
Especially, this paper reported about the waste flexibility of this gasification techno- logy, which is one of the biggest advantages of this system. The operating data and environmental impacts in the co-gasification of municipal solid waste with clinical waste, bottom ash, sewage sludge and landfill waste were reported. Despite of the waste processed, the co-gasification of municipal solid waste with other waste was stably operated and did not affect the operating conditions such as utilities, the temperature and compositions of the syngas produced. The environmental impacts of the flue gas discharged were also significantly low.
From the material recycling point of view, the quality of the recyclables and distribu- tions of heavy metals were also investigated. The slag produced contained little harmful heavy metals such as lead and zinc, which can be recycled as secondary materials such as asphalt and interlocking blocks. Heavy metals distributions in the system followed thermodynamic behaviors. In any cases, more than 95 % of lead and zinc are distributed in fly ash. On the other hand, most of copper and iron are recovered as metal. These results indicate that the distributions of heavy metals are stable and thermodynamic behavior of heavy metals is independent on the processed waste. In other words, this gasification system has possibilities to achieve the Zero Waste recycling not only slag and metal containing no heavy metals but also fly ash which heavy metals are highly concentrated, separately.
These results indicate that the co-gasification of municipal solid waste with other waste contributes to minimizing the final landfill amount and has great possibilities for maximizing material recovery and energy recovery from waste.
5. References
[1] Aigner, I.; Pfeifer, C.; Hofbauer, H.; Fuel, 90, 2404-2412, 2011
[2] Arena, U.; Zaccariello, L.; Mastellone, M.L. (2010): Waste Management, 30, 1212–1219 [3] De Boom, A.; Degrez, M.; Hubaux, P.; Lucion, C. (2011): Waste Management 31, pp. 1505-1513 [4] European Commission, (2006): Integrated Pollution Prevention and Control, Reference Docu-
ment on the Best Available Techniques for Waste Incineration
[5] Higman, C.; van der Burgt, M.: Gasification. Gulf Professional Publishing, United States of America, 2003
[6] Li, X.T.; Grace, J.R.; Lim, C.J.; Watkinson, A.P.; Chen, H.P.; Kim, J.R.; (2004): Biomass and Bioenergy 26, pp. 171-193
[7] Lv, P.M.; Xiong, Z.H.; Chang, J.; Wu, C.Z.; Chen, Y.; Zhu, J.X.; (2004): Bioresource Technology 95, pp. 95-101
[8] Manako, K.; Kashiwabara, T.; Kobata, H.; Osada, M.; Takeuti, S.; Mishima T. (2007): Proceedings of DIOXIN 2007 International Symposium, pp. 940-943
Pyrolysis/Gasification
[9] Mastellone, M.L.; Zaccariello, L.; Arena, U.; Fuel, 89, 2991-3000, 2010
[10] Nakata, H., Mihara, N., Kawaguchi, Y., Osada, S., Kuchar, D., Matsuda, H., 2008. Journal of Material Cycles Waste Management 10, pp. 19-23
[11] Osada, S.; Kuchar, D.; Matsuda, H. (2010): Journal of Material Cycles Waste Management 12, pp. 83–92
[12] Osada, M.; Tanigaki, N.; Takahashi, S.; Sakai, S. (2008): Journal of Material Cycles and Waste Management, 93-101
[13] Tanigaki, N.; Fujinaga, Y.; Kajiyama, H.; Ishida, Y.; (2013) Waste Management & Research 31, 11, 1118-1124
[14] Tanigaki, N.; Ishida, Y.; (2014) Waste Gasification Technology with Direct Melting for Energy and Material Recovery . In: Thomé-Kozmiensky, K. J.; Thiel, S. (Eds.): Waste Management – Waste-to-Energy–; Nietwerder: TK Verlag Karl Thomé-Kozmiensky, pp. 365-377
[15] Tanigaki, N.; Manako, K.; Osada, M. (2012): Waste Management, 32, pp. 667–675
Dorfstraße 51 D-16816 Nietwerder-Neuruppin Tel. +49.3391-45.45-0 • Fax +49.3391-45.45-10
Bestellungen unter www. .de
oder
Energie aus Abfall
Energie aus Abfall, Band 1 (2006) ISBN: 978-3-935317-24-5 Hardcover: 594 Seiten mit
farbigen Abbildungen Preis: 30,00 EUR
Energie aus Abfall, Band 2 (2007) ISBN: 978-3-935317-26-9 Hardcover: 713 Seiten mit
farbigen Abbildungen Preis: 30,00 EUR
Energie aus Abfall, Band 3 (2007) ISBN: 978-3-935317-30-6 Hardcover: 613 Seiten mit
farbigen Abbildungen Preis: 30,00 EUR
Energie aus Abfall, Band 4 (2008) ISBN: 978-3-935317-32-0 Hardcover: 649 Seiten mit
farbigen Abbildungen Preis: 30,00 EUR Energie aus Abfall, Band 5 (2008)
ISBN: 978-3-935317-34-4 Hardcover: 821 Seiten mit
farbigen Abbildungen Preis: 30,00 EUR
Energie aus Abfall, Band 6 (2009) ISBN: 978-3-935317-39-9 Hardcover: 846 Seiten mit
farbigen Abbildungen Preis: 30,00 EUR
Energie aus Abfall, Band 7 (2010) ISBN: 978-3-935317-46-7 Hardcover: 765 Seiten mit
farbigen Abbildungen Preis: 30,00 EUR
Energie aus Abfall, Band 8 (2011) ISBN: 978-3-935317-60-3 Hardcover: 806 Seiten mit
farbigen Abbildungen Preis: 30,00 EUR
Paketpreis
Energie aus Abfall, Band 1 bis 12
330,00 EUR
statt 440,00 EUR
Herausgeber: Karl J. Thomé-Kozmiensky und Michael Beckmann • Verlag: TK Verlag Karl Thomé-Kozmiensky
Thomé-Kozmiensky und Beckmann Energie aus Abfall 11Thomé-Kozmiensky und Beckmann Energie aus Abfall 11 Thomé-Kozmiensky und Beckmann Energie aus Abfall 10 Thomé-Kozmiensky und Beckmann Energie aus Abfall 10 Thomé-Kozmiensky und Beckmann Energie aus Abfall 9 Thomé-Kozmiensky und Beckmann Energie aus Abfall 9
Thomé-Kozmiensky und Beckmann Energie aus Abfall 8
Thomé-Kozmiensky und Beckmann Energie aus Abfall 8
Thomé-Kozmiensky und Beckmann Energie aus Abfall 7 Thomé-Kozmiensky und Beckmann Energie aus Abfall 7
Thomé-Kozmiensky und Beckmann Energie aus Abfall 6 Thomé-Kozmiensky und Beckmann Energie aus Abfall 6
Thomé-Kozmiensky und Beckmann Energie aus Abfall 5 Thomé-Kozmiensky und Beckmann Energie aus Abfall 5
Thomé-Kozmiensky und Beckmann Energie aus Abfall 4 Thomé-Kozmiensky und Beckmann Energie aus Abfall 4
Thomé-Kozmiensky und Beckmann Energie aus Abfall 3 Thomé-Kozmiensky und Beckmann Energie aus Abfall 3
Thomé-Kozmiensky Beckmann Energie aus Abfall 2 Thomé-Kozmiensky Beckmann
Thomé-Kozmiensky Beckmann Thomé-Kozmiensky Beckmann Thomé-Kozmiensky Beckmann Thomé-Kozmiensky Beckmann Thomé-Kozmiensky Beckmann Thomé-Kozmiensky Beckmann Thomé-Kozmiensky Beckmann Thomé-Kozmiensky Beckmann Thomé-Kozmiensky Beckmann Thomé-Kozmiensky Beckmann Thomé-Kozmiensky Beckmann Thomé-Kozmiensky Beckmann Thomé-Kozmiensky Beckmann Thomé-Kozmiensky Beckmann Thomé-Kozmiensky Beckmann Thomé-Kozmiensky Beckmann Thomé-Kozmiensky Beckmann Thomé-Kozmiensky Beckmann Thomé-Kozmiensky Beckmann Thomé-Kozmiensky Beckmann Thomé-Kozmiensky Beckmann
Thomé-Kozmiensky Beckmann Energie aus Abfall 2 Energie aus Abfall 2 Energie aus Abfall 2 Energie aus Abfall 2 Energie aus Abfall 2 Energie aus Abfall 2 Energie aus Abfall 2 Energie aus Abfall 2 Energie aus Abfall 2 Energie aus Abfall 2 Energie aus Abfall 2 Energie aus Abfall 2 Energie aus Abfall 2 Energie aus Abfall 2 Energie aus Abfall 2 Energie aus Abfall 2 Energie aus Abfall 2
Thomé-KozmienskyBeckmann Energie aus Abfall 1Thomé-KozmienskThomé-KozmienskThomé-KozmienskThomé-KozmienskThomé-KozmienskThomé-KozmienskThomé-KozmienskThomé-KozmienskThomé-KozmienskThomé-KozmienskThomé-KozmienskThomé-KozmienskThomé-KozmienskyBeckmannBeckmannBeckmannBeckmannBeckmannBeckmannBeckmann Energie aus Abfall 1 Energie aus Abfall 1 Energie aus Abfall 1 Energie aus Abfall 1 Energie aus Abfall 1 Energie aus Abfall 1 Energie aus Abfall 1 Energie aus Abfall 1 Energie aus Abfall 1 Energie aus Abfall 1 Energie aus Abfall 1 Energie aus Abfall 1 Energie aus Abfall 1 Energie aus Abfall 1
Thomé-Kozmiensky und Beckmann Energie aus Abfall 12 Thomé-Kozmiensky und Beckmann Energie aus Abfall 12
Energie aus Abfall, Band 11 (2014) ISBN: 978-3-944310-06-0 Hardcover: 977 Seiten mit
farbigen Abbildungen Preis: 50,00 EUR Energie aus Abfall, Band 10 (2013)
ISBN: 978-3-935317-92-4 Hardcover: 1.096 Seiten mit
farbigen Abbildungen Preis: 50,00 EUR Energie aus Abfall, Band 9 (2012)
ISBN: 978-3-935317-78-8 Hardcover: 809 Seiten mit
farbigen Abbildungen Preis: 50,00 EUR
Energie aus Abfall, Band 12 (2015) ISBN: 978-3-944310-18-3 Hardcover: 666 Seiten mit
farbigen Abbildungen Preis: 50,00 EUR
Bibliografische Information der Deutschen Nationalbibliothek Die Deutsche Nationalbibliothek verzeichnet diese Publikation in der Deutschen Nationalbibliografie; detaillierte bibliografische Daten sind im Internet über http://dnb.dnb.de abrufbar
Thomé-Kozmiensky, K. J.; Thiel, S. (Eds.): Waste Management, Volume 5 – Waste-to-Energy –
ISBN 978-3-944310-22-0 TK Verlag Karl Thomé-Kozmiensky
Copyright: Professor Dr.-Ing. habil. Dr. h. c. Karl J. Thomé-Kozmiensky All rights reserved
Publisher: TK Verlag Karl Thomé-Kozmiensky • Neuruppin 2015
Editorial office: Professor Dr.-Ing. habil. Dr. h. c. Karl J. Thomé-Kozmiensky, Dr.-Ing. Stephanie Thiel, M. Sc. Elisabeth Thomé-Kozmiensky.
Layout: Sandra Peters, Ginette Teske, Janin Burbott-Seidel, Claudia Naumann-Deppe Printing: Universal Medien GmbH, Munich
This work is protected by copyright. The rights founded by this, particularly those of translation, reprinting, lecturing, extraction of illustrations and tables, broadcasting, micro- filming or reproduction by other means and storing in a retrieval system, remain reserved, even for exploitation only of excerpts. Reproduction of this work or of part of this work, also in individual cases, is only permissible within the limits of the legal provisions of the copyright law of the Federal Republic of Germany from 9 September 1965 in the currently valid revision. There is a fundamental duty to pay for this. Infringements are subject to the penal provisions of the copyright law.
The repeating of commonly used names, trade names, goods descriptions etc. in this work does not permit, even without specific mention, the assumption that such names are to be considered free under the terms of the law concerning goods descriptions and trade mark protection and can thus be used by anyone.
Should reference be made in this work, directly or indirectly, to laws, regulations or guide- lines, e.g. DIN, VDI, VDE, VGB, or these are quoted from, then the publisher cannot ac- cept any guarantee for correctness, completeness or currency. It is recommended to refer to the complete regulations or guidelines in their currently valid versions if required for ones own work.