Policy Research Working Paper 6883
What a Difference a State Makes
Health Reform in Andhra Pradesh
Sofi Bergkvist Adam Wagstaff Anuradha Katyal
Prabal V. Singh Amit Samarth
Mala Rao
The World Bank
Development Research Group
Human Development and Public Services Team May 2014
Public Disclosure Authorized Public Disclosure Authorized Public Disclosure Authorized Public Disclosure Authorized
Produced by the Research Support Team
Abstract
The Policy Research Working Paper Series disseminates the findings of work in progress to encourage the exchange of ideas about development issues. An objective of the series is to get the findings out quickly, even if the presentations are less than fully polished. The papers carry the names of the authors and should be cited accordingly. The findings, interpretations, and conclusions expressed in this paper are entirely those of the authors. They do not necessarily represent the views of the International Bank for Reconstruction and Development/World Bank and its affiliated organizations, or those of the Executive Directors of the World Bank or the governments they represent.
In the mid-2000s, India began rolling out large-scale, publicly-financed health insurance schemes mostly targeting the poor. This paper describes and analyzes Andhra Pradesh’s Aarogyasri scheme, which covers against the costs of around 900 high-cost procedures delivered in secondary and tertiary hospitals. Using a new household survey, the authors find that 80 percent of families are eligible, equal to about 68 million people, and 85 percent of these families know they are covered;
only one-quarter, however, know that the benefit package is limited. The study finds that, contrary to the rules of the program, patients incur quite large out-of- pocket payments during inpatient episodes thought to be covered by Aarogyasri. In the absence of data and program design features that would allow for a rigorous impact evaluation, a comparison is made between Andhra Pradesh and neighboring Maharashtra over an eight-year
This paper is a product of the Human Development and Public Services Team, Development Research Group. It is part of a larger effort by the World Bank to provide open access to its research and make a contribution to development policy discussions around the world. Policy Research Working Papers are also posted on the Web at http://econ.worldbank.org.
The authors may be contacted at awagstaff@worldbank.org.
period spanning the scheme’s introduction. During this period, Maharashtra did not introduce any at-scale health initiative that was not also introduced in Andhra Pradesh.
Andhra Pradesh other health initiatives were considerably
less ambitious and costly than Aarogyasri. The paper
finds that Andhra Pradesh recorded faster growth than
Maharashtra (even after adjusting for confounders) in
inpatient admissions per capita (for all income groups)
and in surgery admissions (among the poor only), slower
growth in out-of-pocket payments for inpatient care
(in total and per admission, but only among the better
off), and slower growth in transport and outpatient out-
of-pocket costs. The paper argues that these results are
consistent with Aarogyasri having the intended effects,
but also with minor health initiatives in Andhra Pradesh
(especially the ambulance program) playing a role.
Health Reform in Andhra Pradesh
Sofi Bergkvist
a, Adam Wagstaff
b, Anuradha Katyal
a, Prabal V. Singh
c, Amit Samarth
d, and Mala Rao
e,fa ACCESS Health International, Hyderabad, India
b Development Research Group, The World Bank, Washington DC, USA
c Oxford Policy Management, New Delhi, India
d SughaVazhvu Healthcare, Thanjavur, India
e Administrative Staff College of India, Hyderabad, India
f University of East London, London, United Kingdom
Corresponding author and contact details: Adam Wagstaff, World Bank, 1818 H Street NW, Washington, D.C. 20433, USA. Tel. (202) 473-0566. Fax (202)-522 1153. Email: awagstaff@worldbank.org.
Keywords: India; health insurance.
JEL code: I1
Acknowledgements: The research reported in the paper was supported by Canada’s International Development Research Center, the Wellcome Trust, the UK’s Department for International Development, the Rockefeller Foundation, and the World Bank. During the period of research leading up to this paper, Sofi Bergkvist was also with the Indian School of Business, Hyderabad, and Prabal V Singh and Amit Samarth were with ACCESS Health International. We are grateful to: Sayantee Jana and Siddhartha Nandy, who organized and analyzed secondary data; Bhimasankaram Pochiraju, Sundaresh Peri, C Ravi, and Rahul Ahluwalia for their advice and guidance at various stages of the study design and data analysis; P Suryanarayana, CM Reddy, D Chakrapani, K Pandu Ranga Reddy and AY Jadhav and his colleagues for their contribution to the training of the survey teams, verification of the survey and data collection; the IMRB International Social Research Institute team for their work on the survey; Sujatha Rao for her encouragement and valuable suggestions and ideas throughout the course of the study; Jay Bagaria for her help during the early stage of the development of the proposal; PV Ramesh without whose constant support, guidance and encouragement, this study would not have been possible; and the World Bank’s India health team who provided financial support towards the costs of Adam Wagstaff’s involvement, supported the study through its representation on the steering/advisory group, gave advice on the design and execution of the study, and provided very helpful comments on an earlier draft. The findings, interpretations and conclusions expressed in this paper are entirely those of the authors, and do not necessarily represent the views of the aforementioned individuals, the institutions they work for, the World Bank, its Executive Directors, or the governments of the countries the World Bank’s Executive Directors represent, including the government of India.
1. Introduction
Low and middle income countries – and some high income countries too – are in the midst of a major push toward providing coverage against the costs of health care for a larger share of population, especially those toward the bottom of the income distribution.
1Key differences across such initiatives include: the section of the population that is covered; the range of services that are covered and the financial coverage; how the target population enrolls and how much they pay – if anything – to enroll; the methods used to make the newly covered population aware of their entitlements and to ensure beneficiary rights are enforced; the size of any co-payments levied at the point of use; the network of providers that deliver the services and how they are selected and de-selected; and the governance and
‘purchasing’ arrangements that are put in place to ensure that services are delivered efficiently and at a high quality.
In this paper we describe and analyze an innovative government-sponsored health insurance program in India known as the Rajiv Aarogyasri Community Health Insurance scheme, referred to below simply as Aarogyasri. Historically, India has financed a large share of its health spending through out-of-pocket payments, and the health budget share and incidence of catastrophic and/or impoverishing health spending have been high by international standards.
2,3Prior
1 The World Bank has recently published 22 case studies of such initiatives:
http://www.worldbank.org/en/topic/health/publication/universal-health-coverage-study-series.
2 Data from the World Health Organization for 2011 put India’s share at 59 percent. Of the 148 countries for which WHO has data, only 16 have a higher percentage than India. All – with the exception of Singapore – are low-income countries. Source:
http://apps.who.int/nha/database/DataExplorer.aspx?ws=0&d=1 (consulted September 10, 2013).
to the mid-2000s, efforts to make health care affordable centered around community-based health insurance (CBHI) schemes, often linked to non- government organizations.
4In the light of the disappointing results and limited scalability of CBHI initiatives in India (and elsewhere), a few Indian states, notably Andhra Pradesh, Karnataka and Tamil Nadu, began to set up their own government-sponsored health insurance programs; the national government, through the Ministry of Labour and Employment, also developed the RSBY program.
5Aarogyasri has a number of interesting features. It targets poor households;
however, due to Andhra Pradesh’s (AP’s) high poverty line, the state government claims that in practice most of the population is covered. Aarogyasri focuses on hospital care, and largely on tertiary hospital care. This is the exact opposite approach of most other publicly financed health insurance schemes around the world, where the benefit package is usually based explicitly on cost-effectiveness criteria; the result is that highly cost-effective (often low cost) interventions are covered, but cost-ineffective interventions (often high cost) are not. Aarogyasri’s rationale for focusing on tertiary procedures is partly that many cost-effective
3 Van Doorslaer et al. (2007) find that out-of-pocket spending absorbs nearly five percent of total household expenditure in India; in Asia, only Bangladesh and Vietnam record higher fractions. They also find that nearly 10 percent of Indian
households spend more than 25 percent of their nonfood spending on health care; only Bangladesh, China and Vietnam record higher percentages. Van Doorslaer et al. (2006) also find that India fares worse in terms of the degree to which out-of-pocket spending impoverishes households. At the international dollar-a-day poverty line, health expenses add 3.7 percentage points to the poverty headcount; in Asia, only Bangladesh records a higher increase.
4 Few have been subjected to a rigorous evaluation. Ranson (2002) evaluates the Self Employed Women's Association's Medical Insurance Fund in Gujarat but uses a simple comparison between outcomes at one point in time among those in the scheme and those not in it. Aggarwal (2010) evaluates the Yeshasvini community-based health insurance program; the method again involves comparisons at one point in time between participants and non-participants, although in this case participants and non-participants are matched using propensity score matching.
5 La Forgia and Nagpal (2012) provide a comprehensive review of the various government-sponsored health insurance schemes that have sprouted up India in the last decade. Palacios et al. (2011) cover several angles of the RSBY scheme.
procedures are already supposedly covered by India’s vertical programs and system for primary care, but mainly that it wanted to give patients the opportunity to receive interventions that could prevent the loss of life or disablement of a breadwinner without forcing households into – or further into – poverty. As the Aarogyasri Trust (the body tasked with overseeing the program) put it in its 2011- 2012 annual report, one of the scheme’s objectives is “to cover catastrophic illnesses which will have the potential to wipe out a life time savings of poor families.”
6Aarogyasri is unusual in other respects too. It claims its methods to make the population aware of their coverage and entitlements have been highly successful – a claim we test below. Aarogyasri levies no co-payments at the point of use for covered procedures, and providers are not supposed to balance-bill; patients are supposed, in fact, to sign a document upon discharge confirming they have not paid any out-of- pocket payment whatsoever. Aarogyasri relies entirely on general revenues (at the state level) for finance, and there are no enrollment costs. Nor is there any enrollment process: enrollment is automatic for those with the below-poverty line (BPL) card. Aarogyasri has a sophisticated set of arrangements under which hospitals – from both the public and private sectors – can apply to become empanelled, but not all those who apply are empanelled; hospitals that are too small (fewer than 50 beds), for example, cannot be empanelled. Once empanelled a hospital in AP can be dis-empanelled by Aarogyasri if its performance falls short of the standards laid down in the contract.
6 http://www.aarogyasri.gov.in/ASRI/EXT_IMAGES/documents/Annual_Report_201112.pdf
Aarogyasri also has an elaborate set of governance arrangements: a board of trustees with representatives from across government; a staff that operates a complex pre-screening and verification process underpinned by a sophisticated IT system; a system of payment settlement with empanelled hospitals that is electronic and swift, based on a fixed per-procedure price schedule; a call center that not only receives calls from patients but also makes calls to check up on patients after discharge; and a network of ancillary health workers known as
“Aarogyamitras” whose role is to help the patient through her hospitalization episode, starting before the admission, through the admission itself, to convalescence at home. In the absence of such arrangements, it is possible that providers may – depending on how they are compensated by the scheme – deliver extra care irrespective of whether it is needed or more expensive care irrespective of whether it is cost-effective. This would appear to be part of the reason for the failure of China’s subsidized health insurance schemes to reduce out-of-pocket spending (Wagstaff and Lindelow 2008; Wagstaff, Lindelow, Gao, Xu and Qian 2009; Hou, Van de Poel, Van Doorslaer, Yu and Meng 2013).
7Or if providers are allowed to set prices and balance-bill, they may respond to insurance by raising the price-cost margin to insured patients, extracting the same out-of-pocket payments as before from the patient, and getting the payout from the insurer as well; this seems to have happened in the Philippines (Gertler and Solon 2002).
7 Indonesia’s Askeskin program also seems to have raised out-of-pocket spending, at least in urban areas (Sparrow, Suryahadi and Widyanti 2013).
Despite its innovativeness, Aarogyasri has been the subject of relatively few studies. Rao et al. (2011) undertook a rapid assessment in 2008, and Reddy and Mary (2013) analyzed information from Aarogyasri and media to assess how public funds are used in the program.
8Fan et al. (2012), by contrast, assess the impacts of the program. They exploit the staggered roll-out of the scheme across AP districts over the period April 1 2007 to July 17 2008, and use data from the consumer expenditure survey (CES) to compare – for each of three years (1999–2000, 2004–
2005, and 2007–2008) – households in AP districts with the Aarogyasri scheme and households in AP and non-AP districts without it. None of the districts had implemented the scheme when the first two surveys were conducted, but some AP districts had implemented it for at least part of the period covered by the third survey, and it is this variation that allows the authors to identify the effects of the program. The study concluded that Aarogyasri had significantly reduced out-of- pocket inpatient expenditures and, to a lesser extent, outpatient expenditures, but that the benefits if Aarogyasri were not shared equally across the population, with scheduled caste and scheduled tribe households benefitting less. The study by Fan et al. does have some limitations. It does not provide survey-based evidence on coverage and targeting, or on people’s perceptions and understanding of Aarogyasri.
Moreover, due to the limited scope of the CES, the study focuses exclusively on out- of-pocket spending, and therefore does not shed light on the extent to which Aarogyasri has affected use of services, cost-per-admission, length of stay, or the use
8 Rao et al. (2011) found that the most common condition covered by Aarogyasri was cardiac, few people who were supposed to go for follow-up visits actually did so, and people that had benefitted from Aarogyasri still ended up paying large amounts for medicine. Reddy and Mary (2013) reviewed the expenditure of Aarogyasri on private vs. public hospitals and drew the conclusion that the program is not financially sustainable.
of private or public providers; nor does it show the impact the program has on how households finance expensive hospital care. In addition, at the time of the survey used by Fan et al., Aarogyasri had only been active for a few months.
9The only other study to analyze Aarogyasri is that of Rao et al. (2014) who report some early results from the study on which the present paper is based using the same data and similar methods. That analysis is, however, considerably more limited than this paper. Not only do we use survey data to compare the theory and practice of Aarogyasri, we analyze many more outcomes (25 compared to just four in Rao et al.), and explore the sensitivity of the two threshold-based outcomes (‘large’ out-of- pocket spending and ‘large’ borrowing) to the choice of threshold (we explore seven different thresholds) while Rao et al. use just one threshold for each indicator.
As well as describing Aarogyasri in some detail, we report two types of analysis of it. First, we report descriptive statistics from a household survey conducted in AP specifically to analyze the scheme. Through these data we are able to shed light on issues such as coverage and targeting, and people’s understanding and use of the scheme. Second, in the absence of data and program design features that would allow for a rigorous impact evaluation covering several outcomes and allowing for a reasonable delay before impacts become felt, we try to get some insights into the effects of Aarogyasri by comparing changes in AP with changes in neighboring Maharashtra (MH) over the period 2004 (three years before
9 Factoring in which districts acquired Aarogyasri when, the distribution of the AP population across districts, and the distribution of CES interviews across the 12 months, we estimate that sampled households living in an Aarogyasri district had benefitted from the program for an average of just 3.2 months, with only three percent of surveyed households having had at least a year of exposure.
Aarogyasri) to 2012 (four years after its introduction). Over this period, as we show below, MH did not introduce any at-scale health initiative that was not also introduced in AP (both introduced national initiatives); the initiatives MH did introduce (including health insurance schemes) were tiny in scale, with population coverage rates in single digits. Moreover, while AP did introduce some health initiatives beyond Aarogyasri over this period, Aarogyasri was by far the most important in resource terms, and in terms of likely impacts on the outcomes we analyze. To try to pin down the role of Aarogyasri as best we can, we also include in our analysis household-level influences on outcomes that may have changed differently between AP and MH. We should emphasize, however, that this analysis is not a rigorous impact evaluation, and we interpret our results as simply suggestive of Aarogyasri effects.
From our survey, we find that 80 percent of families in AP are eligible for Aarogyasri, and 70 percent of families in our survey said they were covered; of these, 96 percent had a white card – a card issued to families living below the poverty line.
10Some families may, of course, acquire knowledge of coverage only when they seek health care, so the true coverage rate may well be closer to the claimed rate of 86 percent. While the benefit packages is limited to less than 1,000 high-cost procedures, we find that only one quarter of the households who said they were covered by Aarogyasri were aware of this fact; as many as 60 percent of those who said they were covered said that the scheme “covers all health issues”. We also
10 It is important to recognize that there are many ‘bogus’ white cards. The civil supplies department in AP estimated at least 5 million cards to be fraudulent: see “Report on the State of Andhra Pradesh”, Central Vigilance Committee on Public Distribution System, July 2009, available at http://pdscvc.nic.in/AP%20report.htm.
find that while the scheme explicitly bars any out-of-pocket payments during an Aarogyasri-covered episode, patients in fact incurred quite high levels of out-of- pocket spending (INR 16,000 on average, around $US 300) during inpatient episodes that they understood to be covered by the scheme. Our survey reveals that, contrary to the rules of the program, cash was provided for transportation home in only a minority (43 percent) of inpatient spells that the respondent claimed to be covered by Aarogyasri. Among the families in our survey who said they were covered by Aarogyasri, 62 percent said they had some understanding of the scheme, but among these only 16 percent had heard about ‘Aarogyamithras’, health workers employed to help people navigate Aarogyasri, and less than three percent had interacted with one. Of those in our survey who said they had been hospitalized the last year and had also benefitted somehow from Aarogyasri during the same period, only 12 percent had received a call from the Aarogyasri call center. Among all families knowledgeable about the Aarogyasri scheme, only 19 percent had heard about the call center and only one percent had actually called it. Our survey suggests that patients benefitting from Aarogyasri were just as satisfied with the quality of services as people not benefitting, and that Aarogyasri patients were just as likely (90 percent) to be asked to sign a consent form before surgery as non- Aarogyasri patients (signing is a requirement for reimbursement purposes under the Aarogyasri scheme).
In terms of possible effects of the Aarogyasri, we find that AP recorded faster
growth than MH (even after adjusting for confounders) in inpatient admissions per
capita and in surgery admissions; the former increased faster across the board, the latter only among the poor. The faster growth in AP is consistent with Aarogyasri increasing the demand for inpatient care, but may also reflect the effects of ambulance program that AP introduced (and which MH did not). We find that AP recorded slower growth in out-of-pocket payments for inpatient care (in total and per admission), although only among the better off. The slower growth in AP in inpatient out-of-pocket spending is consistent with Aarogyasri reducing patient inpatient costs as intended, but may also reflect increased hospital competition in AP, and Aarogyasri shifting hospital casemix towards simpler cases by encouraging people to seek treatment at an earlier stage in their illness; the fact that we find AP reduced inpatient days faster than MH is consistent with this. We find that transportation costs fell in AP but grew in MH; this likely reflects in part AP’s ambulance program, but may also reflect Aarogyasri’s policy of contributing toward the patient’s transport costs home. Finally, we find that in AP outpatient out-of- pocket expenditures fell while they increased in MH; this may reflect people in AP obtaining some outpatient care for free through Aarogyasri health camps, but more likely it reflects people in AP seeking inpatient care for conditions that previously they would have sought outpatient care for.
The rest of the paper is organized as follows. Section 2 outlines the central
features of Aarogyasri, and compares the “theory” of the program, as set out in
official documents and the program’s website, and the “practice” revealed through
our household survey. Section 3 explains the methods we use to try to shed some
light on Aarogyasri’s effects, section 4 outlines the data we use, and section 5 presents our results. Section 6 presents our conclusions.
2. Aarogyasri: Theory and practice
Launched by the AP state government in 2007, Aarogyasri is a government- sponsored health insurance program that has inspired many other government- sponsored insurance programs in India (La Forgia and Nagpal 2012). In this section, we describe the “theory” of the program highlighting its unique features.
Using data drawn largely from a representative survey
11of 8,623 AP households that we fielded in 2012, but also from the Aarogyasri Trust and the AP government, we also present descriptive statistics that shed light on how Aarogyasri works in practice. Table 1 collects the various descriptive statistics from our household survey that we refer to in this section.
2.1. Origins, goals and management
The aim of Aarogyasri is to make hospitalization and treatment for serious life-threatening conditions affordable to households living below the poverty line.
The scheme’s rationale for focusing on tertiary procedures is that it wanted to give patients services that could prevent the loss of life, severe disablement and major health care expenditures pushing households into – or further into – poverty. As the
11 The survey was fielded between June and September 2012. The design was based on the National Sample Survey Organization’s (NSSO) socio-economic survey 60th round (2004-05) that covered morbidity and health care. We included the same questions and adopted the same multi-stage stratified sampling methodology. However, our ‘First Stage Units’ (FSUs) were those used by NSSO in their 66th round (2008-09) because rapid urbanization has changed the urban-rural landscape of both states and thus the geographical rationale for sampling units. We also added questions for AP households about the Aarogyasri program and other relevant programs.
Aarogyasri Trust (the body established to oversee the program) put it in its 2011- 2012 annual report, one of the scheme’s objectives is “to cover catastrophic illnesses which will have the potential to wipe out a life time savings of poor families.”
12The Aarogyasri Trust was created to design and ensure implementation of Aarogyasri. The CEO of the Trust is always a civil servant and the Trust has more than 150 employees managing the program.
13The Trust is overseen by a Board of Trustees, chaired by the Chief Minister of the State and with Secretaries (senior civil servants) of relevant government departments as members. Initially the Trust contracted a private insurer through a competitive bidding process to perform most of the scheme’s management functions. However, in 2011 the Board of Trustees decided that most management responsibilities should be taken over by the Trust.
2.2. Target population and enrollment process
AP began introducing Aarogyasri from April 2007 onwards, and within 16 months all districts were covered. The government claims that the program covers 72 million people, 86 percent of AP families, and is designed to mainly target poor households. It is important to note that AP has a relatively generous poverty line:
INR 60,000 per year and family (around $US 1,000) in rural areas and INR 75,000 in urban areas.
14Aarogyasri also aims to cover some families above the poverty line, notably those carrying an Annapurna card, an Anthyodaya Anna Yojana card,
12 http://www.aarogyasri.gov.in/ASRI/EXT_IMAGES/documents/Annual_Report_201112.pdf.
13 The Aarogyasri Trust has a couple of hundred people managing support services such as the call center and has contracted an agency to manage more than 3,000 health workers, ‘Aarogyamithras’, in all networked hospitals and primary care centers of the government, on behalf of Aarogyasri Trust.
14 The Planning Commission in 2011-12 estimated the poverty line in AP to be INR 860 per capita per month in rural areas and 1,009 in urban areas: see “Press Note on Poverty Estimates, 2011-12”, Government of India, Planning Commission, July 2013, available at http://planningcommission.nic.in/news/pre_pov2307.pdf. Given an average family size of 3.9 in AP, this translates into an annual poverty line per family of INR 40,248 in rural areas and INR 47,221 in urban areas.
or a Journalist card. There have been talks of aiming at “universal coverage of the population” in the long-run.
15For now, Aarogyasri automatically enrolls households with any of the eligible cards and there is no cost to families to be enrolled.
As families are supposed to be automatically covered by Aarogyasri if they hold a BPL card, or any of the other recognized cards, it is worth asking how many people have these cards, and how many people are aware that they are covered by the program. We find (see Table 1) that 71 percent of AP households (6,143 out of 8,623 households) consider themselves to be covered by Aarogyasri. Among those who hold a card that entitles them to the program, about 85 percent considered themselves covered (5,805 out of 6,848 households); among the poorest 20 percent, the rate is 88 percent. Some families may, of course, acquire knowledge of coverage only when they seek health care, so the true coverage rate may well be much closer to the 86 percent claimed in the Annual Report.
2.3. Efforts to raise awareness and use of the program
As Aarogyasri is an important program for the ruling party, it has been marketed intensively during election periods and there are frequent advertisements in newspapers aimed at raising awareness of the program.
The Trust has also introduced several initiatives to raise awareness especially among families in rural areas. One such initiative is health camps, which initially at least were intended to be conducted by every networked hospital following a protocol laid down by the Aarogyasri Trust. Initially running at the rate
15 http://www.aarogyasri.gov.in/ASRI/EXT_IMAGES/documents/Annual_Report_201112.pdf .
of 1,700 per month these camps have also been used for basic health checks with free over-the-counter medicine and to screen the population for conditions (“ailments”) that can be treated with support from Aarogyasri. More than 35,950 camps have been conducted since the start of the program. In December 2012, as awareness was considered to be high, the number of health camps was reduced, and are conducted through public primary health care centers at the rate of 30 camps per month in each district (about 460 per month).
16To ascertain the degree of awareness of Aarogyasri among the population, we asked the respondent in our survey whether they considered themselves
“knowledgeable” about Aarogyasri: 57 percent of the sample said they were (see Table 1). This rate was slightly higher (61 percent) among those reporting being covered by Aarogyasri. We also asked about health camps: among the families who were covered by and knowledgeable about Aarogyasri, 22 percent said they were aware of the health camps, and 11 percent had attended one.
17We can get at whether efforts to raise awareness have translated into people accessing the program through the vast amounts of data that Aarogyasri collects through its field staff and networked hospitals. The Aarogyasri website reports information about the number of people hospitalized through the program, the patient’s condition, and the amounts paid to each hospital. These data show that in
16 Information taken from minutes from meetings of the Board of Trustees of Aarogyasri available at
https://www.aarogyasri.gov.in/ASRI/FrontServlet?requestType=CommonRH&actionVal=RightFrame&page=%3Cb%3EDR%3 C/b%3E&pageName=DR&mainMenu=Home&subMenu=Documents-and-Reports (consulted April 5, 2014).
17 The Aarogyasri Trust reports that 2.3 percent of people treated in 2012 with support from Aarogyasri have been referred from a health camp.
2012, 434,000 people were admitted to hospital for an intervention that was paid for by Aarogyasri. We can cross-check this figure with our survey. There we find that 11.3 percent of admissions were considered by respondents to have been covered by Aarogyasri. With the number of admissions averaging 5.5 per capita in our sample, this translates into about 520,000 Aarogyasri-covered admissions in 2012. The discrepancy, which is not large, may be due to some admissions not being covered by Aarogyasri despite the household thinking so; this would be consistent with the fact that, as we report below, we find some patients reporting out-of-pocket expenses and not receiving transport subsidies for admissions that they thought were covered by Aarogyasri.
2.4. Intervention coverage
Aarogyasri focuses on around 900 infrequent high-cost procedures delivered by secondary and tertiary hospitals. The number of procedures covered by Aarogyasri grew from 166 in 2007 to 938 in 2012.
18The Trust argues that these procedures cover “all major diseases”. It favors procedures that are high-cost (in the Trust’s words “have the potential to wipe out a life time savings of poor families”), require hospitalization in a secondary or tertiary hospital, and have an agreed clinical protocol. Explicitly excluded from the list are high-end procedures such as hip- and knee-replacement, bone morrow, cardiac and liver transplantations, gamma-knife procedures in neurosurgery, and assisted devices for cardiac failures.
Also excluded are procedures related to diseases covered by national programs, such
18 Information taken from minutes from meetings of the Board of Trustees of Aarogyasri available at
https://www.aarogyasri.gov.in/ASRI/FrontServlet?requestType=CommonRH&actionVal=RightFrame&page=%3Cb%3EDR%3 C/b%3E&pageName=DR&mainMenu=Home&subMenu=Documents-and-Reports (consulted April 5, 2014).
as TB, HIV/AIDS, leprosy, infectious diseases, malaria, Filariasis, gastroenteritis, and jaundice. Deliveries are not covered but many complications of labor are covered.
Despite Aarogyasri’s limited benefit package, only one-quarter of households in our survey who said they were covered by and knowledgeable about Aarogyasri were aware of this fact (see Table 1). As many as 60 percent of those who said they were covered by and knowledgeable about the program said (incorrectly) that it
“covers all health issues”; the remaining 14 percent said they were unsure whether the program “covers all types of treatments”.
2.5. Financial coverage and co-payments
Aarogyasri covers hospital expenses up to an annual ceiling equal to INR
200,000 (around US $3,700) per family. The treatments that are covered by the
program must be provided free charge to the patient and Aarogyasri Trust pays
hospitals a fixed amount per covered procedure. The rate paid includes not only
costs incurred during the hospitalization but also medicines for 10 days after
hospitalization and INR 1,000 subsidy for transportation. Hospitals will also have
to meet the costs of readmissions within 12 days. For selected procedures requiring
major medical treatment after hospitalizations, hospitals are also required to cover
the costs of medicine for one year after the hospitalizations. There are still major
challenges with this as many people travel long distances for the hospitalization
while they are unable to travel the same distance for the follow-up visits and
medicines. The prices for procedures covered by Aarogyasri were proposed by a
small group of specialists and approved by the Board of Trustees. Hospital associations became more active, as a response to Aarogyasri, to negotiate prices with the government. A challenge for Aarogyasri in managing these negotiations is a lack of data on costs of care for transparent price-setting; Aarogyasri has therefore initiated a study of costs in public and private hospitals.
The patient is supposed to sign a declaration for the Trust to the effect that they have not been asked to pay anything out-of-pocket. This provision was considered essential because patients in India’s government-run health facilities have found themselves making payments for products and services in what is supposed to be a system that delivers care that is free at the point of use.
19Transactions in the Aarogyasri program are intended to be completely cashless – the patient does not have to pay upfront and then claim reimbursement. In addition, the patient receives medicine for ten days after discharge and subsidy of INR 1,000 toward the cost of transport to and from the hospital; this is enforced through a photograph upon discharge of the patient, the treating physician, and the responsible health worker or ‘Aarogyamithra’ (see below).
In our household survey, we asked respondents who had benefitted from Aarogyasri if they had incurred any expenditure. We found that patients incurred quite high levels of out-of-pocket spending during inpatient episodes that they understood to be covered by Aarogyasri. Among respondents who said their family
19 Payments could be for medicines required but not available in the government hospital, or other incidental costs or informal payments.
and the inpatient episode were covered by the program, the average out-of-pocket spending per episode was INR 16,019 (see Table 1). There are various possible explanations of this. It may, for example, be that patients pay for diagnostic tests before they are admitted. Or it may be they are admitted to hospital for a covered procedure but end up paying for uncovered procedures. It is also common that families have to pay for medicine outside of the hospital even during a treatment.
Our data show that the average amount paid for medicine outside of the hospital during a treatment funded by Aarogyasri was INR 5,204.
Our survey also reveals some divergence between the principle and practice of transportation subsidies. Our data show (see Table 1) that cash was provided for transportation home in a minority (43 percent) of inpatient spells that the respondent had understood to be covered by Aarogyasri. One possibility is that the amount provided is not sufficient to cover the entire transport cost. Another is that the patient may be misremembering. It may also, of course, be the case that the patient simply did not receive the subsidy as required by the program.
2.6. Efforts to ensure beneficiaries’ rights are enforced
The Aarogyasri program includes a number of unique features to mitigate
fraud, raise awareness of the program, and to get feedback from people covered by
the program. One such feature is the call center. The Aarogyasri call center receives
calls from anyone with complaints about the program or wanting general
information about the program such as where the closest network hospital is
located, what services the hospitals provide and how many available beds the
different hospitals have. In our survey, we found that among all families knowledgeable about and covered by Aarogyasri, 19 percent had heard about the call center, but only one percent had actually called it (see Table 1).
Most of the Aarogyasri program’s call center calls are actually outgoing calls – to coordinate with “Aarogyamithras” (see below) and contact patients who have received treatment funded by the program to remind them about follow-up treatments, check on the welfare, and on their receipt of medicines after discharge from hospital. Among those in our sample who said they had been hospitalized in the last year and had benefitted from Aarogyasri, 12 percent say they had received a call from the call center.
In 2011 it was decided that Aarogyasri Trust should take over another help line / call center (known as the “104 call center”) that provides advice on preventive and primary health care services. Algorithms guide the call center staff, and a panel of doctors is available to give advice when needed. The center was initiated as a public-private partnership in 2009 inspired by a public-private partnership for ambulance services in AP (see Table 2). In our survey data, awareness about the
“104” help-line was much higher (76 percent of respondents) than about the Aarogyasri call center (19 percent of people knowledgeable and covered by Aarogyasri)(see Table 1).
Aarogyasri uses another instrument to ensure the covered population
benefits from the program: it employs more than 3,000 ancillary health workers
known as “Aarogyamithras” (or “friends of health”) who support patients at all government-run primary health centers and in all hospitals contracted by the program. Aarogyamithras in primary health care centers are responsible for raising awareness about the Aarogyasri program in the community, while those working in contracted hospitals are responsible for guiding patients through the treatment process and collecting feedback. Among the surveyed families who said they were covered by and knowledgeable about Aarogyasri, 16 percent had heard about Aarogyamithras, but only 3 percent had ever interacted with one.
The Aarogyasri Trust sends a letter from the Chief Minister to every person who has benefitted from the program. The letter encourages the patients to send a reply with feedback about the treatment. In our survey data, we found that only 23 percent of people treated through Aarogyasri reported receiving the letter.
2.7. Public financing
Aarogyasri is entirely publicly financed, with the resources coming from the state government. In 2011-2012 the AP government spent INR 10.3 billion (around US $ 190 million) on Aarogyasri, equivalent to INR 400 per family in the state, INR 140 per capita, and INR 137 per person covered.
20Since 2008 Aarogyasri has absorbed 15-23 percent of AP’s health budget (see Figure 1) (Nagulapalli and Rokkam 2013).
The AP government introduced a “sin tax” on alcohol to fund Aarogyasri, but this additional revenue in practice covers only a small portion of the cost. Health
20 Based on 2011 census data.
expenditure as a share of all government expenditures in the state increased from 3.4 percent in 2007 to 4.3 percent in 2011, most of this increase being attributable to Aarogyasri.
2.8. The network of providers that deliver the services
Reflecting its secondary and tertiary care-oriented benefit package, Aarogyasri contracts secondary and tertiary hospitals with at least 50 beds, both public and private. Aarogyasri has an aggressive approach to empaneling and disempaneling hospitals according to indicators of structure and process; over time Aarogyasri has become less evenhanded in its approach to the private and public sectors, deciding in 2011 to reserve 133 procedures exclusively for reimbursements in public hospitals.
21Any public or private hospital with 50 beds or more can submit an online application to the Aarogyasri Trust to become an empanelled hospital. As of April 2013, the network of empanelled hospitals included 271 private hospitals and 102 government hospitals. The application has a standard format with a broad set of elements including mandatory approvals such as licenses, and details on equipment and human resources per the different specialties. After a successful submission, representatives from the Trust visit the hospital to verify the information. The number of hospitals in the network is constantly changing with Trust delisting and suspending hospitals that are not meeting the requirements such as the number of
21 Information taken from minutes from meetings of the Board of Trustees of Aarogyasri available at
https://www.aarogyasri.gov.in/ASRI/FrontServlet?requestType=CommonRH&actionVal=RightFrame&page=%3Cb%3EDR%3 C/b%3E&pageName=DR&mainMenu=Home&subMenu=Documents-and-Reports (consulted April 5, 2014).
health camps to be provided per month, charging patients when it is supposed to be cashless or different forms of fraud.
According to Aarogyasri’s administrative data, about 30 percent of all admissions supported by the program in 2012 occurred in the public sector. In our survey, 32 percent of admissions thought by the patient to have been covered by Aarogyasri occurred in a government hospital – very similar to the figure from the official Aarogyasri records. It is sometimes claimed that Aarogyasri is biased toward the private sector, a belief that led to the aforementioned decision to reserve 133 procedures for exclusive delivery by the public sector; interestingly, our data show that that the public share of non-Aarogyasri admissions is even lower at just 23 percent.
2.9. Claims management
Aarogyasri has an elaborate claims management system. An individual who
wants to benefit from the program must bring the card that verifies eligibility to a
networked hospital (hospital that has been contracted by Aarogyasri) when seeking
care; the hospital verifies that the person is the person whose picture appears on
the card; the hospital scans the card, and sends the scanned image to the Trust for
verification. It is not only eligibility that is verified by the Trust; hospitals have to
upload the diagnosis with supporting documents such as lab results and images for
authorization by a group of doctors at the Trust. This is generally done before the
patient is admitted to the hospital.
Hospitals are reimbursed by Aarogyasri through a cashless system within seven days of the patient being discharged from hospital. A web-based system has been developed for efficient claims management. The system has direct links between pre-authorization, electronic patient records, claims review and bank transactions to hospitals. The data entered at the time of pre-authorization are reviewed and compared to the claims data from the hospital. If the patient has received the treatment previously authorized, the claims manager notifies the bank, an electronic payment is made to the hospital, and the hospital manager is notified via text message or email.
2.10. Measures to counter fraud and assure quality
Aarogyasri has a sophisticated pre-authorization process in which documents supporting the proposed procedure are submitted electronically by the hospital to the Aarogyasri Trust, scrutinized by an authorizations physician, and approved or rejected within 12 hours of submission. There are also efforts to introduce standard treatment guidelines to improve the quality of services.
Fraud is one of Aarogyasri’s main challenges, and methods to detect and manage fraud are being developed and refined. For several years, Aarogyasri has listed on its website the hospitals that it has dis-empanelled, along with the reasons; financial fraud is one.
Aarogyasri has recently invested in improving the quality of services in
networked hospitals by advancing its accreditation standards. Aarogyasri – along
with most other government-sponsored health insurance programs in India – is reviewing its standards and exploring how to encourage hospitals to improve.
Aarogyasri has announced that it will require all empanelled hospitals to be accredited by the National Board for Accreditation of Hospitals by 2015, which is a major commitment, as only 18 hospitals have managed to be accredited as of April, 2014.
The actual quality of services delivered by Aarogyasri is uncertain. We can get some insight into this from our survey, although the survey relies upon self- reported information from patients. Respondents who had been hospitalized were asked if they were satisfied with the quality of services, the attitude of the staff, etc.
There is no indication that patients whose episode was covered by Aarogyasri feel they received better or worse quality of services than people whose episode was not covered. Patients are supposed to sign a form of consent before surgery; this is a requirement by law, and also a requirement for reimbursement by Aarogyasri. Our survey suggests the likelihood of this happening is the same among Aarogyasri- funded patients as among other patients, with close to 90 percent of patients being asked to sign the form in both groups.
3. Assessing the effects of Aarogyasri: Methods
To what extent has Aarogyasri succeeded in its aim of making hospitalization
and treatment for serious life-threatening conditions affordable to AP families,
especially poor ones? In an ideal world, we would be able to estimate the impacts of the introduction of Aarogyasri on, say, hospitalization and out-of-pocket spending, and compare these impacts with the impacts of the introduction of an alternative program in a similar setting. Unfortunately neither the manner of the Aarogyasri rollout, nor the data that are available, permit such an analysis. The program was phased in across four groups of districts, but the districts acquiring the program first (on April 1 2007) did so only 16 months before the last group of districts acquired it (on July 17 2008). Had the CES been fielded in 2008-09 (it was not
22), we could have combined the data with the data from the 2007-08 CES to obtain 24 months of interviews with Aarogyasri exposure times ranging from zero to 27 months, and almost 20 percent of the combined sample having one year’s worth of exposure. But even then we would have been able to look only at out-of-pocket spending, not the full range of outcomes we look at here. Nor can we exploit variation in Aarogyasri cover across individuals, in part because, as we have seen, most of the population is covered (and know it), and in part because people who do not know they are covered may simply wait until they seek care to establish it.
Moreover, people who are not eligible for Aarogyasri have the option of financial support for inpatient care through the Chief Minister’s Relief Fund, so in effect the entire population is covered against the costs of secondary and tertiary care.
What we can do is to compare changes in outcomes among AP residents after the introduction of Aarogyasri with changes recorded over the same period among a
22 http://mospi.nic.in/Mospi_New/upload/nsso/ratelist_UnitData.pdf
comparable population elsewhere, i.e. a difference-in-difference approach. We can improve on this simple diff-in-diff approach by holding constant at the individual level factors that may both exert a potential influence on outcomes and grow differently between the AP population and the “control group”, and by running the model as a (district) fixed-effects model. Neither approach automatically identifies the effects of Aarogyasri, of course. Rather they identify AP’s excess growth in outcomes over and above the growth among the control group.
Whether this excess growth estimate sheds any light on the effects of
Aarogyasri depends on: (a) how well our covariates capture differential changes on
outcomes attributable to influences other than state-level health initiatives; (b) how
important Aarogyasri was among AP’s health initiatives; and (c) how far there were
major health initiatives in the “control” area(s). On (a), we include standard
covariates such as variables such as a proxy for living standards and a rural-urban
dummy. On (b) and (c) we argue below that Aarogyasri was the most significant
health initiative in AP, and that in the state that forms our control group –
neighboring Maharashtra (MH) – there were only small-scale health initiatives
other than national initiatives that affected both states equally. We believe
therefore that our estimates of excess growth in AP do shed some light on the
possible effects of Aarogyasri; that said, the results are suggestive of impact (or no
impact), not conclusive.
3.1. Health initiatives in AP and MH
Table 2 summarizes the various health initiatives of AP and MH over the period over which we analyze differential growth between the two states (2004- 2012).
AP introduced Aarogyasri in 2007, and quickly reached about 80 percent population coverage (see Figure 2). As Table 2 shows, while MH has developed programs providing insurance against inpatient care costs, these have covered a tiny fraction of the population. Only in July 2012 did the government of MH decide to launch an Aarogyasri-type program (the Rajiv Gandhi Jeevandayee Arogya Yojana or RGJAY program): we estimate that in 2012 RGJAY covered just 0.04 percent of inpatient admissions in MH; Aarogyasri, by contrast, covered more than 11 percent of admissions in AP.
23RGJAY was predated by the Jeevandai Arogya Yojana program, which started in 1997 but which had the same financial coverage as RGJAY but operated at a very small scale, and by RSBY, a national insurance program that MH implemented in 32 districts between 2008 and 2011 but then scaled back to 26 districts as RGJAY was launched in six districts to replace RSBY (Thakur and Ghosh 2013). RSBY faced challenges in enrolling eligible families in MH, and in 2012 was only covering one percent of the MH population (Thakur and
23 For MH calculated as 20,170 admissions paid for by RGJAY (available at http://maha-
arogya.gov.in/projectandschemes/Jeevandaiaarogya/performance.htm consulted on April 7, 2014) over admissions in the state in MH (0.05 times hospitalized per capita) as per our survey estimates. For AP calculated as 433,975 admissions paid for by Aarogyasri (available at
https://www.aarogyasri.gov.in/ASRI/FrontServlet?requestType=CommonRH&actionVal=RightFrame&page=undefined%3E%3 E%3Cb%3EExplore-Data%3C/b%3E&pageName=Explore-Statistics&mainMenu=Home&subMenu=Explore-Data consulted on April 5, 2014) over number of admissions in the state (0.55 time hospitalized per capita) as per our survey estimates.
Ghosh, 2013). Figure 2 shows the trends in coverage of Aarogyasri, RGJAY and RSBY between April 2007 and April 2012.
Table 2 also shows that beyond Aarogyasri, AP had three other health flagship programs: an ambulance service, mobile health units, and a health call center. MH had nothing similar to either of the first two in the period in question, and while MH did introduce a health call center, it did so only in 2011 (AP introduced its call center program in 2007). Table 2 also highlights two national health initiatives that are in both states, namely the Employees State Insurance Scheme (ESIS) and the National Rural Health Mission (NRHM). The first predates our “baseline” survey by many decades, and while the latter was introduced a year after our baseline survey, it is a program that is intended to be nationwide and to operate similarly across states. We have found only one health initiative in MH that was not also present in AP, namely MH’s Matrutva Anudan Yojana program;
however, this was introduced 10 years before our baseline survey, and it is hard to see how it could account for any differential growth between AP and MH over the period in question.
3.2. Models used to estimate AP’s excess growth
A comparison of the health initiatives in the two states thus shows that
Aarogyasri was at least one of AP’s key health initiatives over the period in
question, if not the key initiative, and that MH did not introduce any significant at-
scale health initiatives that were not also introduced in AP. For some of our
outcomes (e.g. transportation costs) we would expect AP initiatives other than
Aarogyasri (e.g. the ambulance service) to help explain differential growth between AP and MH. However, for others (e.g. length of inpatient stay) we think this less likely.
Let y
idtbe the outcome of interest for individual i living in district d at time t, X
idtbe a vector of covariates that are potentially correlated with outcomes and that may vary from one state to the other, and AP
idttake a value of one if individual i lives at time t in AP. The difference-in-difference estimator can be written:
(1) 𝑦
𝑖𝑑𝑡= 𝛼 + 𝜇𝐴𝑃
𝑖𝑡+ 𝛿𝐴𝑃
𝑖𝑡∙ 2012
𝑡+ 𝜖
𝑖𝑑𝑡where 2012
ttakes a value of 1 for data collected in 2012 and ε
idtis an idiosyncratic error term. Eqn (1) simply compares the change between 2004 and 2012 between the two states: the coefficient δ gives the additional increment (or decrement) in y in AP over and above that in MH, i.e. the “excess growth” (which could be negative) in AP. If, on balance, Aarogyasri and other initiatives implemented between 2004 and 2012 in AP had the same effect on y as the various health initiatives implemented over the same period in MH, δ will be zero.
Our second approach is to estimate a fixed effects model (with fixed effects for district and month) in which we also control for differential changes in observables between the two states. The model we estimate is:
(2) 𝑦
𝑖𝑑𝑡= 𝑋
𝑖𝑑𝑡𝛾 + 𝛿𝐴𝑃
𝑖𝑡+ 𝛼
𝑑+ 𝜃
𝑡+ 𝜖
𝑖𝑑𝑡,
where the X
idtare observable variables for individual i in district d at time t, α
dand θ
tare the district and time fixed effects, and ε
idtis an idiosyncratic error term. The coefficient δ gives the excess growth in AP. We heed Angrist and Pishcke’s (2009 p.94 ff) advice and use OLS rather than a limited dependent variable model in the case of binary outcomes. Throughout we adjust standard errors for clustering at the district level, and use sampling weights.
244. Assessing the effects of Aarogyasri: Data
Our household data are for the states of AP and MH, and refer to the years 2004 and 2012 – respectively three years before and five years after the start of the rollout of Aarogyasri. They come from two surveys: the 2004 National Sample Survey Organization (NSSO) Morbidity and Health Care Survey
25; and our own survey which we conducted in MH and AP over the period June-September 2012.
The MH and AP samples of the 2004 NSSO survey comprise 5,314 and 5,059 households respectively. In our 2012 survey, we interviewed 10,073 households in MH and 8,623 households in AP. The NSSO survey contains quite detailed information on the use of health services and expenditures. We modeled our questionnaire for the 2012 survey on the NSSO questionnaire, but added questions,
24 Certain criteria were used for selecting the survey households. All households in the first sample unit (FS) were listed and households then randomly selected as per the criteria. Multipliers, or weights, were then assigned to each household based on the characteristics of the first sample unit. This is to avoid the sample from being purposive. NSSO provided weights along with the unit level data for the 2004 data and we developed weights using the same method for our survey.
25 The full title is National Sample Survey Organization (NSSO) Socio-Economic Survey Sixtieth Round: January – June, 2004 Schedule 25.0: Morbidity and Health Care.
including an entire section on the Aarogyasri program which was our source of microdata in section 2.
4.1. Outcome variables
Tables 3-5 report descriptive statistics for our outcome variables for AP and MH for 2004 and 2012, along with the change and difference in change (or diff-in- diff). We wanted to capture the outcomes related to the main objectives of the Aarogyasri program. These include the use of health care services, broken down by inpatient versus outpatient, and in the case of an inpatient admission whether surgery was undertaken; where care was received (type and ownership of the facility); out-of-pocket expenditures (including whether expenditures are ‘large’);
and what sources of funds the family used to pay for the hospitalizations (borrowing, contributions from friends and family, income or other sources).
Our inpatient admission variable takes a value of one if the individual had at
least one hospitalization in the previous year – the rate is lower in AP than MH,
and in both states the rate has increased; AP recorded the larger percentage
increase. We also measure the number of times a person was hospitalized in the last
12 months; again both states have seen an increase, with AP overtaking MH and
recording the larger percentage increase. Our surgery variable equals one if the
individual had undergone surgery in the previous year – the fraction has increased
in both states, and is higher now in AP; AP’s rate increased considerably faster than
MH’s. We also have a series of hospitalization variables that capture whether or not
the individual had been admitted to hospital for the various procedures that
Aarogyasri covers. We were limited to defining the conditions in our survey in the same way as the NSSO survey, with broad categories of conditions. Cardiac, cancer and kidney failure were the only three categories of conditions included in the NSSO survey for which Aarogyasri covers most procedures. These three conditions together represent 38 percent of all procedures covered by Aarogyasri, and for 49 percent of Aarogyasri payments.
26Less than half of one percent of the population in AP is admitted to hospital with these conditions. The percentage of people admitted to hospital with an Aarogyasri-covered condition fell in MH but increased in AP.
Our outpatient utilization variable takes a value of one if the individual had sought outpatient care in the previous 15 days. Outpatient utilization rates have apparently fallen in both states between 2004 and 2012. We also construct outcomes at the level of the hospital admission. For each admission, we construct a variable that captures the length of stay, and whether the care was delivered in a private facility. Length of stay has fallen in both states with AP recording the larger percentage fall, while admissions to private facilities have fallen in MH but have increased somewhat in AP.
Our data allow us to measure inpatient expenses (net of reimbursements) incurred for each admission; we aggregate across admissions in each household to get total household inpatient expenditures. We adjust spending by the Consumer
26 See
https://www.aarogyasri.gov.in/ASRI/FrontServlet?requestType=CommonRH&actionVal=RightFrame&page=undefined%3E%3 E%3Cb%3EExplore-Data%3C/b%3E&pageName=Explore-Statistics&mainMenu=Home&subMenu=Explore-Data (consulted on April 9, 2014).
Price Index
27, differentiating between states and rural/urban families. Spending on inpatient care has increased in both states, but the percentage increase was smaller in AP. We cannot credibly measure out-of-pocket payments as a share of total spending, or whether out-of-pocket spending is ‘catastrophic’ or ‘impoverishing’, because we do not have adequate data on total household spending in the 2004 NSSO survey, which was a health-specific survey not a general household survey.
What we can do is construct variables that capture whether inpatient care results in ‘large’ out-of-pocket spending. At the household level, we construct a variable that takes a value of one if the household incurred inpatient expenditures in excess of INR 22,500; this is around the average amount paid to providers by the Aarogyasri program for a hospitalization in 2012. We also report results for different thresholds, beginning at INR 15,000 and ending at INR 30,000 in steps of INR 2,500. The incidence of large payments has increased in both states, with AP recording the larger percentage increase; the difference between the states is much smaller for expenses in excess of INR 25,000. We also compute the household’s total outpatient expenses over the last 15 days; this has increased in AP but has fallen in MH. At the case-level, we have a variable that captures whether the admission resulted in positive out-of-pocket payments (this increased slightly in both states), and variables that capture net out-of-pocket spending associated with an admission (this increased in both states but less in percentage terms in AP) as well as the amount reimbursed (this fell in both states). In addition, we measure the
27 All results in INR are given in 2004 values.
transportation costs associated with a hospitalization (this increased in MH but fell in AP).
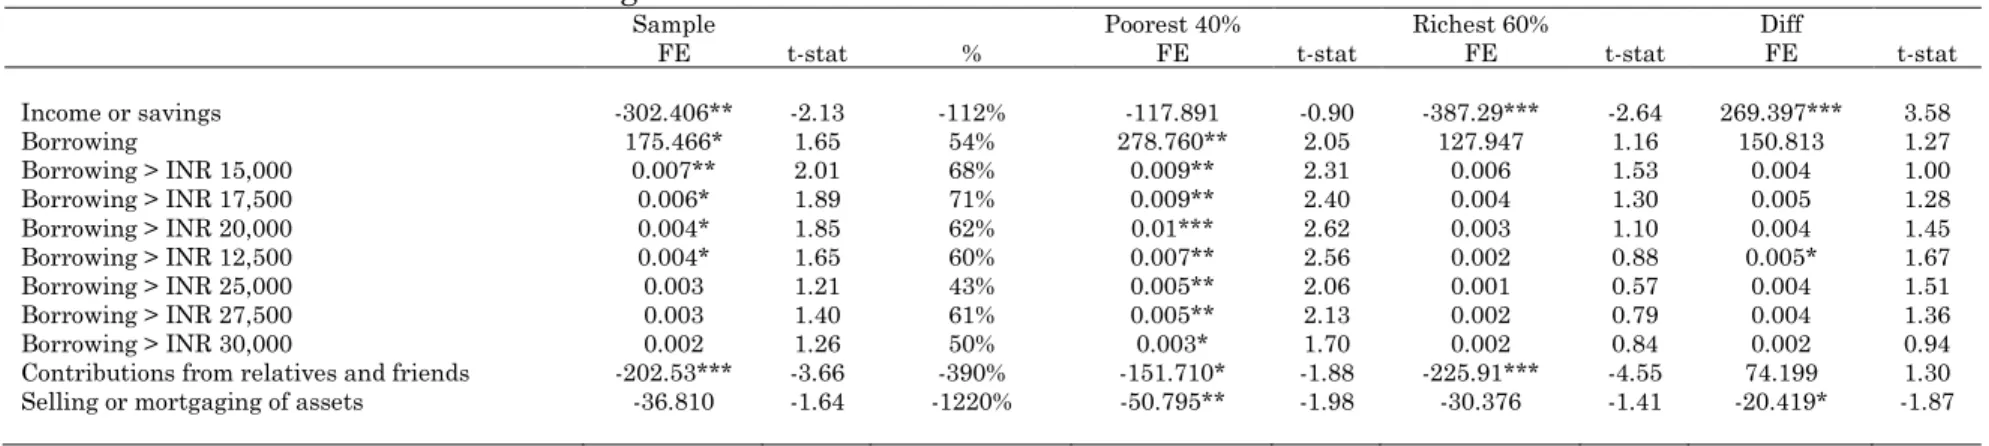
Our final outcome variables capture how households finance their inpatient care. We distinguish between the following four sources: (i) household income or savings; (ii) borrowing (with and without interest); (iii) contributions from relatives and friends; and (iv) “other” which includes selling and mortgaging of assets. The first two finance over 80 percent of inpatient care costs; both states saw an increased reliance on income and savings, but only AP saw an increase in reliance on borrowing. We are also interested whether the household had borrowed a ‘large’
amount to finance inpatient care; we use the same thresholds as we did with our
‘large’ spending variables. Only AP saw a rise in the incidence of large borrowing.
Both states saw increased reliance on contributions from family and friends to finance inpatient care, but the increase in MH was larger; both states saw a rise in reliance on mortgaging and selling of assets, but from a very small base.
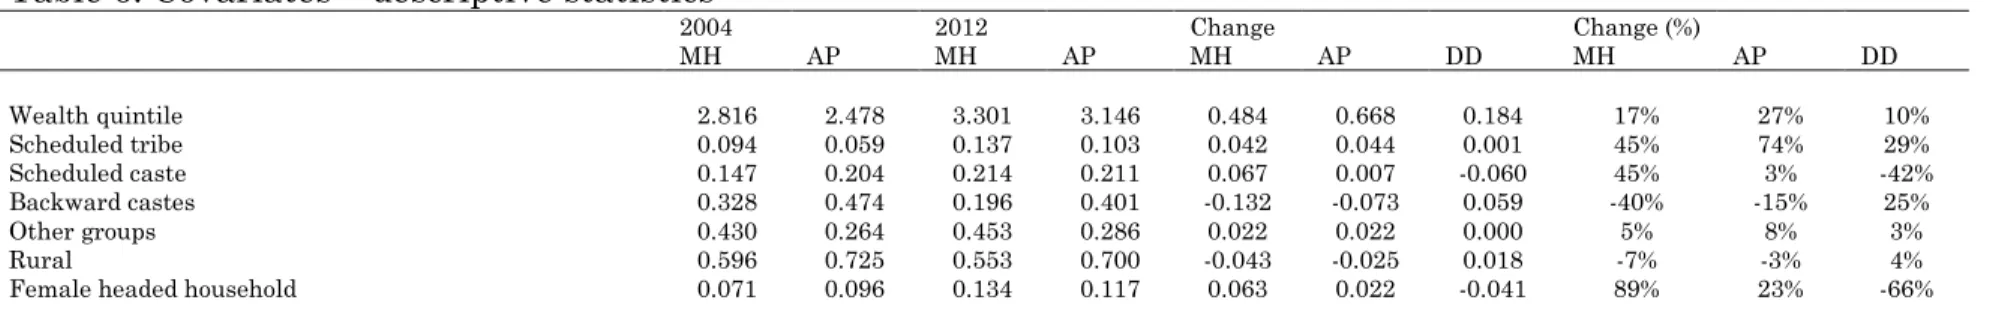
4.2. Covariates and stratifiers
As mentioned above, the 2004 NSS survey has limited information on
household consumption. Instead we capture a household’s living standards in our X
vector through a wealth proxy (asset index) constructed using principal components
analysis (PCA) on a vector of dwelling characteristics and amenities (cf. Filmer and
Pritchett 2001). The vector includes the household’s source of drinking water,
whether the water source is an ‘improved’ one, the type of energy used for cooking,
type of latrine, type of drainage and the structure of the house.
28The PCA was run on the pooled 2004 and 2012 data to ensure our index captures improvements in living standards between the two periods. We multiplied it by minus 1 to make it increasing in “wealth”, and the then constructed quintiles, again on the pooled data.
Our wealth index puts AP average wealth lower than MH’s in both years, but gives AP the faster growth rate (the statistic in Table 6 is the mean value of the quintile variable). In addition to including the wealth quintile dummies in the X-vector, we also used it to stratify our sample to examine the differential excess growth in AP and MH among the poorest 40 percent and the richest 60 percent. In the X vector we also included a vector of dummies capturing India’s socioeconomic groups (our categories were scheduled tribe, schedule cast, other ‘backward’ casts, and other groups), an urban-rural dummy, and a dummy capturing whether the head of household was a female.
5. Assessing the effects of Aarogyasri: Results
Tables 7-9 present our estimates of AP’s excess growth in: (a) utilization of inpatient and outpatient care, expenditure on inpatient and outpatient care, and the methods of financing the costs of inpatient care. Each table shows – for the sample as a whole, and for the poorest 40 percent and richest 60 percent – the fixed- effects estimate of the (additional) impact of the AP initiatives (i.e. AP’s excess
28 Sources of drinking water include hand well, water tankers, pucca well, pond, canal and tab. Energy used for cooking was categorized as coke/coal/charcoal, fire, liquefied petroleum gas, biogas, dung cake and electricity. The type of latrine included flash system/septic tank, service, other and no latrine. The types of drainage included open kutcha, open pucca, covered pucca, underground, and no drainage. Structure of the house was divided in the categories homeless or living in kutcha structure and pucca or semi-pucca structure.