SUPPLEMENTAL DATA
Seismic processing sequence
Reprocessing included trace editing, multiple suppression, deconvolution, velocity analysis, scaling, post-stack migration, and for some lines, pre-stack depth migration (Figs S 1 and S 2).
Deconvolution increased the temporal resolution, and migration improved structural detail by properly positioning the reflectors in space, thereby collapsing diffractions to their point of origin. This reprocessing resolved fault plane reflections that in the past were only inferred from stratal truncations (Fig S1). The resulting images resolve previously undetected tectonic relations in the frontal prism backstop area and structures in the zone of extensional faulting.
We found that the resolution of post-stack time migrated images converted to depth was commonly similar to that of pre-stack depth migrated images. Depth conversion with interval velocities from stacking was applied to shallow strata, and velocities in deep regions were guided by a wide-angle crustal velocity section in the Unimak segment [Lizarralde et al., 2002].
Reprocessing achieved imaging to greater depth, especially in lines where enhanced multiple rejection was applied. We used a similar processing sequence for Aleut lines 04, 05, and 06, and the superior acquisition parameters (12.5 m versus 24 m trace interval, 8 km versus 2.4 km streamer length, and a larger seismic source) afforded greater resolution (Fig S1 c).
Extensional fault across the upper plate
The remarkable LDE fault zone image developed with ALEUT line 05 data [Bécel et al., 2017]
shows that the LDE fault can be rooted in the plate interface. This is indeed an amazing image since the velocity contrast that produces a reflection across a dipping fault zone is normally too small to produce a readable image at 20 to 40 km depth. The LDE fault zone bright spot
reflections appear to be 1 to 2 km thick and discontinuous, whereas those from the plate interface are thin and continuous. Dipping reflections from such great depths require an impedance contrast such as that caused by a large concentration of fluid. It may be that they exist locally, which could explain why similar features are not seen in the 6 other RV Langseth lines that cross the Alaska convergent margin.
FIGURE CAPTIONS
Figure S 1, Seismic imaging in the lower slope Backstop Splay Fault Zone (BSFZ) area. A legacy and current image comparison shows improved resolution from reprocessing. Legacy data in Bruns et al., (1987) A”compared with B” shows the improved resolution in the reprocessed image. C is an image from nearby ALEUT line, A-05 (Fig 1) that illustrates improved resolution with the RV Langseth acquisition system. Compare these time sections with depth sections in Figures 2 and 4 .
Figure S 2 Upper slope Shumagin Ridge area; images A and B illustrate improved resolution in shallower water that is pointed out and annotated in image C. Compare these reprocessed time sections with the image in Figure 9 that shows how conversion to depth corrects structural associations. Images are clearer when enlarged.
Figure S 3 Bathymetry of Figure 1 in perspective looking from the SW. Some of the seismic lines are eliminated to avoid covering too much of the morphology. Only part of Unimak Seamount is covered by multibeam bathymetry and the local mid-slope terrace coalescing into a more coherent Aleutian style terrace is shown in the foreground.
Figure S 4 Perspective of Shumagin segment bathymetry viewed from the NE. The notch at the location of A04 indicates the location of that line. Note the change in morphology at the BSFZ and the decrease in morphological expression of the BSFZ and Shumagin Ridge.
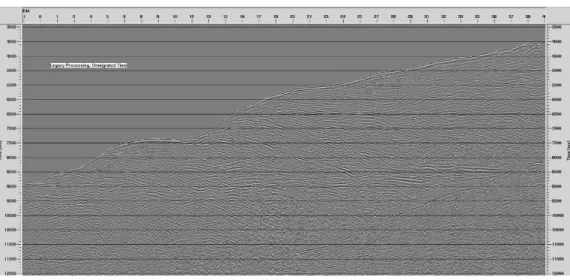
SUPPLEMENTAL DATA, ILLUSTRATION Figure S 1
B. Line 217, migrated time section, same data, processed with current software.
C. Line ALEUT 05, 14km from 217, migrated time section processed same as above Figure S 2
A. Line 217, time section, Bruns et al., 1987, processed with legacy stacking velocities
B Line 217, time section, migrated during reprocessing with 2018 stacking velocities.
C. specific improvements with 2018 processing software – enlarge view for detail
Figure S 3
Figure S 4